Abstract
Abstraction networks are compact summarizations of terminologies used to support orientation and terminology quality assurance (TQA). Area taxonomies and partial-area taxonomies are abstraction networks that have been successfully employed in support of TQA of small SNOMED CT hierarchies. However, nearly half of SNOMED CT’s concepts are in the large Procedure and Clinical Finding hierarchies. Abstraction network derivation methodologies applied to those hierarchies resulted in taxonomies that were too large to effectively support TQA. A methodology for deriving sub-taxonomies from large taxonomies is presented, and the resultant smaller abstraction networks are shown to facilitate TQA, allowing for the scaling of our taxonomy-based TQA regimen to large hierarchies. Specifically, sub-taxonomies are derived for the Procedure hierarchy and a review for errors and inconsistencies is performed. Concepts are divided into groups within the sub-taxonomy framework, and it is shown that small groups are statistically more likely to harbor erroneous and inconsistent concepts than large groups.
Introduction
Terminologies are often large and highly complex structures, making activities such as terminology quality assurance (TQA) difficult and laborious. Terminology browsers such as CliniClue Xplore [1] are very good at providing users and terminology editors with entry into terminological content. For example, they offer a view of a concept’s immediate neighbors, including parent and child concepts and targets of lateral relationships. However, browsers are not useful for revealing the foundational configuration of an entire hierarchy of a terminology, important for TQA work.
The Systematized Nomenclature of Medicine – Clinical Terms (SNOMED CT, or SCT for short) is one of the most widely used medical terminologies. In previous research [2], we have developed two kinds of abstraction networks (ANs)—high-level compact summarizations—to support TQA efforts for SCT. The first, the area taxonomy, is based on a structural partition of a hierarchy. The second, the partial-area taxonomy, is derived from the area taxonomy via the grouping of semantically similar concepts.
In [2], it was shown using the Specimen hierarchy that the two taxonomies successfully support TQA tasks. However, Specimen is relatively small, with only 1,329 concepts. The amount of knowledge varies widely between different SCT hierarchies. For example, in Procedure we find 52,284 concepts, and in Clinical Finding, 98,544. The number of concepts in a hierarchy affects the applicability of our taxonomy-based TQA approach. Moreover, the large number of relationship types defined for these hierarchies results in a large number of structural partitions and causes a growth in taxonomy size. Specimen has five different relationship types, whereas Procedure has 28. With an order of magnitude increase in hierarchy size and number of relationship types, the taxonomies tend to lose their compactness and, hence, their effectiveness from a TQA standpoint; e.g., Procedure’s partial-area taxonomy has over 10,000 concept groupings.
In this paper, we present a methodology for deriving sub-taxonomies in order to partition taxonomies for large SCT hierarchies into more manageable pieces. This approach offers scalability of our taxonomy-based TQA regimen to those hierarchies, to which it was previously inapplicable. The sub-taxonomies themselves support the partitioning of collections of a large hierarchy’s concepts into groups such that some groups comprise concepts expected to have a higher likelihood of errors and inconsistencies—thus, helping to focus the effort and increase the effectiveness of domain-expert TQA personnel. The methodology is applied to SCT’s large Procedure hierarchy. The results of the TQA effort are presented.
Background
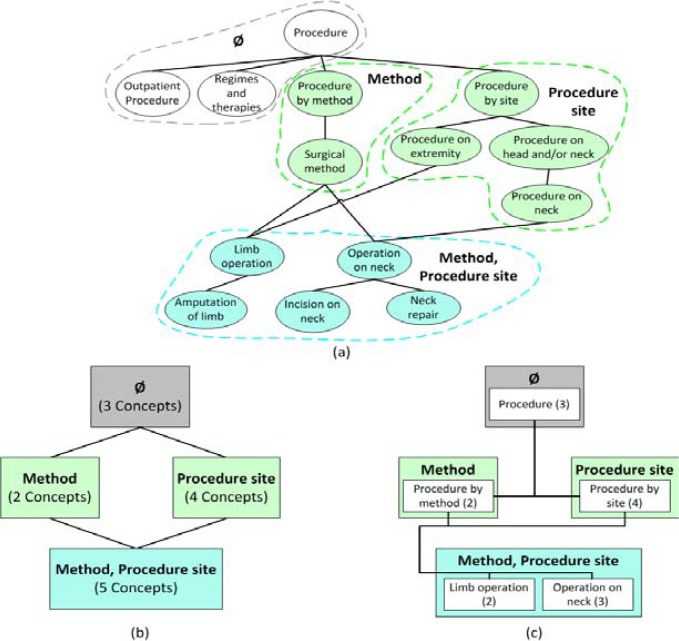
Abstraction networks, such as taxonomies [2], are compact networks used to summarize the contents of a terminology. The area taxonomy is based on a concept grouping called an area, comprising concepts that all share the same set of outgoing attribute relationships. Diagrammatically, an area is a box labeled with the common relationships. (In the text, the relationships are placed in braces to form the area name.) Concept information aside from the relationships is abstracted away. To demonstrate this, consider Figure 1(a) with 14 concepts (labeled with their fully specified names) from the Procedure hierarchy. The lines are IS-As between concepts. Concepts with the same outgoing attribute relationships (relationships, for short) are grouped together in a common bubble. For example, the concepts Procedure by site, Procedure on extremity, Procedure on head and/or neck, and Procedure on neck have a single relationship named Procedure site. Procedure, Outpatient procedure, and Regimes and therapies have no relationships and are thus grouped in the ∅ (empty set) bubble.
Figure 1.
(a) Excerpt of concepts from Procedure hierarchy. Relationships common to all concepts in a given bubble are listed. (b) Area taxonomy derived from this excerpt. (c) Partial-area taxonomy derived from the same excerpt.
Figure 1(b) shows the area taxonomy for Figure 1(a). Procedure by method and Surgical method are now represented solely by the area {method}. Similarly, Limb operation, Amputation of limb, Operation on neck, Incision on neck, and Neck repair are represented by area {method, procedure site}. Areas are organized into color-coded levels based on the number of relationships.
In every area, there will be one or more concepts that do not have a parent within the area. Such concepts are called roots. An IS-A from a root to its parent in another area yields a hierarchical connection between the respective areas called child-of. In Figure 1(b), child-of’s are represented as bold lines. For example, {method, procedure site} is child-of {method} as well as {procedure site}. IS-As between concepts within an area are abstracted away, just as the concepts they are connecting. Every concept is in exactly one area, i.e., all areas are disjoint.
The partial-area taxonomy refines the area taxonomy with the inclusion of partial-areas, each consisting of a root and all of its descendants in its area. Thus, the number of partial-areas in an area is equal to the number of roots. Figure 1(c) shows an example. Each partial-area appears as a white box inside its area. Its label is its root, and the parentheses hold its number of concepts. All other information is abstracted away.
The concept Procedure by method, a root of {method}, and its child Surgical method are grouped into the partial-area Procedure by method, the white box in {method}. Partial-areas are also linked by child-of’s derived from the underlying IS-As. In particular, a partial-area A is a child-of another partial-area B if A’s root has a parent in B. In Figure 1(c), Procedure by site is child-of Procedure. In general, TQA methodologies have been designed around the use of partial-area taxonomies, with the partial-area being the primary taxonomic element reviewed.
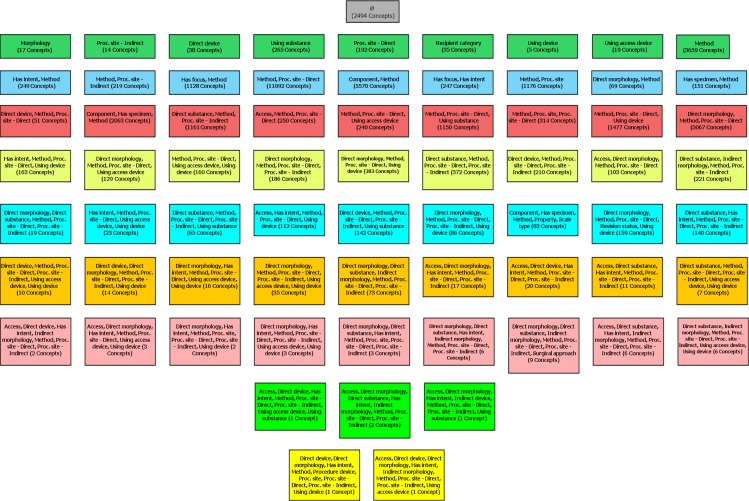
The size of taxonomies is dependent on (a) the number of concepts in the hierarchy, (b) the number of relationship types defined for the hierarchy, and (c) the combinations of relationships appearing in actual concepts. The partial-area taxonomy of the Specimen hierarchy (with five relationships and a total of 1,329 concepts) has only 22 areas and 409 partial-areas. In the case of Procedure, with 52,284 concepts and 28 types of relationships in 735 combinations, the partial-area taxonomy has 735 areas and 10,621 partial-areas. Figure 2 shows a small portion (69 areas) of the area taxonomy. The number of concepts per area is indicated in parentheses. The entire area taxonomy at the scale of Figure 2 would be 23 pages wide. The partial-area taxonomy diagram would be over 100 pages by 4 pages at the scale of Figure 4.
Figure 2.
A small portion of the ten levels of the Procedure hierarchy’s area taxonomy
Figure 4.
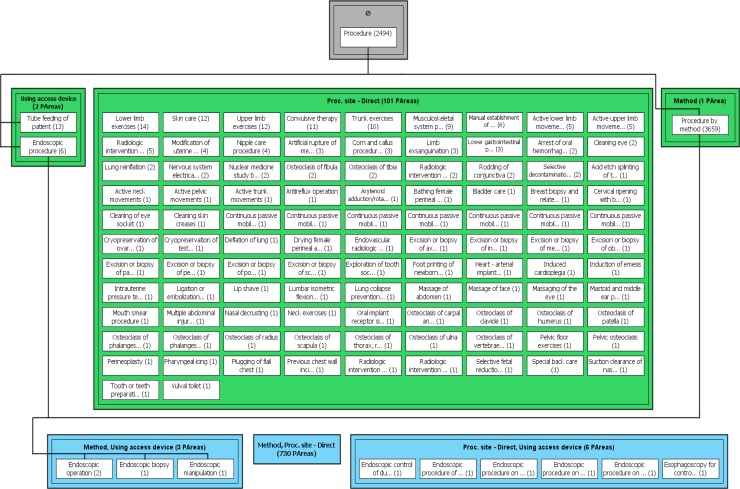
Levels 0 and 1 and part of Level 2 of the partial-area sub-taxonomy with respect to the three selected relationships
In previous work, we have shown how the partial-area taxonomy can support TQA, e.g., through the use of anomalies that appear within the taxonomy itself. In general, the partial-area taxonomy has been shown to reveal groups of concepts having statistically significantly higher concentrations of errors and inconsistencies. One relatively simple TQA strategy has been to focus on “small” partial-areas, with several threshold values for “small” being possible [3, 4]. This approach has already proven useful for the Specimen hierarchy [3] and the National Cancer Institute thesaurus’s (NCIt’s) [5, 6] Biologic Process hierarchy [4].
Given the scope of Procedure’s partial-area taxonomy (10,621 partial-areas), even a review of the small partial-areas is impractical. Using the definition of small found in the Results section (partial-areas of size three or less) there are 9,359 (9,236/10,621=88.1%) small partial-areas in the Procedure partial-area taxonomy, encompassing 11,239 concepts (11,239/52,284=21.5% of the hierarchy). This is still far too much information to process effectively. In other words, the taxonomy-based TQA strategy, as it stands, does not scale to large hierarchies. Dealing with this issue is the primary focus of this paper.
Let us note that various other semantic, structural, and ontological techniques [7–11] have been developed for TQA of SCT. For a summary of such auditing techniques, see [12]. The partial-area taxonomy TQA methodology can be used independent of, or in conjunction with, other TQA methodologies.
Methods
We begin by first automatically deriving a relationship-constrained area sub-taxonomy and a relationship-constrained partial-area sub-taxonomy (sub-taxonomy for short when there is no ambiguity) by restricting the number of relationships used. Specifically, a subset of the hierarchy’s defined relationships is chosen to derive the areas. For example, assume we are dealing with a hierarchy of 10 relationships, r1, r2, …, r10. The area sub-taxonomy with respect to, say, the four relationships r1, r4, r6, and r8 may only include areas {r1, r4, r6, r8}, {r1, r4, r6}, {r1, r4, r8}, {r1, r6, r8}, {r4, r6, r8}, {r1, r4}, etc. That is, only areas involving subsets of {r1, r4, r6, r8} (including ∅) are allowed. As such, there are a maximum of (= 210) areas in the sub-taxonomy. Note that only combinations that exist in the hierarchy are considered, and many combinations of relationships may not exist.
Once the subset R of relationships is chosen, the definition of the area sub-taxonomy is similar to that of the complete area taxonomy but is restricted to those areas whose relationships are all members of R. Because ∅ is a subset of any R, the area ∅ appears in every area sub-taxonomy. The definition of the partial-area sub-taxonomy with respect to R follows the definition of the complete partial-area taxonomy for the specific hierarchy, again limited to the areas of the area sub-taxonomy for R.
Many combinations of relationships may not produce meaningful area sub-taxonomies because the relationship combinations of the chosen subset do not appear in the hierarchy. Hence, one should carefully choose the subsets of relationships to use for sub-taxonomy generation. Let us note that we have built a software tool called the Biomedical Layout Utility for SNOMED CT (BLUSNO) for rapid derivation, visualization, and exploration of sub-taxonomies [13]. One can start with the complete taxonomy of a hierarchy, available in BLUSNO, and then select an area of interest and choose its set of relationships for defining the sub-taxonomy. Figures 4 and 5 were created using the visualization capabilities of the BLUSNO tool.
Figure 5.
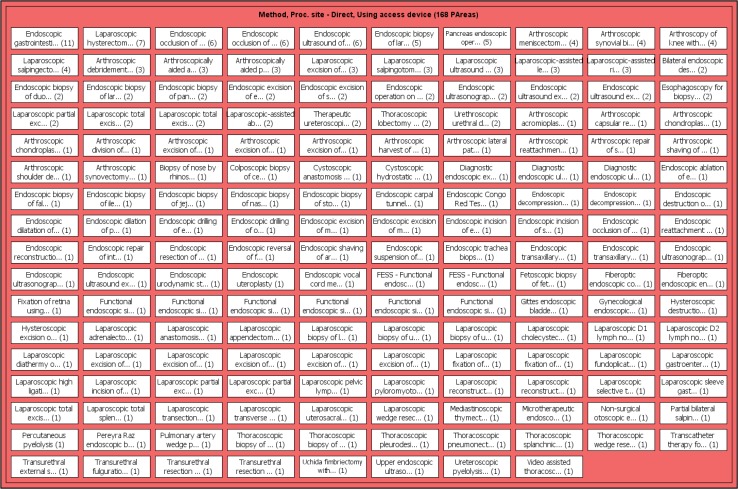
The only third-level area of the sub-taxonomy with respect to the relationships method, procedure site – direct, and using access device
The second step of our methodology is the TQA process itself, which involves review of concepts expected to have a higher likelihood of error. In this work, as in our previous research [3, 4], that entails processing the small partial-areas of a chosen sub-taxonomy. In fact, based on our findings in [3], we propose to test the following hypothesis:
Hypothesis:
In a sub-taxonomy of a large SCT hierarchy, small partial-areas have higher error concentrations than large partial-areas.
We will test this hypothesis for a sub-taxonomy of the Procedure hierarchy. Following our previous research [3, 4], the threshold value distinguishing small from large will be determined experimentally in our study, with an eye toward maximizing the statistical significance between the respective error percentages. Modifying the boundary between small and large changes the number of concepts that are recommended for TQA review. Let us note that typically the change in error rates when progressing from small to large partial-areas is gradual rather than sharp.
Results
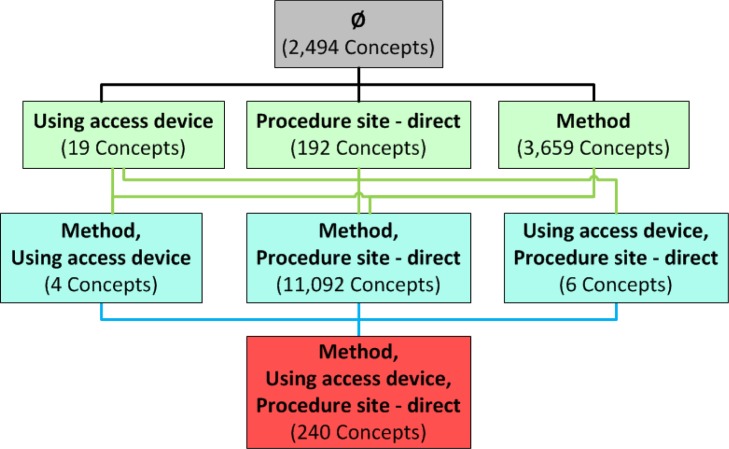
We derived a sub-taxonomy of SCT’s Procedure hierarchy (Jan. 2011 release) by choosing the three relationships method, procedure site – direct and using access device. Figure 3 shows the eight areas of the sub-taxonomy. They reside on four levels. With only eight areas, this figure is much more manageable to scan than Figure 2 with 69 areas. In Figures 4 and 5, long partial-area names are truncated to save space. Within BLUSNO, selecting a partial-area displays its entire name. Partial-area child-of links are only displayed for three small areas in Figure 4 for demonstration purposes. For easier readability, BLUSNO provides an interactive environment that enables zooming in on visualizations like Figures 4 and 5. On Level 1, we find three areas, 104 partial-areas, and 3,870 concepts. Note that the total number of concepts, namely, 17,706 (covering 34% of Procedure) is still overwhelming. Figure 3 shows the child-of links, between areas, using the same color as the target area. The largest level is Level 2 containing the largest area {method, procedure site – direct} with 11,092 concepts. The second largest level is Level 1, mainly due to the area {method}. This is followed by Level 0 with the area ∅.
Figure 3.
Area sub-taxonomy with respect to the three relationships using access device, procedure site – direct, and method
For further orientation into the content of this sub-taxonomy, we refer to Figures 4 and 5. The largest area {method, procedure site – direct}, with 730 partial-areas, is hidden due to space limitations. The fact that {method, procedure site – direct} has so many partial-areas and concepts is not surprising; there are a very large number of methods for procedures and a large number of body sites. The large blue area is obtained when these multiplicities are combined.
The partial-areas of the sub-taxonomy are separated into small and large based on their numbers of concepts. The hypothesis is that errors appear in higher concentrations in the small partial-areas than they do in the larger ones. To test this hypothesis, we audited all of the concepts of two areas, {procedure site – direct} (green) with 192 concepts and {method, using access device, procedure site - direct} (red) with 240 concepts. One large partial-area Neck excision (118) from {method, procedure site - direct} (blue) was also audited. In total, 550 concepts from the sub-taxonomy were individually reviewed for errors and inconsistencies. The green and red areas that were selected have a few medium-sized partial-areas and many small ones. The partial-area Neck excision with 118 concepts selected from {method, procedure site – direct} adds concepts from a large partial-area. These concepts were chosen for review because they have different numbers of relationships and are from different size partial-areas.
The auditing was conducted by one of the authors (YC), trained in medicine and experienced in terminology auditing. The inferred view of SCT (Jan. 2011) was used throughout the auditing process. The focus was on errors and inconsistencies involving incorrect or missing parents or children—errors that were deemed to be most troublesome in a study of SCT users’ preferences [14]. Due to their definitional role in modeling a concept, such basic errors and inconsistencies may cause additional problems with relationships due to inheritance. We note that missing or incorrect child errors can be restated as missing or incorrect parent errors for the child concept. However, we report them as missing or incorrect children according to the perspective of the auditor.
Out of the total of 550 concepts reviewed, 67 (12.2%) were found to contain errors or inconsistencies. Table 3 illustrates four examples of such problems found during our review. Table 4 gives the distribution based on partial-area size. Out of the 67 errors and inconsistencies, we found 31 concepts with at least one incorrect or redundant parent and 27 concepts missing at least one parent. We found that 44 (66% = 44/67) of the problematic concepts were primitives, indicating that certain knowledge about these concepts may be missing from the terminology.
Table 3.
Four examples of inconsistencies identified in the TQA review of the sub-taxonomy
| Concept | Partial-area | Problem Type | Correction |
|---|---|---|---|
| Endoscopic Congo Red Test | Endoscopic Congo Red Test (1) | Missing parent: Congo Red Test | Add IS-A directed to Congo Red Test |
| Ureteroscopic pyelolysis | Ureteroscopic pyelolysis (1) | Missing parent: ureteroscopic operation | Add IS-A directed to ureteroscopic operation |
| Endoscopic drilling of ovary | Endoscopic drilling of ovary (1) | Incorrect parent: cauterization of ovary | Replace with IS-A directed to drilling of |
| Convulsive therapy | Convulsive therapy (11) | Missing parent: Therapeutic procedure | Add IS-A directed to Therapeutic procedure |
Table 4.
Summary of errors found in the audit of the sample partial-areas of the sub-taxonomy
| Partial-area Size | # Partial-Areas | Total # Concepts | # Erroneous Concepts | % Erroneous Concepts |
|---|---|---|---|---|
| 118 | 1 | 118 | 12 | 10 |
| 14 | 1 | 14 | 1 | 7 |
| 12 | 2 | 24 | 1 | 4 |
| 11 | 2 | 22 | 1 | 5 |
| 10 | 1 | 10 | 1 | 10 |
| 9 | 1 | 9 | 0 | 0 |
| 7 | 1 | 7 | 2 | 29 |
| 6 | 4 | 24 | 2 | 8 |
| 5 | 4 | 20 | 3 | 15 |
| 4 | 6 | 24 | 1 | 4 |
| 3 | 12 | 36 | 7 | 19 |
| 2 | 26 | 52 | 7 | 13 |
| 1 | 190 | 190 | 29 | 15 |
| Total: | 251 | 550 | 67 | 12 |
We chose three as the threshold because it maximized the statistical significance of error rates between small and large partial-areas (15.4% vs. 8.8% erroneous, respectively), with p < 0.019 according to the Fisher exact 2-tailed statistical test. Therefore, an auditor reviewing partial-areas of size three or less is expected to uncover more inconsistencies than if they reviewed other partial-areas. Thresholds of five and seven were also found to be statistically significant with p<0.047 and p<0.031, respectively. A threshold of seven had a slightly higher ratio of errors (1.76 = 14.4/8.2) in small (14.4%) versus large (8.2%) compared to a threshold of three (1.75 = 15.4/8.8). In Table 5, we show results with respect to small partial-areas (1–3 concepts) and large partial-areas (4–118 concepts).
Table 5.
Summary of erroneous concepts broken down into small and large partial-areas
| # Partial-areas | # Concepts | # Erroneous Concepts | % Errors | |
|---|---|---|---|---|
| Small Partial-areas (1–3) | 228 | 278 | 43 | 15.4 |
| Large Partial-areas (4–118) | 23 | 272 | 24 | 8.8 |
| Total: | 251 | 550 | 67 | 12.2 |
Of course, there are also errors in large partial-areas (8.8% in our sample). Due to the better auditing yield as measured by the ratio of the number of errors to the number of concepts in our sample, we recommend that an auditor start with small partial-areas, where the cumulative number of concepts is relatively small. For the large partial-areas, we recommend that the auditor exploit previously developed strategies (e.g. review concepts in the intersections of two or more partial-areas [15]) that have been shown to increase the efficiency of TQA efforts.
Discussion
Our approach is to increase TQA productivity by developing computational techniques for directing efforts to subsets of concepts where the likelihood of error is higher than for general concepts. Such an approach was used with other criteria in [3, 15] for SCT. The approach was found to be more difficult to implement for large hierarchies, where the need is more critical. In this paper, we showed that the methodology is scalable to large SCT hierarchies by utilizing sub-taxonomies. In particular, we demonstrated our approach on the challenging Procedure hierarchy, with the second largest number of concepts and a large number of relationships.
Let us discuss issues regarding the choice of a specific sub-taxonomy. Reviewers can select different subsets of relationships in order to focus on portions of the hierarchy most relevant to them. Someone interested in procedures requiring both a direct device and an access device may select the relationships method, procedure site – direct, direct device, and using access device. On the other hand, if the interest were in procedures requiring only a direct device, then the first three of these relationships would be chosen, with using access device omitted. Alternatively, one could first find a concept of interest and then use its relationships to generate the sub-taxonomy.
The methodology implied in this study is to audit all small partial-areas in a sub-taxonomy. There are, in total, only 734 concepts out of 17,706 (4%) in small partial-areas (of 1–3 concepts) in the sub-taxonomy chosen for this study. This is a limited auditing effort expected to uncover erroneous concepts at a rate of 15.1%. For each of the 67 erroneous concepts identified we performed a follow-up review using the Jan. 2012 release. Sixty-five concepts were unchanged and two concepts had minor changes but were still inconsistent.
These studies will be repeated for more Procedure sub-taxonomies, as well as for the other large SCT hierarchies, e.g., Clinical finding. We will address the issue of choosing subsets of relationships to create disjoint sub-taxonomies that cover the majority of a hierarchy’s concepts. By reviewing the full partial-area taxonomy, one could select a subset of, say, three relationships by picking an area at Level 3 with relatively many partial-areas. Next, one could choose another such area with a disjoint relationship set to the first one, etc. In this way, all areas but the root area would be disjoint in the sub-taxonomies. In future research, we will develop an appropriate algorithm for this.
In future work, we plan to further automate TQA by using lexical subsumption techniques [16] to automatically suggest potential parents and children for each concept identified as having a higher likelihood of error. Many of our findings involved instances of incorrect, possibly missing, redundant, or too-general parents. However, parents and children often share common lexical traits with respect to their preferred names, descriptors, and synonyms. In the first example of Table 3, Congo Red Test is a missing parent of Endoscopic Congo Red Test. Such an error could be uncovered and fixed by utilizing lexical suggestion techniques to first identify the potentially missing parent. The auditor would be asked to examine a list of potential parents. The effectiveness of auditors would be increased with such suggestions. While our structural TQA methodology successfully highlights suspicious concepts, analyzing them without dedicated tools requires exhaustive effort on the part of auditors. By combining structural and lexical techniques, auditors will be more efficient and less likely to miss instances of errors and inconsistencies.
Another research issue is what partial-area size range should constitute “small.” In our current study, the boundary was selected to maximize the statistical significance of the error rate between small and large partial-areas. Let us also note that the same threshold value of three is found in [4] regarding the NCIt. Seven was previously used as a boundary for SCT’s Specimen hierarchy [2]. In our sub-taxonomy’s sample, seven maximized the ratio of errors in small versus errors in large, but with a p-value greater than for a threshold of three. More research is needed to explore this issue. Moreover, future research should focus on alternative criteria for identifying subsets of concepts with higher error-rates. Examples include strict-inheritance regions [3] and overlapping concepts [15]. Harnessing computational techniques to better utilize limited TQA resources should be preferred to auditing random selections.
Conclusions
In this paper, we showed that the abstraction network-based TQA methodology successfully scales to large SNOMED CT hierarchies. In the first step, area and partial-area sub-taxonomies were derived based on a selection of a given hierarchy’s set of defined relationships. In the second step, concepts with potentially higher error-rates were separated from other concepts to reduce an auditor’s sphere of consideration. We successfully applied this sub-taxonomy methodology to SNOMED CT’s large Procedure hierarchy. It was shown that when concentrating on the relatively small portion of concepts residing in small concept groupings (called partial-areas) a statistically significantly higher error/inconsistency rate was found. Overall, the new TQA approach can be seen as complementing the existing array of TQA methodologies currently in use for SNOMED CT.
Acknowledgments
This research was partially supported by the NLM under grants LM008912 and LM008912-S2.
References
- 1.CliniClue Xplore Available from: http://www.cliniclue.com/software.
- 2.Wang Y, Halper M, Min H, et al. Structural methodologies for auditing SNOMED. J Biomed Inform. 2007 Oct;40(5):561–81. doi: 10.1016/j.jbi.2006.12.003. [DOI] [PubMed] [Google Scholar]
- 3.Halper M, Wang Y, Min H, et al. Analysis of error concentrations in SNOMED. AMIA Annu Symp Proc. 2007:314–8. [PMC free article] [PubMed] [Google Scholar]
- 4.Min H, Perl Y, Chen Y, et al. Auditing as part of the terminology design life cycle. J Am Med Inform Assoc. 2006 Nov-Dec;13(6):676–90. doi: 10.1197/jamia.M2036. [DOI] [PMC free article] [PubMed] [Google Scholar]
- 5.Sioutos N, de Coronado S, Haber MW, et al. NCI Thesaurus: a semantic model integrating cancer-related clinical and molecular information. J Biomed Inform. 2007 Feb;40(1):30–43. doi: 10.1016/j.jbi.2006.02.013. [DOI] [PubMed] [Google Scholar]
- 6.Fragoso G, de Coronado S, Haber M, et al. Overview and utilization of the NCI thesaurus. Comp Funct Genomics. 2004;5(8):648–54. doi: 10.1002/cfg.445. [DOI] [PMC free article] [PubMed] [Google Scholar]
- 7.Rector AL, Brandt S, Schneider T. Getting the foot out of the pelvis: modeling problems affecting use of SNOMED CT hierarchies in practical applications. J Am Med Inform Assoc. 2011 Jul-Aug;18(4):432–40. doi: 10.1136/amiajnl-2010-000045. 2011. [DOI] [PMC free article] [PubMed] [Google Scholar]
- 8.Rector AL, Iannone L. Lexically suggest, logically define: Quality assurance of the use of qualifiers and expected results of post-coordination in SNOMED CT. J Biomed Inform. 2011 Oct. doi: 10.1016/j.jbi.2011.10.002. [DOI] [PubMed] [Google Scholar]
- 9.Schulz S, Hahn U, Rogers J. Semantic Clarification of the Representation of Procedures and Diseases in SNOMED((R))CT. Stud Health Technol Inform. 2005;116:773–8. [PubMed] [Google Scholar]
- 10.Schulz S, Hanser S, Hahn U, et al. The semantics of procedures and diseases in SNOMED CT. Methods Inf Med. 2006;45(4):354–8. [PubMed] [Google Scholar]
- 11.Schulz S, Suntisrivaraporn B, Baader F, et al. SNOMED reaching its adolescence: ontologists’ and logicians’ health check. Int J Med Inform. 2009 Apr;78(Suppl 1):S86–94. doi: 10.1016/j.ijmedinf.2008.06.004. [DOI] [PubMed] [Google Scholar]
- 12.Zhu X, Fan JW, Baorto DM, et al. A review of auditing methods applied to the content of controlled biomedical terminologies. J Biomed Inform. 2009 Jun;42(3):413–25. doi: 10.1016/j.jbi.2009.03.003. [DOI] [PMC free article] [PubMed] [Google Scholar]
- 13.Geller J, Ochs C, Perl Y, et al. New Abstraction Networks and a New Visualization Tool in Support of Auditing the SNOMED CT Content. AMIA Annu Symp Proc. 2012 2012 Nov 3;:237–46. [PMC free article] [PubMed] [Google Scholar]
- 14.Elhanan G, Perl Y, Geller J. A survey of SNOMED CT direct users, 2010: impressions and preferences regarding content and quality. J Am Med Inform Assoc. 2011 Dec;18(Suppl 1):i36–44. doi: 10.1136/amiajnl-2011-000341. [DOI] [PMC free article] [PubMed] [Google Scholar]
- 15.Wang Y, Halper M, Wei D, et al. Auditing complex concepts of SNOMED using a refined hierarchical abstraction network. J Biomed Inform. 2012 Feb;45(1):1–14. doi: 10.1016/j.jbi.2011.08.016. [DOI] [PMC free article] [PubMed] [Google Scholar]
- 16.Rus V, Lintean M, Graesser AC, et al. Applied natural language processing: identification, investigation, and resolution: IGI Global. 2012. Chapter 7: Text-to-Text Similarity of Sentences; pp. 110–21. [Google Scholar]


