Abstract
This paper describes the Apollo Web Services and Apollo-SV, its related ontology. The Apollo Web Services give an end-user application a single point of access to multiple epidemic simulators. An end user can specify an analytic problem—which we define as a configuration and a query of results—exactly once and submit it to multiple epidemic simulators. The end user represents the analytic problem using a standard syntax and vocabulary, not the native languages of the simulators. We have demonstrated the feasibility of this design by implementing a set of Apollo services that provide access to two epidemic simulators and two visualizer services.
Introduction
The goal of the Apollo project is to create a standard way for programs to access epidemic simulators and thus increase the accessibility, ease of use, and utility of epidemic simulators for research and public health practice.
Our approach is to develop an ontology, called Apollo-SV (Structured Vocabulary), for the domain of epidemic simulation, proceeding through a series of releases (versions) of the ontology with increasing coverage of diseases and control measures. The ontology provides a standard vocabulary and set of definitions, to which we add standard syntaxes for representing simulator configuration and simulation results. The Apollo Web Services combines these elements into an operational system that end-user applications can use to find and run epidemic simulators.
Background
An epidemic simulator is an algorithm that takes as input the current disease state of a population and optionally a description of disease control measures, and produces as output predictions of future disease states. The input is referred to as the simulator configuration.
Although there is heterogeneity among epidemic simulators, a dominant model at present is agent-based simulation. Agent-based simulation is attractive to analysts because it allows fine-grained socio-demographic and geographic stratification of a population. Agent-based simulation also make possible the simulation of disease control measures that work by increasing the social distance among individuals, such as school closure. A standard language for describing the configuration of simulators must be expressive enough to represent these stratifications.
Epidemic simulators are of increasing importance due to bioterrorism and the threat of emerging diseases. They were integral to the U.S. response to the 2009 H1N1 pandemic, when groups such as the NIGMS Modeling Infectious Disease Agent Studies (MIDAS) research network were called into action to provide operational modeling for the Department of Health and Human Services, the Centers for Disease Control, and the Department of Homeland Security.1 During the pandemic, decision makers worried whether the new H1N1 vaccine would be available in time1, 2 and therefore considered closing schools,3, 4 prioritizing vaccination to certain groups, and using adjuvants to increase the vaccine supply. To inform these decisions, analysts ran thousands of epidemic models of these disease control measures under different assumptions about the expected outbreak’s timing, reproductive rate, incubation period, case severity, and other characteristics.5, 6
However, the 2009 H1N1 experience identified a limitation of existing epidemic simulators, which this project addresses: To use them, a great deal of time and effort must be spent translating possible outbreak scenarios and control measures into the non-standard languages for configuration and results used by different epidemic models. The terminology and syntax of the configuration files were all unique; thus, it was difficult to know whether two models were modeling the same complex scenario. The problem was compounded by the need to explore many scenarios. The policy exploration was iterative, with each evolution having a turnaround time of many hours to a day. Without standardization, the use of epidemic simulation to guide response in practice will continue to be labor intensive and error prone.
Methods
We created a standard for epidemic simulator configuration and output and a set of Web services that use this standard to enable programmatic access to simulators. The standard comprises the Apollo-SV ontology, a vocabulary defined by the ontology, a message syntax, and set of well-defined programmatic interfaces (APIs).
Apollo-SV
Apollo-SV is an application ontology; it supports applications that find, configure and run epidemic simulators. Apollo-SV represents entities referenced in epidemic simulator configuration files and outputs, such as disease control strategies, vaccination efficacy, and fraction of population immune.
We developed Apollo-SV through an iterative process that began with analysis of the terms used in the configuration and output files of existing epidemic models including the FRED agent-based model and a SEIR model developed at the University of Pittsburgh. We chose an initial set of terms that would allow us to perform basic configuration of the epidemic simulators and understand enough output to plot epidemic curves and draw maps using visualizer services we discuss below. The next step was creating an entry in a white paper for each entity to which the terms in these files refer (Box 1). Each entry included the original term(s) (for tracking purposes), a disambiguated standard term, a unique term for use in Apollo Web Services (called the Unique Apollo Label), a formal ontological textual definition, and an elucidation that recasts this definition in language more familiar to subject matter experts. The textual definition is a precise, formal-ontological designation of the entities to which the class refers. The elucidation for each class helps the end-user select the terms she needs to configure epidemic models exactly according to her intention.
Box 1. White paper entry.
URI: http://purl.obolibrary.org/obo/APOLLO_SV_00000016
Unique Apollo Label: infectious period
Label: duration of infectiousness measurement datum
Definition: The measurement datum for the duration of the parts of an infectious disease course during which the host bears an infectious disposition in a population of hosts.
Elucidation: The duration of the infectiousness of infectious individuals in a population expressed in time step units, for example “6.1”
The subject matter experts and ontologists on the team iterated over the included terms, Unique Apollo Labels, textual definitions, and elucidations until the white paper reached stability. At that point, we created Apollo-SV as a Web Ontology Language (or OWL) artifact, building each entry in the white paper as a class in the ontology. We annotated each class with the disambiguated term, Unique Apollo Label, textual definition, and elucidation from the white paper. We also constructed logical definitions of each class from the white paper as description logic (DL) axioms using the DL supported by OWL 2.0. In the process, we imported pre-existing classes from the Ontology for General Medical Science, Infectious Disease Ontology, Phenotypic Quality Ontology, Ontology for Biomedical Investigations, Information Artifact Ontology, and the Ontology of Medically Related Social Entities. We used the MIREOT Protégé plugin described by Hanna et al.7 to carry out the import process.
Vocabulary
The vocabulary used in the Apollo Web Services comprises the following 42 Unique Apollo Labels:
| Software identification | Reproduction number | Reactive control measure |
| Software developer | Asymptomatic infection fraction | Vaccination control measure |
| Software name | Simulated population | Vaccine supply schedule |
| Software version | Population location | Vaccination administration schedule |
| Requester ID | Susceptible | Vaccination control measure compliance |
| Run ID | Exposed | Vaccination efficacy |
| Simulator time specification | Infectious | Vaccination efficacy delay |
| Time step | Recovered | Antiviral control measure |
| Time step unit | Symptomatic | Antiviral efficacy |
| Time step value | Asymptomatic | Antiviral efficacy delay |
| Run length | Awaiting control measure | Antiviral control measure compliance |
| Disease | Not awaiting control measure | Antiviral supply schedule |
| Infectious period | Received control measure | Antiviral administration schedule |
| Latent period | Awaiting effective control measure | Time series |
Syntax
We use an XML Schema Definition (XSD) file to represent the simulator configuration. XSD is a W3C-recommended language used to define sets of rules to which XML files must conform in order to be considered valid.
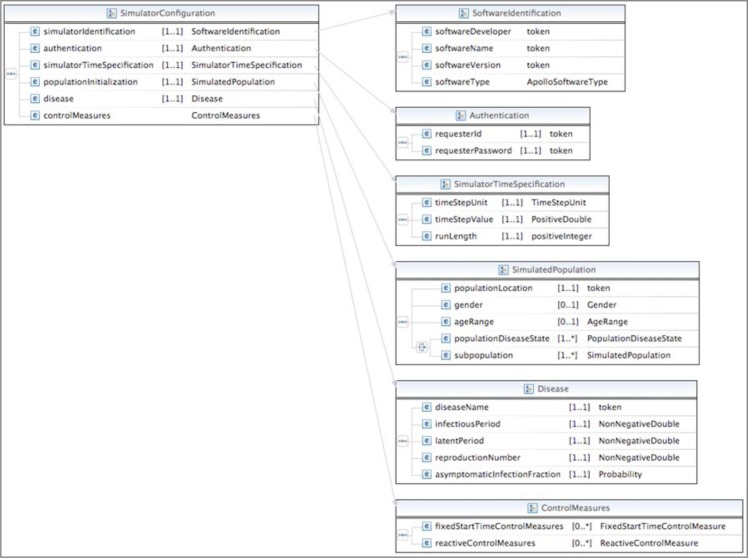
The SimulatorConfiguration data type is defined compositionally by six data types that specify (1) the simulator; (2) a user’s authentication credentials; (3) the temporal granularity and run length of a simulation; (4) the simulated population and its initial disease state; (5) the infectious disease, and (6) control measures (Figure 1).
Figure 1.
The SimulatorConfiguration and related types in the Apollo Web Services
The standard terms in the XSD file are represented by compacted versions of their Apollo Unique Labels. The compacted versions eliminate white spaces and capitalize the first letter after a deleted white space.
SQL
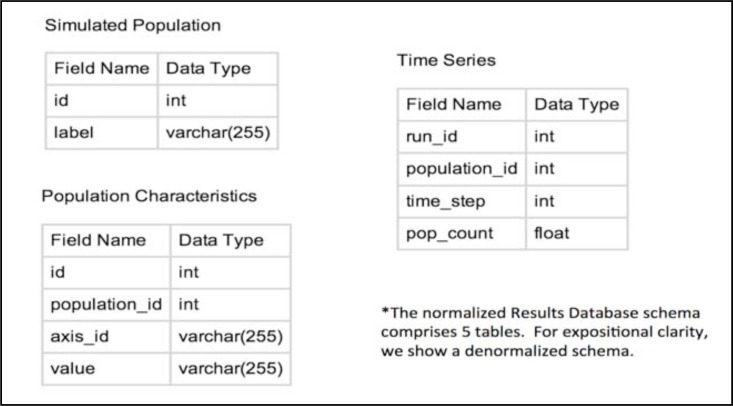
Figure 2 shows the schema of the results database. The database schema has two principle entities—simulated population in which each record represents a stratum (i.e., a spatial/sociodemographic subpopulation) of a simulated population; and time series, in which each record represents the counts of individuals in a stratum at one time step of a simulation.
Figure 2.
Schema of the results database
The stratification of a simulated population is represented by population characteristics, which are specified as orthogonal axes such as gender, age-range, disease status, and location. The axes take values such as male and female or INCITS (formerly known as FIPS) location codes. This schema is designed to accommodate whatever axes and values a simulator requires. The time series entity represents the counts of each simulated population for each time step of a simulation.
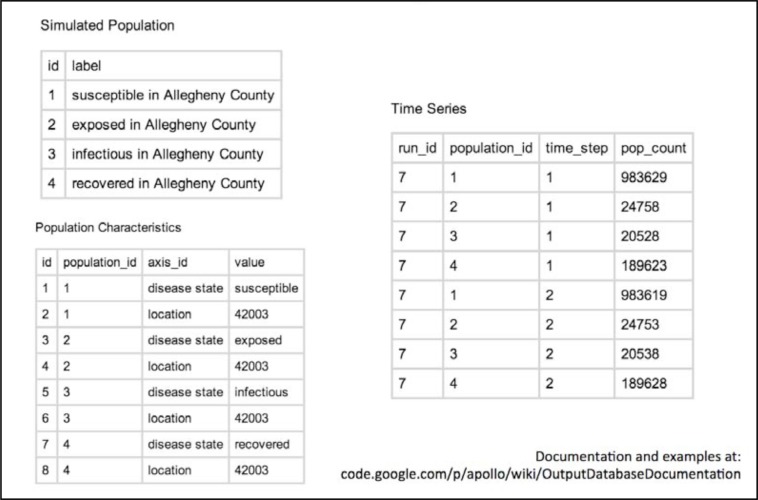
Figure 3 shows example output for a simulation that has just four simulated populations—those individuals who are susceptible, exposed, infectious, and recovered in Allegheny County (INCITS 42003). The time series table shows how the counts for these four simulated populations changed from time step 1 to time step 2.
Figure 3.
Example records in the results database
The terminology for the axes and values in the population characteristics table is defined by the Apollo-SV ontology. The ontology ensures that values for a specific axis are disjoint.
APIs of the Apollo Web Services
The Apollo Web Services at present comprise four types of Web service, each of which defines a programmatic interface for a class of applications such as epidemic simulators, visualizers, and programs that generate synthetic populations. The four service types are the Apollo Service, Simulator Service, Visualizer Service, and Synthetic Population Service.
We implemented these services using the SOAP protocol, which is an XML-based protocol that enables applications to exchange data over the Internet. This protocol, which most commonly transmits messages using the widely supported Hypertext Transfer Protocol (HTTP), is both platform and language independent.
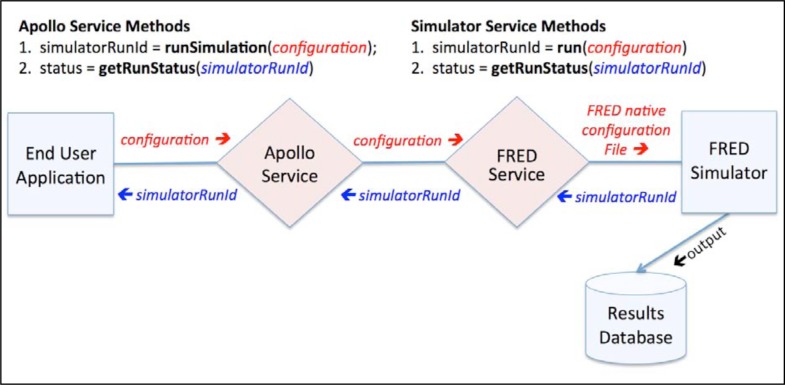
Figure 4 shows the two types of services that an end-user application would use to configure and run an epidemic simulator. An end-user application communicates directly only with the Apollo Service, which mainly functions to route service requests to other services. To run a simulation, an end-user application invokes the runSimulation method of the Apollo Service with a simulator configuration object as parameter. The Apollo Service then invokes the run method of the Simulator Service, here the FRED Simulator Service, with the simulator configuration object. The Simulator Service translates the simulator configuration information transmitted as a parameter with the SOAP request to the native vocabulary and syntax of the simulator. It then starts the simulator and returns a run identifier.
Figure 4.
An Apollo Service and a Simulator Service. The Simulator Service is specific to the FRED agent-based epidemic simulator.
When the simulator has completed the run, it writes its output in standard format to a results database. At present, our group maintains a single results database for the two simulators that are connected to Apollo. However, the architecture is flexible and each Simulator Service can maintain a results database for its own results.
The end-user application invokes the Apollo Service’s getRunStatus method with a run identifier to determine whether the simulator has completed the run.
The Apollo Service also includes a getRegisteredServices method that returns a list of available Apollo Web Services. An end-user application or other client of the Apollo Service uses the getRegisteredServices method to find services.
A developer of an end-user application connects by “consuming” the WSDL of the Apollo Service. A WSDL, which stands for Web Service Description Language, is an XML format that defines the methods and message syntax of a web service.
The specifics of how the developer of an end-user application consumes a WSDL depend on the programming language in which the application is being developed, but in general the process is easy due to the many tools available that automate the generation of the requisite code for a developer. For example, Java programmers often use the “WSDL2Java” tool (included in both the Apache CXF and Apache Axis java library).
Once the Apollo Service WSDL is consumed, the developer has access within his programming environment to the following Apollo Service methods: getRegisteredServices, runSimulation, runVisualization, and getRunStatus; and to the following Apollo Service data types: the configuration object and all its related classes.
Developing a Simulator Service
To make it easier for developers of epidemic simulators to create Simulator Services, we offer skeleton implementations of a Simulator Service in Python and Java. Using the Python implementation as an example, the simulator developer would download the Simulator Service skeleton and then complete the method stubs in SimulatorService.py for “soap_run” and “soap_getRunStatus”
Additionally, the simulator developer must modify her epidemic simulator to write results to the Apollo results database and register her simulator with Apollo.
At this point, we have described the components of the Apollo Web Services that a developer of a simulator needs to know about when developing a Simulator Service for his or her simulator. We next describe how an end-user application queries the results database.
Results Retrieval and Visualization
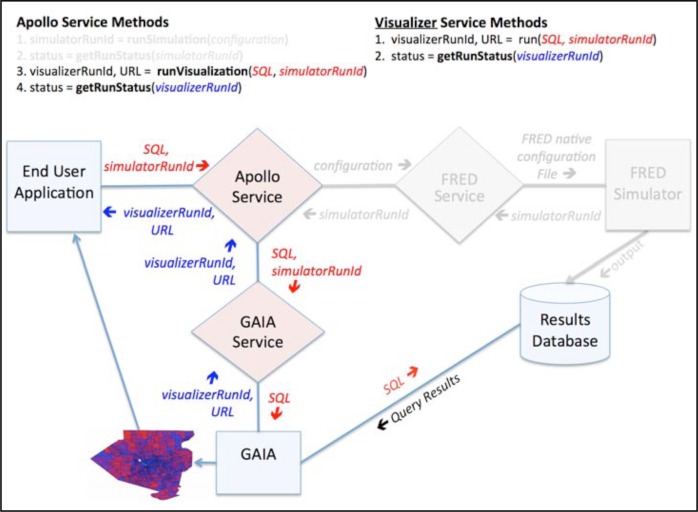
At present, the Apollo Web Services support results retrieval with a third service type, called the Visualizer Service. Visualizer Services create graphs and maps that displays simulator results. Figure 5 shows a Visualizer Service for the GAIA visualizer. GAIA is a program that takes as input the results of a simulation in text file form and outputs maps and movies of maps.
Figure 5.
The Apollo Service and a Visualizer Service for the GAIA visualizer, which generates maps and videos of disease spread
When using a Visualizer Service, an end-user application invokes the Apollo Service’s runVisualizer method with an SQL query and a simulator run ID. In our current implementation, the visualizer (e.g., GAIA) obtains the result data by directly querying the results database. The Visualizer Service then returns a visualization run ID and a URL where the visualizer will write its output (a video, for example).
Just like when running a simulator, the end-user application uses the getRunStatus method to poll the Apollo Service to determine when the visualization is complete. When the job is completed, the end-user application downloads the visualization from the URL.
The fourth type of service is the Synthetic Population service. A synthetic population is a set of synthetic individuals for use in an agent-based simulator. A Synthetic Population service retrieves a set of synthetic individuals for a given location who, in the aggregate, match key geographic and sociodemographic stratifications of the actual population such as age, gender, home, school and work locations.
Results
Apollo-SV
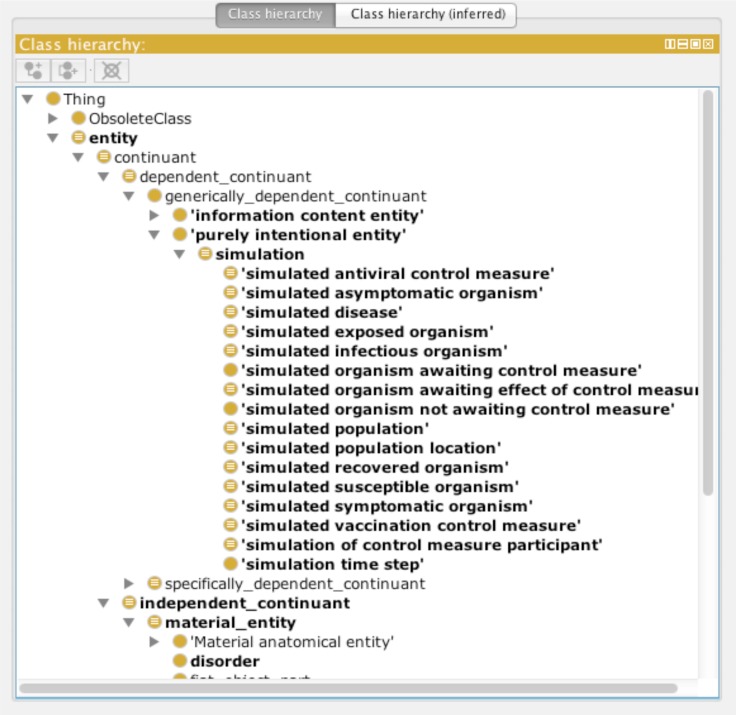
We released version 1.0 of Apollo-SV in January 2013. It has undergone minor updates and corrections since then. The latest version is always available at: http://purl.obolibrary.org/obo/apollo_sv.owl. Apollo-SV includes enough classes for standardizing epidemic model configuration files and for use in the output database schema to enable calling the FRED influenza model at the Pittsburgh Supercomputing Center and an influenza SEIR model developed at the University of Pittsburgh. Figure 6 is a screen snap of the Protégé program displaying the information in the OWL file. Apollo-SV currently contains 398 classes defined using 1,256 logical axioms.
Figure 6.
Apollo-SV displayed in Protégé
Apollo Web Services
We have created Java reference implementations of all four service types. We have also implemented the FRED Simulator service and the GAIA Visualizer Service in the Python programming language.
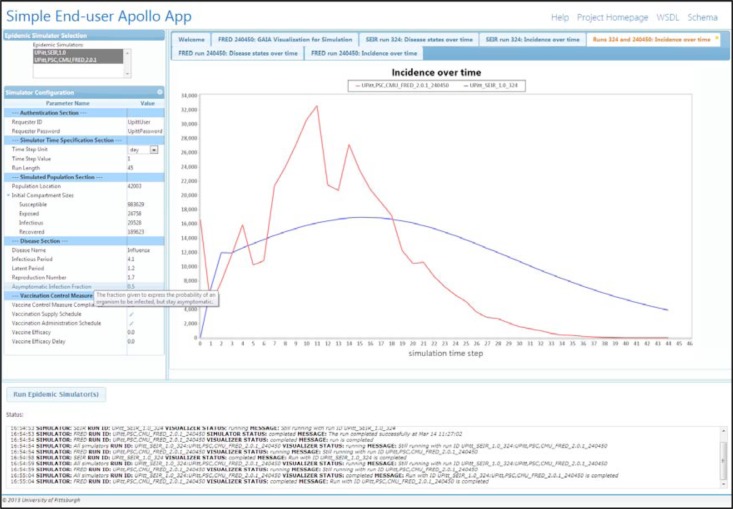
Figure 7 shows a simple, web-based, end-user application (SEUA) that we created to demonstrate the functionality of the Apollo Web Services. The SEUA uses V1.1 of the Apollo Web Services, XML configuration and database-output schemas.
Figure 7.
A simple end-user application using the Apollo Web Services to run the same simulation on two epidemic simulators. The user, having hovered the mouse over the term “Asymptomatic Infection Fraction,” sees a definition of the term obtained directly from the Apollo-SV OWL file. The status area at bottom left reports the progress of simulators and other components. The incidence plot (right) was created by the Time-Series Visualizer service, an implementation of a Visualizer Service.
The SEUA allows an end user to configure, run, and retrieve results from two simulators—an S.E.I.R. compartmental simulator running at the University of Pittsburgh and the FRED agent-based simulator running at the Pittsburgh Supercomputing Center. A user can run one or both simulators with the same simulator configuration information.
The simulator configuration panel on the left allows an end user to specify the time granularity and run length of the simulation(s); the INCITS location code of the simulated population; the numbers of susceptible, exposed, infectious, and recovered individuals at time zero of the simulation; the disease; and the disease’s transmission characteristics—infectious period, latent period, and basic reproduction number; and optionally a specification of a vaccination program intended to control the disease.
The results panel on the right displays visualizer results in tabs for each model run as well as comparative plots such as the plot shown of the incidence curves produced by the two simulators.
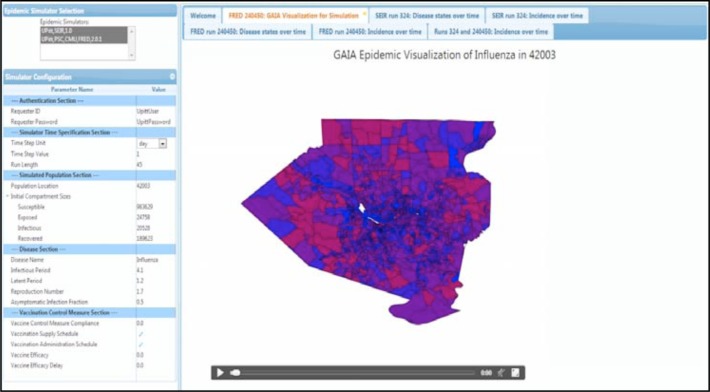
Figure 8 shows a visualization produced by the GAIA visualizer of the temporal and spatial progression of the simulated influenza outbreak in Allegheny County, PA.
Figure 8.
The simple end-user application using the Apollo Web Services to obtain a visualization of the results of a simulation. The GAIA Visualizer, an implementation of a Visualizer Service, created the video.
Discussion
The Apollo project is developing and trying to diffuse into practice two innovations: (1) A standard language—both vocabulary and syntax—for representing analytic problems in the fields of epidemic prediction and control, which will enhance communication among scientists, public health professionals, programmers, and computers; and (2) a set of well-defined programming interfaces for epidemic simulators, end-user applications, and related software systems, which—when coupled with the standard language—will facilitate interoperability among those systems.
Besides its practical use in the Apollo Web Services, the development of Apollo-SV is also advancing the science of ontology. Because a simulation of an epidemic is not a type of epidemic, it would be a mistake to assert an “is a” relationship between simulated epidemic and epidemic. To account for the fictional nature of simulations, we developed a theory of simulation based on Roman Ingarden’s work in the early 20th Century on purely intentional entities. The result is that we can talk about simulations of epidemics without the computer mistakenly inferring that the output data are about a real epidemic, while still allowing the simulators to presume the existence of entities like individuals infected with H1N1 influenza.
Our work with the Apollo Web Services, which provides both syntax and a set of well-defined APIs, has yielded several insights about the challenges of standardizing the inputs and outputs of epidemic simulators. First, the agent-based simulators that we have analyzed do not expose all of their potentially configurable elements in their configuration files and they vary on which elements that they do expose. For example, when we began working with the FRED simulator, the native configuration file did not allow an end user to set the number of infectious or recovered individuals at time zero of the simulation. We believe that the solution to this mismatch between what Apollo can specify and what the native configuration file can represent will be that the epidemic simulators will expose more of their capabilities and thus be capable of analyzing a broader set of scenarios.
Second, the stratifications supported by simulators in their configuration files may differ in ways that are not simply terminological. For example, the FluTE simulator,8 allows an end-user to specify age ranges of 0–4, 5–18, 19–29, 30–64, and 65+; whereas the FRED configuration file supports a single arbitrary user-specified age range (e.g., 11–26). Agent-based simulators are inherently capable of representing multiple arbitrary age ranges; thus, we expect that the solution will be that the simulators will evolve to be able to take advantage of the increased expressiveness of the standards we are promulgating.
A limitation of our representation of simulator configurations is that we do not use the relationships among Apollo-SV classes defined by the description logic axioms when defining their corresponding XSD types. For example, the XSD SimulatorConfiguration type has six attributes (simulatorIdentification, authentication, simulatorTimeSpecification, populationInitialization, disease, and controlMeasures). At present, these attributes have implicit ‘has-attribute’ relationships to SimulatorConfiguration. It would be desirable for the implicit ‘has-attribute’ relationships to be replaced by more specific relationships defined by the ontology. This limitation in our XSD representation is an open research question that we plan to address. The strength of our representation is that it is sufficiently expressive for the representing simulator configurations, which OWL is not. Additionally, the ontology-based terminology and the set of XSD types constrained by the ontological analysis have improved, in our limited experience, the clarity and accuracy of simulator configurations.
Our future plans for the ontology include adding new classes for (1) additional control measures and (2) entities referenced in additional simulators’ configurations and output. Next steps for the work on purely intentional entities include reconciling it with current ontological representations of plans as information entities.
Our future plans for the Apollo Web Services include the creation a Data Results Service that is similar to the Visualizer Service described in this paper. This service will allow an end-user application to retrieve data from the Results Database—as opposed to visualizations of data. Similar to the Visualizer Service, the Data Results Service will specify an SQL query and the results of that query—the data—will be available in a file located at the return URL.
It is important to develop standards for epidemic simulators at this time. The evolution of epidemic simulators is at a point similar to that of electronic medical records in the 1970s. The number of simulators is small but growing and their capabilities are expanding, in part due to the ongoing work of the MIDAS research network. For the same reason that standard vocabularies and syntax for EMRs in the 1970s would have yielded earlier accrual of benefits to research and practice, we expect that standardization of vocabulary and syntax have the same potential for research and practice in epidemic simulation, and more broadly, population simulation.
Conclusion
The Apollo Web Services and the associated Apollo-SV ontology represent a standards-based approach to finding, configuring, running, and querying the results of epidemic simulators. Our results thus far in applying the approach to access two epidemic simulators support their use for additional simulators.
There is additional information about this open source project at http://code.google.com/p/apollo/
Acknowledgments
This work was funded by award R01GM101151 from the National Institute for General Medical Sciences (NIGMS) and award UL1TR000039 from the National Center for Advancing Translational Sciences (NCATS). This paper does not represent the views of NIGMS or NCATS.
References
- 1.Lee BY, Brown ST, Korch GW, Cooley PC, Zimmerman RK, Wheaton WD, et al. A computer simulation of vaccine prioritization, allocation, and rationing during the 2009 H1N1 influenza pandemic. Vaccine. 2010 Jul 12;28(31):4875–9. doi: 10.1016/j.vaccine.2010.05.002. [DOI] [PMC free article] [PubMed] [Google Scholar]
- 2.Lee BY, Brown ST, Cooley P, Grefenstette JJ, Zimmerman RK, Zimmer SM, et al. Vaccination deep into a pandemic wave potential mechanisms for a “third wave” and the impact of vaccination. Am J Prev Med. 2010 Nov;39(5):e21–9. doi: 10.1016/j.amepre.2010.07.014. [DOI] [PMC free article] [PubMed] [Google Scholar]
- 3.Brown ST, Tai JH, Bailey RR, Cooley PC, Wheaton WD, Potter MA, et al. Would school closure for the 2009 H1N1 influenza epidemic have been worth the cost?: a computational simulation of Pennsylvania. BMC Public Health. 2011 May 20;11(1):353. doi: 10.1186/1471-2458-11-353. [DOI] [PMC free article] [PubMed] [Google Scholar]
- 4.Lee BY, Brown ST, Cooley P, Potter MA, Wheaton WD, Voorhees RE, et al. Simulating school closure strategies to mitigate an influenza epidemic. J Public Health Manag Pract. 2010 May-Jun;16(3):252–61. doi: 10.1097/PHH.0b013e3181ce594e. [DOI] [PMC free article] [PubMed] [Google Scholar]
- 5.Chao DL, Matrajt L, Basta NE, Sugimoto JD, Dean B, Bagwell DA, et al. Planning for the control of pandemic influenza A (H1N1) in Los Angeles County and the United States. Am J Epidemiol. 2011 May 15;173(10):1121–30. doi: 10.1093/aje/kwq497. [DOI] [PMC free article] [PubMed] [Google Scholar]
- 6.Lee BY, Wiringa AE. The 2009 H1N1 influenza pandemic: A case study of how modeling can assist all stages of vaccine decision-making. Hum Vaccin. 2011 Jan 1;7(1):115–9. doi: 10.4161/hv.7.1.13740. [DOI] [PMC free article] [PubMed] [Google Scholar]
- 7.Hanna J, Chen C, Crow W, Hall R, Liu J, Pendurthi T, et al., editors. Simplifying MIREOT: A MIREOT Protégé Plugin. International Semantic Web Conference; Boston, MA. 2012. [Google Scholar]
- 8.Chao DL, Halloran ME, Obenchain VJ, Longini IM., Jr FluTE, a publicly available stochastic influenza epidemic simulation model. PLoS computational biology. 2010 Jan;6(1):e1000656. doi: 10.1371/journal.pcbi.1000656. [Research Support, N.I.H., Extramural Research Support, Non-U.S. Gov’t] [DOI] [PMC free article] [PubMed] [Google Scholar]


