

Abstract
The goal of computer tailored health communications (CTHC) is to promote healthy behaviors by sending messages tailored to individual patients. Current CTHC systems collect baseline patient “profiles” and then use expert-written, rule-based systems to target messages to subsets of patients. Our main interest in this work is the study of collaborative filtering-based CTHC systems that can learn to tailor future message selections to individual patients based explicit feedback about past message selections. This paper reports the results of a study designed to collect explicit feedback (ratings) regarding four aspects of messages from 100 subjects in the smoking cessation support domain. Our results show that most users have positive opinions of most messages and that the ratings for all four aspects of the messages are highly correlated with each other. Finally, we conduct a range of rating prediction experiments comparing several different model variations. Our results show that predicting future ratings based on each user’s past ratings contributes the most to predictive accuracy.
Introduction
The term recommender system applies generally to any computer-based system that produces recommendations for items that individual users may like or find useful. Recommender systems encompass a variety of distinct paradigms including content-based information retrieval and collaborative filtering. The term collaborative filtering applies generally to a recommender system that makes predictions and recommendations on the basis of feedback information collected from a community of users with respect to a collection of items. Collaborative filtering itself includes two distinct paradigms: the explicit feedback paradigm and the implicit feedback paradigm. Both forms of collaborative filtering are widely used to provide personalized content on websites like Netflix.com and Amazon.com.
The long-term goal of this research is the development of a collaborative filtering-based computer tailored health communications (CTHC) system. The goal of CTHC-based interventions is to promote healthy behaviors by sending messages tailored to individual patients. Our work focuses on the important domain of smoking cessation support. Current CTHC systems collect baseline patient “profiles” and then use expert-written, rule-based systems to target messages to subsets of patients. These market segmentation-like interventions show some promise in helping certain patients reach lifestyle goals. However, rule-based systems may not account for socio-cultural concepts that have intrinsic importance to the targeted population, thus limiting their relevance. The main thesis of our work is that these issues can be largely overcome by building collaborative filtering-based CTHC systems that solicit user feedback about messages and use this feedback to guide the selection of future messages. Unlike expert systems, collaborative filtering systems estimate models of user sentiment from data using algorithms from machine learning and computational statistics. They have the ability to adapt to multiple sub-populations of patients over time and generally improve in performance as more data becomes available.
In this paper, we report the results of an initial study assessing multiple aspects of subject sentiment with respect to smoking cessation support messages. The study involved 100 subjects and a collection of 50 messages currently in use on our smoking cessation support website, decide2quit.org. We follow the explicit-rating paradigm and requested that subjects assess messages by providing ratings on a five-point scale. Traditional applications of collaborative filtering are designed to identify items that a user might like or find useful, so users typically provide preference ratings for items. In the case of CTHC, the goal is to induce health behavior changes and it is not immediately obvious what type of feedback about messages would have the most utility with respect to this goal. Therefore, in this study, we asked each subject to provide ratings of four different aspects of messages: influence, emotional response, relevance and preference. Each subject provided ratings for five different randomly selected messages.
Our results show that most users have positive opinions of most messages and that the ratings for all four aspects of messages are highly correlated with each other. Finally, we conduct a range of rating prediction experiments comparing several different model variations. Our results show that predicting future ratings based on each user’s past ratings contributes the most to predictive accuracy.
Background
The delivery of general health communication materials (brochures, pamphlets) has limited effect, as the communication may contain information that is not applicable to an individual’s psychological state, behavior, or situation.16 The Elaboration Likelihood Model (ELM) suggests that behavioral change is a result of personalization.8 In CTHC, messages are targeted to patient characteristics.18 CTHC systems use theory-driven, expert-written rules 16, 26 to provide different messages to subsets of patients. This market segmentation removes superfluous material, hopefully providing more relevant information. CTHC systems have been marginally effective in triggering behavior changes across health domains.28, 5, 4, 17, 20 For example, in a review of ten published trials of CTHC for smoking cessation, six showed significantly higher cessation rates than comparison groups.27 Our research into enhancing tailored health communication is motivated by the highly significant public health challenge of smoking cessation. Smoking is the number one preventable cause of premature death in the United States,7 and estimated medical costs of treating smokers are more than US 96 billion a year.9 Novel patient-centered methods to support an individual’s decision to quit smoking are thus greatly needed.6
The current framework for developing health communication interventions is driven by health behavioral experts. It begins by identifying intervention objectives based on constructs in behavioral theories.14 However, this top-down expert-driven approach may neglect concepts that have intrinsic importance to the targeted population.1 The theory-to-context disconnect is especially true for minority patients, who have unique socio-cultural dimensions such as interconnectedness, health socialization, and health care system factors that influence their personal perspectives.1 Community-level input is critical for the development of interactive health communication interventions.12 Even with community input, using theory to generate complex rules may fail to create relevance. Systems limited to theoretical assumptions for market segmentation cannot automatically adapt to their users,29 and may become less effective over time. These systems ignore the potential to collect large amounts of empirical data from thousands of users of CHTC systems.
Outside of the healthcare domain, Google, Amazon, Netflix, Yahoo and others increasingly rely on user preferences to deliver personalized content and services. Such systems have the capacity to combine behavior, perspectives and preferences from a group of people to generate novel insights about specific individuals.25 For example, Netflix combines the community’s past preferences with those of a specific user to recommend new movies the user might like. Amazon combines the community’s purchase history with the current product a user is viewing to recommend other products the user might be interested in. This personalization is provided by statistical models and algorithms collectively known as recommender systems.
Recommender systems are computer programs that produce recommendations for items that individual users may like or find useful.21 Recommender systems encompass a variety of distinct frameworks including content-based information retrieval 2 and collaborative filtering.10 While both frameworks can be applied to tailor health communications, they each have weaknesses when applied individually. Selecting messages based on patient profiles and characteristics of health communication messages is a special case of a content-based information retrieval problem.2 However, when the patients and messages are naturally described using different sets of features (e.g., profile information vs. words of a message), standard information retrieval methods developed for familiar domains like web search 23 cannot be directly applied. This has led to the use of rule-based CTHC systems with essentially no ability to adapt to user feedback, as described above. Selecting messages based on feedback about their motivational potential is a collaborative filtering problem.10 Collaborative filtering systems leverage the combined feedback of a large community of users with respect to a collection of items to make personalized recommendations to individual users.10 Collaborative filtering systems can make recommendations on the basis of implicit or explicit feedback. Implicit feedback consists of observations of user actions, while explicit feedback typically consists of numerical ratings for items.11 For example, Amazon is an implicit feedback system that uses purchase history and product views to recommend new products,19 while Netflix is an explicit feedback system that uses movie ratings to recommend new movies.3 Collaborative filtering systems do not require information about the users or the items to be recommended apart from the feedback indicators. However, when content information about users and items is available, pure collaborative filtering systems are unable to take advantage of it, often leading to lower quality recommendations. Because of the above limitations in both of the recommender systems approaches, moving the field of health communication forward will likely require going beyond the simple application of either approach. Our goal is to understand what types of explicit feedback may be useful in the context of tailored health communications and how to best integrate the feedback with content information.
Methods
In this section we describe the data collection, rating data analysis, predictive models and model estimation methodology that underlie this study.
Data Collection:
We collected feedback on smoking cessation support messages from 100 subjects using an online survey. Each subject provided ratings for five unique messages drawn randomly from a pool of 50 messages. This 50 message pool was in turn drawn from those in active use on our smoking cessation support portal decide2quit.org. Subjects were asked to assess the messages they were shown by responding to four different questions. The answer to each question was provided on a five-point scale where 1 indicated “strongly agree” and 5 indicated “strongly disagree.” Note that this is the opposite of the five-point scale used in the majority of recommender systems research where 5 typically indicates the highest preference level, while 1 indicates the lowest preference level. Each question measured a different aspect of a subject’s response to a message including perceived influence, emotional response, relevance and preference. The four specific questions used to solicit the ratings are listed below. The order that the questions were presented was varied from subject to subject.
Question 1: This message influences me to quit smoking?
Question 2: This message affected me emotionally?
Question 3: This message was relevant to my everyday life?
Question 4: I would like more messages like this one?
Rating Data Analysis:
We analyze several different facets of the ratings collected for this study. First, we compute the marginal rating distribution for each question. For each question, this is simply the proportion of each of the five rating values collected from all subjects responses to all messages. Note that a small number of subjects did not supply ratings for all messages. We compute the distribution over the supplied ratings. We then compute the joint distribution over rating values for each pair of questions to assess the degree to which subjects assign different ratings to the same message when prompted by different questions. For each question, we also investigate the relationship between the average rating and the variance of the ratings for each message.
Rating Data Modeling:
Our predictive analysis is based on the use of a model that incorporates global, user-specific and message-specific bias terms; user and message-based feature terms; and matrix factorization terms when predicting a given rating rum.24 The full model for user u and message m is shown in Equation 1. We also consider the performance of multiple sub-models of the full model, each containing a different sub-set of these terms included in Equation 1. We describe each of the terms in detail below and discuss how to learn the parameters of the model in the next section.
| (1) |
Bias Terms: The first term in Equation 1,BG, is a global bias term. This captures the overall deviation from zero of the ratings. The second term, , is a user specific bias. Some users may generally rate messages higher or lower regardless of what the message is. This deviation is captured in the user bias. The third term, , is a message specific bias. Some messages may be universally liked or disliked. The message bias captures the overall popularity of a message. These bias terms are a critical part of modern recommender systems and can account for a high proportion of the system’s performance.13
User and Message Feature Terms: The third and fourth terms in Equation 1 model the correlations between rating values and various user and message features. A variety of side information is known both about users and messages. The user side information we use includes features such as age, gender, race, education level, and information about smoking behavior and readiness to quit. The message features include the message source (expert or community provided), features indicating the intended target group of the message with respect to readiness to quit, and features derived directly from the text of the messages. The model assumes a linear relationship between these features and the rating values. The user and message feature values are denoted as and , respectively. The corresponding user and message feature parameter are denoted by and . DU and DM indicate the dimensionality of the user and message feature vectors.
Matrix Factorization Terms: The final term in Equation 1 represents a rank-K factorization. This portion of the model allows us to capture structure in the ratings matrix that cannot be accounted for by the observed features or the bias terms. A matrix factorization model takes a partially observed matrix and approximates it as the product of two lower dimensional matrices with a specified rank K. In our case, these factors are denoted WU and WM. The reduction in dimensionality forces the model to extract the statistical regularities in the data, which can be used to make predictions. For simplicity, Figure 1 shows an illustration of this approximation when used in isolation (no bias or feature terms). In this case, an individual entry, rum, is modeled as the dot product of user u’s row in WU and message m’s column in WM, as shown in Equation 1. One interpretation of these matrices is that represents an unobserved attribute of message m and represents user u’s preference for that attribute.15 In this way, if message m has a high value for attribute k and user u has a high preference for attribute k, the model will predict a high rating value.
Figure 1:
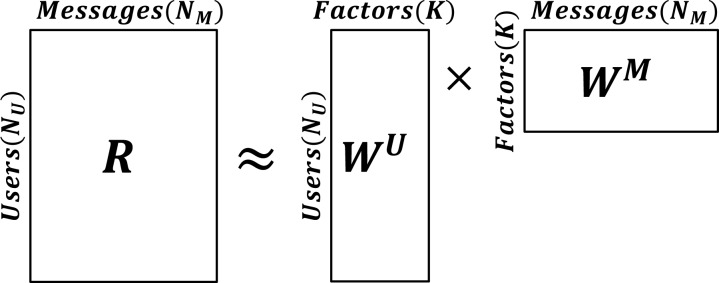
Illustration of the matrix factorization model.
Model Estimation:
The parameters of the above model are BG, BU, BM, VU, VM, WU, and WM. We estimate these parameters from the observed data using a regularized least squares criterion. In a standard least squares method, the model parameters are chosen to minimize the sum of squared differences between the predicted and true output values. When working with limited amounts of data, this method alone can lead to over-fitting. This over-fitting can be mitigated by including an ℓ2 penalty term, which penalizes the squared ℓ2 norm of the parameters, preventing them from becoming overly large in magnitude. We apply this penalization to all model parameters except the global bias term BG since this term is a single scalar value. The optimal parameter estimates under this criterion are not available in closed form for the model presented in Equation 1. They are instead obtained using numerical optimization. We use the limited memory BFGS method for numerical optimization 22. The objective function is given in Equation 2 where we sum over all user-message pairs (u, m) in the observed data 𝒟. The parameter λ is a penalization hyper-parameter that controls the strength of the penalty terms. We discuss how to choose λ in the next section.
| (2) |
Hyper-Parameter Selection and Prediction Accuracy:
Due to the limited amount of data available in our pre-pilot study, we test predictive performance using a triple cross validation procedure. In this procedure, making a prediction for the individual rating rum for user u and message m requires three steps and three partitions of the data. First, we take the observed ratings from all other users, call this set 𝒟−u, and use a five-fold cross validation to set the penalization parameter λ. This involves splitting 𝒟−u into five equal folds, calculating the validation set error for each fold from a model estimated using the remaining four folds, and choosing the penalization parameter value that has the lowest mean absolute error across all five folds. Second, we re-estimate the model parameters that do not involve user u using all ratings in 𝒟−u and the tuned value for λ. Finally, we estimate the parameters that involve user u using all of user u’s ratings except for rum. We use this collection of model parameters to predict rum using Equation 1. This is done for each rating in our data set. The accuracy of the predicted ratings is again evaluated using the mean absolute error between the predictions and the actual observed ratings. We use the average absolute error as our error measure throughout the next section.
Results
In this section, we report the results of our study including the rating data analysis and predictive analysis.
Marginal Rating Distributions:
The individual rating distributions for each question are shown in Figure 2. Any requested rating values that were not entered by the subjects were discarded and results are based on the obtained responses. Each of the four questions shows a similar distribution of responses. We can see that greater than 50% of the probability mass is associated with “strongly agree” or “agree” for each of the four message aspects, indicating generally positive assessments. The next question of interest, which we discuss below, is the degree to which ratings are correlated across question types.
Figure 2:
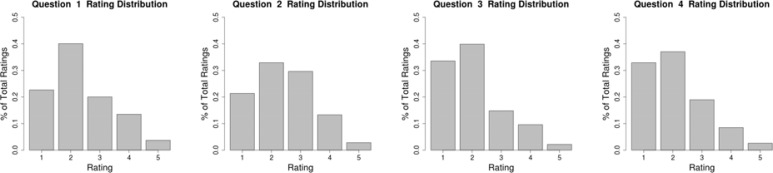
Rating distributions for each question.
Joint Rating Distributions:
In order to evaluate the relationships between questions, joint distributions for each question pair were calculated. Any subjects that did not supply ratings for all questions were removed from this analysis. The joint distributions are shown as heat-maps in Figure 3. The high values along the diagonals of each plot show that there is relatively high correlation between the responses to different questions. This indicates that there may be limited utility in having users assess all four message aspects in the future.
Figure 3:

Joint histograms (as heat-maps) for combinations of questions. Location (i, j) in the plot for questions q and p shows the proportion of times any user rated a message i on question q and j on question p.
Per-Message Mean Rating and Rating Variance Analysis:
Figure 4 shows the average rating for each message versus the rating variance for that message (plotted for each question). Any requested rating values that were not entered by the subjects were discarded and results are based on the obtained responses, resulting in different numbers of observations per message. This is shown in Figure 4 by the opacity of the points. These plots show an important trend. While there are some messages that all subjects thought positively of, we can see that messages with higher mean ratings (more negative assessments) also tend to have higher variance. It may thus be possible to provide effective personalization by selecting messages that users will have positive opinions of from among the medium-to-high variance messages. In order to accomplish this selection, we need to be able to rank unobserved messages effectively. A common approach to ranking is to predict rating values for each item a user has not yet rated, and then rank the messages according to their predicted ratings. Accurate ranking thus relies on accurate rating prediction. In the next section, we assess the rating prediction accuracy of the model introduced in Equation 1.
Figure 4:
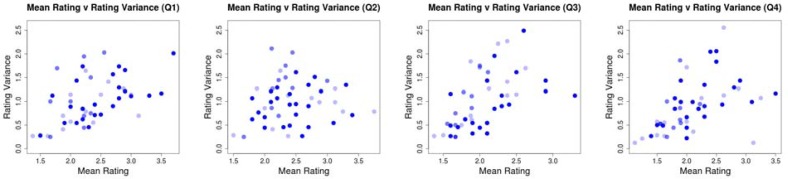
Scatter plots showing the mean rating for a message against the rating variance for that message. Each plot shows the means and variances calculated for a different question. The opacity of the points is scaled by the number of observed ratings for that message. In this case, the maximum number of ratings observed for a message was 10 and the minimum was 8.
Rating Prediction Accuracy:
Finally, we report the results of our predictive analysis. The model we described in the previous section incorporates global, user and message bias terms, user and message feature terms, and matrix factorization terms. We experiment with all combinations of models that use either the user and message bias terms or the user and message feature terms. We apply each of the models to each of the four questions. The results we report are averaged over all ratings in the data set, as described in detail in the previous section. We give the results in Table 1. Each row corresponds to a model that includes different terms. BG indicates the global bias term, which is included in all models. BU and BM indicate user and message bias terms. FU and FM indicate user and message feature terms. Due to the relatively small amount of data, we only consider a K = 1 matrix factorization model. The inclusion of the matrix factorization component is denoted by MF.
Table 1:
Each row shows the average absolute error for a different combination of model components. BG signifies the overall bias, BU and BM signify the user and message biases. FU and FM indicate the user and message features. M F indicates the matrix factorization model with K = 1.
| Model | Question 1 | Question 2 | Question 3 | Question 4 |
|---|---|---|---|---|
| BG | 0.887 ± 0.029 | 0.902 ± 0.029 | 0.773 ± 0.030 | 0.892 ± 0.028 |
| BG, FU | 0.902 ± 0.031 | 0.928 ± 0.030 | 0.855 ± 0.032 | 0.930 ± 0.031 |
| BG, FM | 0.884 ± 0.029 | 0.890 ± 0.029 | 0.770 ± 0.029 | 0.878 ± 0.028 |
| BG, BU | 0.729 ± 0.029 | 0.750 ± 0.029 | 0.723 ± 0.029 | 0.736 ± 0.030 |
| BG, BM | 0.870 ± 0.029 | 0.855 ± 0.030 | 0.794 ± 0.028 | 0.822 ± 0.031 |
| BG, M F | 0.798 ± 0.031 | 0.800 ± 0.029 | 0.792 ± 0.030 | 0.841 ± 0.032 |
| BG, FU, FM | 0.906 ± 0.030 | 0.925 ± 0.030 | 0.860 ± 0.033 | 0.924 ± 0.032 |
| BG, BU, BM | 0.714 ± 0.028 | 0.734 ± 0.028 | 0.715 ± 0.027 | 0.731 ± 0.028 |
| BG, FU, M F | 0.794 ± 0.031 | 0.805 ± 0.028 | 0.865 ± 0.032 | 0.930 ± 0.034 |
| BG, FM, M F | 0.792 ± 0.030 | 0.776 ± 0.028 | 0.774 ± 0.028 | 0.847 ± 0.031 |
| BG, BU, M F | 0.775 ± 0.031 | 0.759 ± 0.028 | 0.724 ± 0.027 | 0.724 ± 0.029 |
| BG, BM, MF | 0.775 ± 0.028 | 0.754 ± 0.028 | 0.766 ± 0.028 | 0.800 ± 0.030 |
| BG, FU, FM, M F | 0.810 ± 0.031 | 0.816 ± 0.031 | 0.870 ± 0.039 | 0.898 ± 0.033 |
| BG, BU, BM, M F | 0.750 ± 0.029 | 0.732 ± 0.027 | 0.697 ± 0.027 | 0.720 ± 0.028 |
The results for all questions show that the user bias terms BU contribute the most to prediction accuracy over all questions. However, the model with the minimum error for each question includes additional terms. For Question 1, the optimal model uses the global, user and message bias terms. For the remaining questions, the optimal model uses these terms as well as the matrix factorization terms. We can also see that models including the user and message feature terms FU and FM perform much more poorly than models that include the bias terms. This indicates that incorporating the features using linear models is not effective. The results might be improved by using feature selection to include only those features that are most correlated with the observed ratings or by incorporating the features using different model structures.
Conclusions and Future Directions
In this paper, we report the results of an initial study assessing four aspects of subject sentiment with respect to smoking cessation support messages: influence, emotional impact, relevance and preference. Our results show that most users have positive opinions of most messages. Per-message analysis revealed the existence of a positive correlation between the means and variances of the ratings for each question. This indicates that it may be possible to provide effective personalization by selecting messages that users will have positive opinions of from the medium-to-high variance messages. Finally, we have conducted a range of rating prediction experiments comparing different model variations. Our results show that the user bias terms contribute the most to predictive accuracy, but the optimal models for different questions used additional terms including message bias terms and matrix factorization terms. This initial evaluation represents the first step toward our long term goal of developing a collaborative filtering-based computer tailored health communications system. The next step of our research is to conduct a much more extensive rating collection phase where we will gather data on 20 messages per subject for over 500 subjects. This will provide much more data to explore the application of more complex models.
REFERENCES
- 1.Ashing-Giwa K. Health behavior change models and their socio-cultural relevance for breast cancer screening in african american women. Women Health. 1999;28(4):53–71. doi: 10.1300/J013v28n04_04. [DOI] [PubMed] [Google Scholar]
- 2.Belkin Nicholas J, Bruce Croft W. Information filtering and information retrieval: two sides of the same coin? Commun ACM. 1992;35(12):29–38. [Google Scholar]
- 3.Bennett J, Lanning S. The netflix prize. KDD Cup and Workshop. 2007;2007:35. [Google Scholar]
- 4.Bull FC, Kreuter MW, Scharff DP. Effects of tailored, personalized and general health messages on physical activity. Patient Educ Couns. 1999;36(2):181–92. doi: 10.1016/s0738-3991(98)00134-7. [DOI] [PubMed] [Google Scholar]
- 5.Campbell MK, DeVellis BM, Strecher VJ, Ammerman AS, DeVellis RF, Sandler RS. Improving dietary behavior: the effectiveness of tailored messages in primary care settings. Am J Public Health. 1994;84(5):783–7. doi: 10.2105/ajph.84.5.783. [DOI] [PMC free article] [PubMed] [Google Scholar]
- 6.Chaiton MO, Cohen JE, Frank J. Population health and the hardcore smoker: Geoffrey rose revisited. J Public Health Policy. 2008;29(3):307–18. doi: 10.1057/jphp.2008.14. [DOI] [PubMed] [Google Scholar]
- 7.Fiore CM, Jaen CR, Baker TB. Treating tobacco use and dependence: 2008 update. Technical report, U.S. Department of Health and Human Services. Public Health Service, 2008 2008.
- 8.Flynn BS, Worden JK, Bunn JY, Connolly SW, Dorwaldt AL. Evaluation of smoking prevention television messages based on the elaboration likelihood model. Health Educ Res. 2011 doi: 10.1093/her/cyr082. [DOI] [PMC free article] [PubMed] [Google Scholar]
- 9.Centers for Disease Control, Prevention: National Center for Chronic Disease Prevention, and Health Promotion (NCCDPHP). Tobacco use targeting the nations leading killer at a glance 2011, 2011
- 10.Goldberg David, Nichols David, Oki Brian M, Terry Douglas. Using collaborative filtering to weave an information tapestry. Commun ACM. 1992;35(12):61–70. [Google Scholar]
- 11.Herlocker Jonathan L, Konstan Joseph A, Borchers Al, Riedl John. An algorithmic framework for performing collaborative filtering. 1999. [Google Scholar]
- 12.Kelly CM, Baker EA, Brownson RC, Schootman M. Translating research into practice: using concept mapping to determine locally relevant intervention strategies to increase physical activity. Eval Program Plann. 2007;30(3):282–93. doi: 10.1016/j.evalprogplan.2007.05.007. [DOI] [PubMed] [Google Scholar]
- 13.Koenigstein Noam, Dror Dror, Koren Yehuda. Yahoo! music recommendations: modeling music ratings with temporal dynamics and item taxonomy. Proceedings of the fifth ACM conference on Recommender systems; ACM; 2011. pp. 165–172. [Google Scholar]
- 14.Kok G, Schaalma H, Ruiter RA, van Empelen P, Brug J. Intervention mapping: protocol for applying health psychology theory to prevention programmes. J Health Psychol. 2004;9(1):85–98. doi: 10.1177/1359105304038379. [DOI] [PubMed] [Google Scholar]
- 15.Koren Yehuda, Bell Robert, Volinsky Chris. Matrix factorization techniques for recommender systems. Computer. 2009;42(8):30–37. [Google Scholar]
- 16.Kreuter MW, Farrell DW, Olevitch LR, Brennan LK. Tailoring Health Messages Customizing Communication with Computer Technology. Lawrence Erlbaum Associates, Inc; Mahwah, NJ: 2000. [Google Scholar]
- 17.Kreuter MW, Strecher VJ. Do tailored behavior change messages enhance the effectiveness of health risk appraisal? results from a randomized trial. Health Educ Res. 1996;11(1):97–105. doi: 10.1093/her/11.1.97. [DOI] [PubMed] [Google Scholar]
- 18.Kreuter Matthew. Tailoring health messages : customizing communication with computer technology. L. Erlbaum; Mahwah, N.J.: 2000. LEA’s communication series L. [Google Scholar]
- 19.Linden G, Smith B, York J. Amazon.com recommendations: Item-to-item collaborative filtering. Internet Computing, IEEE. 2003;7(1):76–80. [Google Scholar]
- 20.Marcus BH, Emmons KM, Simkin-Silverman LR, Linnan LA, Taylor ER, Bock BC, Roberts MB, Rossi JS, Abrams DB. Evaluation of motivationally tailored vs. standard self-help physical activity interventions at the workplace. Am J Health Promot. 1998;12(4):246–53. doi: 10.4278/0890-1171-12.4.246. [DOI] [PubMed] [Google Scholar]
- 21.Melville P, Sindhwani V. Recommender Systems. Springer; 2010. [Google Scholar]
- 22.Nocedal Jorge, Wright Stephen J. Numerical Optimization. second edition. Springer; New York: 2006. [Google Scholar]
- 23.Page L, Brin S, Motwani R, Winograd T. The pagerank citation ranking: Bringing order to the web. 1999.
- 24.Salakhutdinov R, Mnih A. Probabilistic matrix factorization. Advances in neural information processing systems. 2008;20:1257–1264. [Google Scholar]
- 25.Segaran Toby. Programming collective intelligence : building smart web 2.0 applications. 1st edition. O’Reilly; Beijing; Sebastapol CA: 2007. [Google Scholar]
- 26.Shiffman S, Paty JA, Rohay JM, Di Marino ME, Gitchell J. The efficacy of computer-tailored smoking cessation material as a supplement to nicotine polacrilex gum therapy. Arch Intern Med. 2000;160(11):1675–81. doi: 10.1001/archinte.160.11.1675. [DOI] [PubMed] [Google Scholar]
- 27.Strecher VJ, McClure JB, Alexander GL, Chakraborty B, Nair VN, Konkel JM, Greene SM, Collins LM, Carlier CC, Wiese CJ, Little RJ, Pomerleau CS, Pomerleau OF. Web-based smoking-cessation programs: results of a randomized trial. Am J Prev Med. 2008;34(5):373–81. doi: 10.1016/j.amepre.2007.12.024. [DOI] [PMC free article] [PubMed] [Google Scholar]
- 28.Strecher VJ. Developing a tool for evaluating the quality of print-based health education materials. 1994. Technical report, U.S. Department of Health and Human Services, Public Health Service, Centers for Disease Control and Prevention.
- 29.Vasarhelyi Miklos A, Bonson Enrique, Hoitash Rani. Artificial intelligence in acccounting and auditing. Vol. 6, International perspectives. Markus Wiener; Princeton, NJ: 2005. [Google Scholar]