

Abstract
Vitamin K plays an essential role in many biological processes including blood clotting, maintenance of bone health, and inhibition of arterial calcification. A menaquinone form of vitamin K, MK4, is increasingly recognized for its key roles in mitochondrial electron transport, as a ligand for the nuclear receptor SXR, which controls expression of genes involved in transport and metabolism of endo- and xenobiotics, and as a pharmacotherapeutic in the treatment of osteoporosis. Although cytochrome P450 (CYP) 4F2 activity is recognized as an important determinant of phylloquinone (K1) metabolism, the enzymes involved in menaquinone catabolism have not been studied previously. CYP4F2 and CYP4F11 were expressed and purified and found to be equally efficient as in vitro catalysts of MK4 ω-hydroxylation. CYP4F2, but not CYP4F11, catalyzed sequential metabolism of MK4 to the ω-acid without apparent release of the intermediate aldehyde. The ω-alcohol could also be metabolized to the acid by microsomal NAD+-dependent alcohol and aldehyde dehydrogenases. LC-MS/MS analysis of trypsinized human liver microsomes (using surrogate peptide approach) revealed mean concentrations of CYP4F2 and CYP4F11 to be 14.3 and 8.4 pmol/mg protein, respectively. Microsomal MK4 ω-hydroxylation activities correlated with the CYP4F2 V433M genotype but not CYP4F11 D446N genotype. Collectively, these data expand the lexicon of vitamin K ω-hydroxylases to include the ‘orphan’ P450 CYP4F11 and identify a common variant, CYP4F2 (rs2108622), as a major pharmacogenetic variable influencing MK4 catabolism.
Introduction
Vitamin K is a collective term for a series of naphthoquinone derivatives with important biological activities. Vitamin K1, also known as phylloquinone (PK), and menaquinone-4 (MK4), a form of vitamin K2, have 20-carbon phytyl chains that differ only in their degree of unsaturation. Other menaquinones (MK5 – MK13) have longer unsaturated phytyl chains, and menadione (MN), also referred to as vitamin K3, possesses no phytyl side-chain (Fig. 1). PK is biosynthesized by plants, and humans acquire it by eating green vegetables. MK4 is biosynthesized in humans from either PK or MN.1–3 MK4 can also be acquired from eating animal products such as meat and liver. Longer-chain menaquinones are synthesized by bacteria in the human intestinal flora and by bacteria in fermented foods such as cheese and fermented soybeans.4, 5
FIGURE 1.
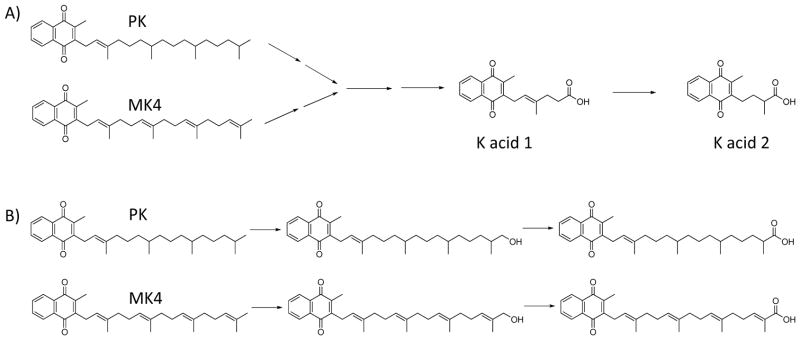
A, The elimination pathway of phylloquinone (PK) and menaquinone-4 (MK4). The major urinary metabolites are the β-oxidized, chain-shortened glucuronides of K acid 1 and K acid 2. B, Both PK and MK4 must undergo an initial ω-hydroxylation step before β-oxidation can commence.
MK4 is currently approved for prevention and treatment of osteoporosis for women in Japan at a dose of 45 mg/day. PK is routinely dosed to newborns at birth in the United States to prevent vitamin K deficiency bleeding. It is also used to rescue patients during warfarin overdose bleeding events. VK supplementation is being investigated for prevention or treatment of vascular calcification6 relating to cardiovascular disease and chronic kidney disease as well as for warfarin dose stabilization therapy.7
Given the plethora of biological functions now attributed to vitamin K and the increased interest in its use as a therapeutic agent,8 it is important to understand how the body regulates tissue concentrations of the various vitamin K vitamers. Metabolic processes can be expected to play an important role in vitamin K homeostasis, but surprisingly little is known about the enzymes that control catabolism of K vitamers. It has been established that the major urinary metabolites of PK and MK4 are K acid 1 and K acid 2 (Fig. 1A). This catabolic pathway presumably involves an initial ω-hydroxylation event followed by two additional oxidations to generate aldehyde and carboxylic acid products (Fig. 1B). The carboxylic acids can then be esterified to their CoA derivatives and transferred from the endoplasmic reticulum to either the mitochondria or peroxisomes for β-oxidation to the chain shortened metabolites that have been found in the urine as glucuronide conjugates. Analogous pathways exist for the structurally similar compounds, vitamin E and coenzyme Q.9–11
Previously, we reported that CYP4F2 can catalyze side chain oxidation of phylloquinone,12 although the absence of an authentic chemical standard precluded unambiguous assignment of the metabolite as the ω-hydroxy phylloquinone. Here, we demonstrate unequivocally that CYP4F2 is an ω-hydroxylase of MK4, characterize formyl and carboxylic acid metabolites that results from further oxidation of the primary metabolic product, establish an ‘orphan’ P450, CYP4F11, as a new vitamin K ω-hydroxylase and quantitate CYP4F2 and CYP4F11 in human liver microsomes by LC-MS/MS in order to scale the relative contributions of these two P450 enzymes to initiation of vitamin K catabolism.
Experimental Procedures
Materials
Human liver microsomes (a pool of 50 donors) were obtained from Xenotech LLC (Lenexa, KS). Additional human liver microsomes were prepared from the University of Washington Department of Medicinal Chemistry Human Liver Bank, as described previously.12 13C15N isotopically- labeled peptides were from Pierce Thermo custom peptide services. The C-terminal lysine contained 6 heavy carbon atoms and 2 heavy nitrogen atoms. The peptides were >99% isotopically-enriched, >97% pure, and the concentration precision was ±25%. An in-solution tryptic digestion kit was purchased from Thermo Scientific (Waltham, MA). DLPC (1,2-dilauroyl-sn-glycero-3-phosphocholine) was from Avanti Polar Lipids (Alabaster, AL). Alcohol dehydrogenase (ADH) from equine liver, lapachol, and methyl-β-cyclodextrin (MβCDX) were purchased from Sigma Aldrich (St. Louis, MO). ω-Hydroxy MK4 was synthesized and characterized as described previously.13 CYP4F11 was expressed with a C-terminal histidine tag in Escherichia coli and purified as described previously.14 CYP4F2 was expressed with C-terminal histidine tag in insect cells (using baculovirus) and purified as described previously.15 Supersomes™ preparations of human P450 enzymes expressed in insect cells were obtained from BD Biosciences (San Jose, CA), and rat P450 oxidoreductase and rat cytochrome b5 were expressed in E. coli and purified as previously described.16, 17
Metabolic Reactions with Vitamin K
Supersomes™ or reconstituted P450s were incubated with MK4 or PK in a total volume of 500 μl in an amber Eppendorf microcentrifuge tube. The amount of P450 used was typically 10 or 30 pmol per metabolic incubation. Purified P450 enzymes, P450 oxidoreductase, cytochrome b5, and DLPC were reconstituted at a molar ratio of 1:2:1:160 on ice for 5 min. A stock solution of DLPC was prepared by extrusion into water using a 0.4 μm filter to yield uniformly-sized liposomes. Vitamin K substrate was added in 2-propanol ensuring that the organic concentration did not exceed 0.4% v/v in the final reaction volume. Due to the insolubility of the substrates in buffer, the order of addition of the incubation components was as follows: P450 enzyme preparation, 85 μl 0.1M potassium phosphate buffer, pH 7.4 (KPi), MβCDX (if included; the solubilizing agent was omitted from metabolic incubations designed to measure kinetic constants), substrate. When included, MβCDX, was added to a final concentration of 1 mM. Reactions were preincubated at 37 °C for 3 min, initiated by addition of 1 mM NADPH, and allowed to proceed at 37 °C for 20 min.
Incubations of pooled human liver microsomes (0.25 mg/mL) using ω-hydroxy MK4 as the substrate were performed similarly, using either NAD+ or NADPH to initiate the reaction. Reactions were quenched with 50 μl 2-propanol containing 0.1 μM lapachol (2-hydroxy-3-(3-methylbut-2-enyl)naphthalene-1,4-dione) as internal standard. Metabolic incubations were extracted (2 × 700 μl hexanes) into silanized glass test tubes and spun for 90 s in a tabletop centrifuge. The hexanes layer was removed, evaporated with N2 at room temperature and the residue was dissolved in 100 μl of 2-propanol. Samples were immediately transferred to amber vials and analyzed by LC-MS/MS, typically injecting 4 μl on the column. Standard curves for quantitation of ω-hydroxy MK4 production contained the appropriate amount of human liver microsomal protein, control Supersomes™ (containing P450 oxidoreductase and cytochrome b5 only), DLPC liposomes, and/or MβCDX.
To biosynthesize the ω-formyl MK4 standard, 2 units of equine ADH was added to 450 μl KPi. ω-hydroxy MK4 was added in 2-propanol to a final concentration of 100 μM. The reaction was initiated with 1 mM NAD+ and allowed to proceed at 37 °C for 60 min. The incubation was extracted as described above before analysis by LC-MS/MS.
LC-MS/MS Analysis of Vitamin K Metabolites
The LC system consisted of a triple quadrupole mass spectrometer (SCIEX API4000; Applied Biosystems, Foster City, CA) coupled to a UPLC (Waters, Milford, MA). Analytes were separated on an Acquity UPLC C18 1.7 μm, 50 × 2.0 mm column (Waters) with water (A) and methanol (B) mobile phases. The concentration of B was held at 45% from 0–1.5 minutes, increased and held at 85% (for MK4 analysis) or 90% (for PK analysis) from 1.5–6 minutes, held at 100% from 6–7 min, and decreased and held at 45% again from 7–8.5 min at a flow rate of 0.6 ml/min. At 6.1 min 100% of the flow was diverted to waste. Vitamin K metabolite retention times under these conditions were as follows (min): ω-hydroxy MK4 (4.2), ω-formyl MK4 (4.5), ω-carboxy MK4 (4.1), and lapachol IS (2.0), ω-hydroxy PK (3.6), ω-carboxy PK (3.9). The mass spectrometer was operated in APCI negative ion mode with a heated nebulizer source at the following settings: temperature 450 °C, nebulizer current (NC) 5 V, curtain gas (CUR) 35 psi, ion source gas 1 (GS1) 45 psi, ion source gas 2 (GS2) 45 psi, collision gas (CAD) 7 psi, entrance potential (EP) 10 V, collision cell exit potential (CXP) 15 V. The following multiple reaction monitoring (MRM) mass transitions and instrument settings for incubations containing MK4 and PK were as follows: ω-hydroxy MK4 (460.3>185.0, DP 90 V, CE 42 V), ω-formyl MK4 (458.4>185.0, DP 90 V, CE 40 V), ω-carboxy MK4 (474.4>185.0, DP 90 V, CE 40 V), and lapachol (internal standard) (241.0>186.1, DP 75 V, CE 28 V), ω-hydroxy PK (466.3>185.0, DP 90 V, CE 42 V), ω-carboxy PK (480.4>185.0, DP 90 V, CE 40 V).
Microsomal CYP4F Quantitation by Peptide LC-MS/MS
Peptide based LC-MS/MS quantification of CYP4F2 and CYP4F11 was performed using pure protein as a calibration standard and isotopically labeled peptide as an internal standard. Signature peptides for CYP4F proteins were selected based on in silico criteria.18, 19 Briefly, peptides with transmembrane regions, single nucleotide polymorphisms (SNPs), posttranslational modifications or those susceptible to degradation were not selected. Continuous arginine and lysine sequences (RR, RK, KR and KK) were excluded to avoid the miscleavages. A genome wide BLAST search was performed to select specific peptides for human CYP4F2 and CYP4F11. The P450 digestion protocol was adapted from previously described methods18, 19. Human liver microsomes (40 μl, 2 mg protein/ml) and purified CYP4F enzymes were incubated with 4 μl dithiothreitol (100 mM) and 40 μl ammonium bicarbonate buffer (100 mM, pH 7.8) for 5 min at 95 °C (denaturation and reduction). The samples were cooled to room temperature and alkylated by adding 4 μl iodoacetamide (200 mM) for 20 min at room temperature in the dark. Ten μl trypsin solution was added (0.16 mg/ml) and samples were digested at 37 °C for 24 h. At the end of digestion period, the reaction was quenched by adding 30 μl of stable-isotope labeled (SIL) internal standard solution (50% acetonitrile, 0.1% formic acid, v/v) and centrifuged at 5000 x g for 5 min at 4 °C and stored at −80 °C until analysis. The LC-MS/MS instrument, which consisted of an Agilent 6460A triple-quadrupole mass spectrometer coupled to an Agilent 1290 Infinity LC system (Agilent Technologies, Santa Clara, California), was operated in electrospray ionization positive ion mode. Five μl of sample was injected onto an Acquity UPLC C18 1.7 μm, 50 mm × 2.0 mm column (Waters). The mobile phases were 0.1% formic acid (v/v) in water (A) and acetonitrile (B), and the flow rate was 0.4 ml/min. The mobile phase gradient was as follows: 0–2.5 min (hold 3% B, v/v), 2.5–5 min (3–12% B, v/v), 5–11 min (hold 12% B, v/v), 11–13.9 min (12–28% B, v/v), 13.9–14 min (28–80% B, v/v), 14–14.9 min (hold 80% B, v/v), 14.9–15 min (80–3% B, v/v), 15–17 min (hold 3% B, v/v). The MRM mass transitions monitored and the peptide retention times are listed in Table 1. Data collection was compartmentalized so that the relevant MRM channels were only open over the window of time that the target peptide was eluting. The instrument settings were (for CYP4F2 or CYP4F11 peptides, respectively): dwell time, 100 ms; fragmentor, 125 or 150 V; collision energy, 16 or 22 eV; and cell accelerator voltage, 7 V. Other system parameters were as follows: gas temperature, 350 °C; gas flow, 5 l/min; nebulizer, 45 psi; sheath gas temperature, 350 °C; sheath gas flow, 9 l/min; capillary voltage, 3500 V; nozzle voltage, 500 V; cell RF (radio frequency), 400; EMV (electron multiplier voltage), 1280 V; and delta EMV, 500. The data were processed by integrating the peak areas generated from the ion chromatograms for the analyte peptide and the SIL internal standard using MassHunter software (Agilent Technologies).
Table 1.
| Enzyme | Retention time | Peptide Sequence | Parent (m/z) z=2 | Fragments (m/z) z=1 |
|---|---|---|---|---|
| CYP4F2 | 9.4 min | SVINASAAIAPK | 571.3 | 499.3 |
| AA 109–120 | 657.4 | |||
| 728.4 | ||||
| SVINASAAIAPK* | 575.3 | 507.3 | ||
| internal standard | 665.4 | |||
| 736.4 | ||||
|
| ||||
| CYP4F11 | 13.7 min | TLTQLVTTYPQGFK | 798.9 | 576.4 |
| AA 76–89 | 941.6 | |||
| 1040.6 | ||||
| TLTQLVTTYPQGFK* | 802.9 | 584.4 | ||
| internal standard | 949.6 | |||
| 1048.6 | ||||
Lysine residue is 15N13C labeled: 2 nitrogen atoms and 6 carbon atoms are heavy isotopes
Genotyping
Liver DNA samples had been previously analyzed using the Illumina HumanHap550K genotyping platform, which included rs2108622 and rs1060463.20
Results
Assay Development for Detection of Vitamin K Metabolites
Isoprenyl quinones are efficiently ionized using atmospheric pressure chemical ionization (APCI).21, 22 In the MRM assay developed here for incubations using MK4 as the substrate, there were fewer background peaks in negative ion mode compared to positive ion mode and therefore the negative APCI mode was selected to ionize vitamin K metabolites. At low collision energies (~10–20 V) the molecular ions of MK4 and ω-hydroxy MK4 produced similar fragment ions due to cleavage on the phytyl chain at m/z 375, 360, 307, 292, 239, 224, and 185 (Fig. 2A). At higher collision energies (~40–50 V) the transition from M-· radical parent ion to the menadione fragment ion at m/z 185.0 was optimal, and this transition was used for the MRM-based quantitation of all metabolites described below.
FIGURE 2.

A, Q3 scan of parent ion 460.3 at 4.2 minutes from incubation with CYP4F2 Supersomes and MK4. B, MRM chromatogram of an incubation with CYP4F2 supersomes, NADPH, and MK4. Green: ω-hydroxy MK4, MRM transition 460.3>185.0, tR 4.2 min; Red: ω-carboxy MK4 MRM transition 474.4>185.0, tR 4.1 min; Blue: lapachol internal standard, MRM transition 241.0>186.1, tR 2.0 min. C, Synthetic standard of ω-hydroxy MK4.
ω-Hydroxylation of MK4 by CYP4F2
In the presence of NADPH, CYP4F2 Supersomes™ oxidized MK4 to a major product that eluted at 4.2 min with detection in the 460.3>185.0 MRM channel (Fig. 2B). Assignment of this product as ω-OH MK4 was made by comparison of its retention time and daughter ion spectrum to the authentic synthesized chemical standard (Figure 2C).
Sequential Metabolism of MK4 by CYP4F2 to ω-Carboxy MK4
CYP4F2 Supersomes™ formed a second NADPH-dependent MK4 metabolite that was detected in the 474.3>185.0 MRM channel, eluting at 4.1 min (Fig. 2B). At low collision energies, the spectra for this metabolite showed diagnostic fragments of m/z 457, 430, and 375. Loss of 44 Da from the molecular ion suggests strongly that this metabolite is the terminal carboxylic acid, ω-carboxy MK4 (Fig. 3A). It has previously been shown that, for very long chain fatty acids (VLCFAs) such as C22:0 and C26:0, a microsomal alcohol dehydrogenase (ADH) and fatty aldehyde dehydrogenase (fALDH, encoded by the ALDH3A2 gene) catalyze the two oxidative transformations from the ω-hydroxy VLCFA to the corresponding aldehyde and subsequently to the dicarboxylic acid, using NAD+ as the cofactor.23 Analogously, we found that ω-carboxy MK4 was formed in both an NAD+ or NADPH dependent manner when ω-hydroxy MK4 was used as a substrate with HLM as the enzyme source. This result demonstrates that microsomal ADH/ALDH and P450 enzymes, respectively, are able to form the ω-carboxy MK4 (Fig, 3B). Similar catalytic efficiencies for the formation of ω-carboxy MK4 from ω-hydroxy MK4 were measured for both the NAD+ and NADPH dependent reactions in human liver microsomes (Km 28 μM, Vmax 18.3 (peak area ratio, ω-carboxy MK4/lapachol internal standard), Vmax/Km 0.65 ± 0.22 for NAD+ and Km 23 μM, Vmax 8.3 (peak area ratio), Vmax/Km 0.35 ± 0.13 for NADPH) (Fig. 4).
FIGURE 3.

A, Q3 scan of parent ion 474.4 at 4.1 min. B, MRM chromatogram of an incubation with human liver microsomes, NAD+, and ω-hydroxy MK4. Red: ω-carboxy MK4 product, MRM transition 474.4>185.0, tR 4.1 min; Blue: lapachol internal standard, MRM transition 241.0>186.1, tR 2.0 min.
FIGURE 4.
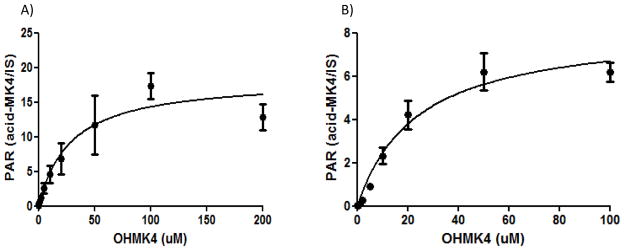
A, NAD+ and B, NADPH dependent formation of ω-carboxy metabolite of MK4 in human liver microsomal incubations. For comparative purposes, the catalytic efficiencies (Peak area ratio/μM), are Vmax/Km= 0.65 ± 0.22 and 0.35 ± 0.13 for the NAD+ and NADPH dependent reactions, respectively.
Sequential Metabolism of MK4 to ω-Carboxy MK4 by CYP4F2 Supersomes
CYP4F2 Supersomes™ form ω-carboxy MK4 from MK4. This requires the following series of oxidations: MK4 → ω-hydroxy MK4 → ω-formyl MK4 → ω-carboxy MK4. Fig. 5 shows formation kinetics of ω-hydroxy MK4 and ω-carboxy MK4 derived from CYP4F2-mediated metabolism of MK4. ω-Carboxy MK4 formation from MK4 exhibits a hyperbolic curve, suggesting there is at least some element of sequential metabolism from MK4 all the way to the ω-carboxy without release of substrate 24, 25. However, because ω-hydroxy MK4 is a readily detectable primary metabolite of MK4, it is clear that the reaction under these conditions is not completely processive.
FIGURE 5.

Sequential metabolism kinetics of MK4 to ω-hydroxy MK4 and MK4 ω-carboxy by CYP4F2 Supersomes. TOP: Km 3.2 ± 0.5 μM, kcat 0.21 ± 0.009 min−1, kcat /Km 0.039 ± 0.01 min−1μM−1 (6.5 × 10² M−1s−1). BOTTOM: Km 1.7 ± 0.5 μM, kcat 0.024 ± 0.001 (peak area ratio).
ω-Formyl MK4 Synthesis by Horse Liver ADH
We next looked for evidence of formation of the presumptive ω-formyl intermediate in the CYP4F2-mediated conversion of the MK4 terminal alcohol to the carboxylic acid. Preliminary screening of metabolic incubations for the ω-aldehyde in the expected 458.3>185.0 MRM channel did not detect this product. However, to improve confidence that it is not released along the P450 pathway from ω-alcohol to ω-carboxy, we supplemented equine liver ADH with NAD+ to biosynthesize the ω-aldehyde from authentic ω-hydroxy MK4. The resulting ω-aldehyde of MK4 eluted slightly later (tR 4.5 min) than the corresponding ω-carboxy and ω-hydroxy metabolites (Fig. 6). The MS2 spectra of the ω-formyl MK4 parent ion at low collision energies resulted in a fragmentation pattern consistent with the assigned structure. These data demonstrate that the ω-aldehyde intermediate is not released during either the ADH/fALDH- or P450-dependent metabolism of ω-hydroxy MK4 and so both oxidations are highly sequential. This also appears to be the case for metabolism of ω-hydroxy-VLCFA metabolism by microsomal ADH/fALDH23.
FIGURE 6.

A, MRM chromatogram of an incubation with equine liver ADH, NAD+, and ω-hydroxy MK4. Orange: ω-aldehyde MK4, MRM transition 458.3> 185.0, tR 4.5 min; Blue: lapachol internal standard, MRM transition 241.0>186.1, tR 2.0 min. B, Q3 scan of parent ion 458.3 at 4.5 min.
CYP4F11 is Also a Vitamin K ω-Hydroxylase
The CYP4 gene cluster on human chromosome 19 encodes several P450 enzymes that are not commercially available, viz CYP4F8, CYP4F22, and CYP4F11. CYP4F11 is of particular interest because the gene is located only 16 kb away from CYP4F2 and the two may be co-regulated.26 Additionally, CYP4F11 mRNA is present in the liver at higher levels than CYP4F2, whereas CYP4F8 mRNA is negligible in liver and hepatic CYP4F22 mRNA levels are unknown.27–29 Recombinant CYP4F11, expressed in E. coli and purified as previously described14, was reconstituted with DLPC, cytochrome b5, and P450 oxidoreductase, and its ability to oxidize MK4 and phylloquinone was compared with that of purified, reconstituted CYP4F2. Both purified enzymes ω-hydroxylated MK4 (Fig. 7), but CYP4F11 did not generate any ω-carboxy metabolite under the conditions used. The steady-state kinetics of ω-hydroxy MK4 formation were measured for both reconstituted enzyme systems and for CYP4F2 Supersomes (Fig. 8). CYP4F2 and CYP4F11 formed ω-hydroxy MK4 with similar catalytic efficiencies.
FIGURE 7.

MRM chromatograms of incubations with purified reconstituted CYP4F2 (left) and CYP4F11 (right) with PK (top) and MK4 (bottom) substrates. Peaks that are starred are not NADPH dependent. TOP: Incubations with PK. Dark green: ω-hyroxy PK metabolite, MRM transition 466.3>185.0, tR 3.9 min; Dark red: ω-carboxy PK metabolite, MRM transition 480.4>185.0, tR 3.6 min; Blue: lapachol internal standard, MRM transition 241.0>186.1, tR 2.0 min. BOTTOM: Incubations with MK4. Green: ω-hydroxy MK4 product, MRM transition 460.3>185.0, tR 4.2 min; Red: MK4 ω-carboxy product, MRM transition 474.4>185.0, tR 4.1 min; Blue: lapachol internal standard, MRM transition 241.0>186.1, tR 2.0 min. All unlabeled peaks are unidentified metabolites in the 466.3>185.0 MRM channel for PK or unidentified metabolites in the 460.3>185.0 MRM channel for MK4.
FIGURE 8.

Kinetic plots for the formation of ω-hydroxy MK4 from: A, CYP4F2 Supersomes, B, reconstituted CYP4F2, C, reconstituted CYP4F11. A, Km 3.2 ± 0.5 μM, kcat 0.21 ± 0.009 min−1, kcat /Km 0.039 ± 0.01 min−1μM−1 (6.5 × 10² M−1s−1); B, Km 1.7 ± 0.2 μM, kcat 0.067 ± 0.002 min−1, kcat /Km 0.037 ± 0.008 min−1 μM−1 (6.2 × 10² M−1s−1); C, Km 2.4 ± 0.5 μM, kcat 0.088 ± 0.004 min−1, kcat /Km 0.067 ± 0.02 min−1 μM−1 (1.1 × 10³ M−1s−1).
Absolute Quantitation of CYP4F2 and CYP4F11 in Human Liver Microsomes by Tryptic Peptide LC-MS/MS
Signature tryptic peptide LC-MS/MS18, 19 was used to quantitate CYP4F2 and CYP4F11 in human liver microsomes. The tryptic peptides monitored for CYP4F2 and CYP4F11 and their MRM transitions are shown in Table 1. These peptides were chosen for their uniqueness, lack of known polymorphic SNPs, stability, solubility, and ionization ability. Fourteen individual human liver microsomal samples from the University of Washington Liver Bank, as well as a commercially available pool of human liver microsomes from 50 donors (Xenotech) were subjected to digestion by trypsin. A standard curve was constructed using the purified preparations of CYP4F2 and CYP4F11, which were digested in the same manner as the microsomal samples in order to control for digestion efficiency. The SIL synthetic peptide was spiked into each sample after digestion and the peptides were injected onto a C18 UPLC column and chromatographically separated over a 16 min gradient. In microsomal samples from the University of Washington (UW) Liver Bank, (N = 25–27), the average protein expression levels of CYP4F2 and CYP4F11 were 14.3 ± 6.3 pmol/mg protein and 8.4 ± 1.5 pmol/mg protein, respectively (Fig. 9). For comparison, we also measured these protein levels in a commercially available pool of 50 human liver microsomes, and found similar results (14.0 and 8.3 pmol/mg protein, respectively). The standard deviations between three triplicate digestions of the same liver sample were <7%. The UW liver samples were genotyped for the common CYP4F2*3 (V433M) and CYP4F11 (D446N) alleles. In agreement with earlier findings from western blotting experiments12, the amount of CYP4F2 protein present in human liver microsomes decreased as a function of the number of *3 variant alleles (Fig. 9). In contrast, the CYP4F11 D446N variant did not affect protein levels. Collectively, these data suggest that CYP4F2 will be a more dominant contributor to initiation of vitamin K catabolism, except in CYP4F2*3 homozygotes, where CYP4F11 would be expected to become a more prominent contributor. MK4 ω-hydroxylation activity was measured in all UW liver samples and activity was found to vary from ~6 to 60 pmol/min/mg protein (the MK4 substrate concentration was 20 μM, and 1 mM MβCDX was included). There was a weak correlation between CYP4F2 content and MK4 ω-hydroxylation activity (P = 0.05, R2 = 0.13) and no correlation with CYP4F11 content (Fig. 9). Studies are ongoing to determine if other human liver enzymes might be involved in MK4 metabolism.
FIGURE 9.

TOP: CYP4F2 and CYP4F11 protein levels in human liver microsomes measured by peptide LC-MS/MS. For CYP4F2, T genotype refers to rs2108622 and corresponds to the V433M variant (TT n=4, TC n=7, CC n=14). For CYP4F11, G genotype refers to rs1060463 and corresponds to the D446N variant. (GG n=7, AG n=10, AA n=10). BOTTOM: ω-hydroxy MK4 formation correlated weakly with CYP4F2 protein content (R2 = 0.13, P = 0.05) and did not correlate with CYP4F11 protein content (R2= 0.05; P = 0.36).
Discussion
Vitamin K is the cofactor for the γ-glutamyl carboxylase (GGCX) enzyme that uses the reduced dihydroquinone form of vitamin K, along with molecular oxygen and carbon dioxide, to γ-carboxylate at least 17 human proteins30. These so called Gla proteins have domains rich in glutamic acid residues (ranging from 3–16) that upon γ-carboxylation are capable of chelating calcium ions. This induces a unique post-translational modification resulting in a significant conformational change of the Gla domain, which increases the proteins’ ability to bind to membranes and adopt a favorable orientation with respect to the membrane-associated protein substrate31, 32.
Seven of the 17 human vitamin K dependent Gla proteins are involved in blood clotting. GGCX carboxylates clotting Factors II, VII, IX, and X and Protein C, S, and Z in the liver. Subsequently the activated protein is exported out of the hepatocyte and into the blood, which is the site of clotting action. The activated clotting factors are serine proteases that cleave a peptide bond of their substrate protein in the coagulation cascade.
GGCX is a transmembrane protein located in the endoplasmic reticulum and is expressed ubiquitously, however mRNA levels are approximately 10-fold higher in the liver compared to other tissues 33. Mutations in this protein cause bleeding and calcium homeostasis disorders, and GGCX knock-out mice die from massive abdominal hemorrhage at birth.34 Thus, vitamin K deficiency, as seen in patients treated with warfarin, results in undercarboxylated Gla proteins and an anticoagulant effect ensues because active clotting factors are not produced.
The other ten known human vitamin K dependent Gla proteins are involved in a variety of physiological processes including inhibition of arterial calcification (Matrix-Gla protein), bone mineralization (osteocalcin), and cell growth regulation (Growth arrest sequence 6 protein, Gas6). The remaining seven known Gla proteins have less established physiological roles.
Vitamin K is also important in physiological processes apart from GGCX-driven activation of clotting factors. MK4 is an electron carrier in the electron transport chain in mitochondria of eukaryotic cells.35 MK4 is also an established ligand for the steroid and xenobiotic receptor (SXR).36 SXR is a nuclear receptor controlling the expression of a large family of genes involved in transport and metabolism of endo- and xenobiotics. Thus vitamin K may regulate transcription levels of numerous genes.
As noted above, there is increasing interest in the use of menaquinones (and phylloquinone) as pharmacotherapeutic agents6, 7, 30, although there appears to be wide inter-individual variability in response to supplementation with these agents.8 Therefore, a major goal of this study was to identify P450 enzymes that catalyze metabolism of MK4, delineate their relative contributions to microsomal catabolism and evaluate pharmacogenetic factors that might contribute to variability in metabolism.
An important new finding from our studies is that CYP4F11 is a vitamin K ω-hydroxylase. CYP4F11 is known to be an efficient ω-hydroxylase of 3-hydroxy fatty acids, with relatively high catalytic efficiency (kcat/Km 0.37 ± 0.14 min−1 μM−1, or 6 × 10³ M−1 s−1)14. It has also been shown to oxidize some xenobiotics, e.g. erythromycin, with very low efficiencies (kcat/Km 0.0066 min−1 μM−1, or 1 × 10² M−1 s−1)).26 Here we demonstrate that CYP4F11 is an ω-hydroxylase of MK4, albeit with relatively low efficiency (Vmax/Km= 0.067 ± 0.2 min−1 μM−1, or 1.1 × 10³ M−1 s−1). Low catalytic efficiency in vitro is likely exacerbated by poor solubility/delivery of the substrate to the enzyme active site because reaction velocities were increased more than 10-fold by inclusion of the solubilizing agent MβCDX in metabolic incubations.
CYP4F2, but not CYP4F11, metabolized MK4 in a partially processive manner to the ω-carboxy metabolite. Our data suggest further that, while CYP4F2 released some of the initially formed ω-hydroxy MK4, the ω-formyl metabolite may remain bound to the enzyme such that some of the initially formed alcohol is sequentially metabolized to the acid. Alternatively, the ω-formyl metabolite may not have been detected because this α/β-unsaturated aldehyde is sufficiently reactive to bind irreversibly to components of metabolic reaction mixtures.37 Regardless, released ω-hydroxy MK4 may take several paths to the ω-acid product; it could rebind to CYP4F2 and be further oxidized, it could be oxidized by CYP4F11 and/or other P450 enzymes in microsomes, or it could be oxidized by the microsomal ADH/fALDH complex. Insufficient quantities of the authentic ω-hydroxy metabolite precluded studies to differentiate between these possibilities.
Based on the catalytic efficiencies of formation of released ω-hydroxy MK4 we can predict which of the two CYP4F enzymes dominates metabolite formation if the relative microsomal concentrations of the two enzymes are known. CYP4F2 concentrations in human liver microsomes have been reported to average ~16 pmol/mg protein with large variability from 0–80 pmol/mg protein.38 However, it is unknown how much CYP4F11 protein is present in human liver microsomes. In human liver, CYP4F2, CYP4F3B, CYP4F11, and CYP4F12 are all readily detectable at the mRNA level.27–29 The CYP4F11 C-terminus has a relatively unique sequence compared to other human CYP4F enzymes in liver; however, extensive attempts to immunoquantitate CYP4F11 with three different commercially available antibodies failed due to inadequate selectivity of detection in microsomal samples and/or failure of the antibody to detect recombinant CYP4F11. Therefore, we opted to measure CYP4F11 (and CYP4F2) in human liver microsomes by tryptic peptide LC-MS/MS, using trypsin digests of purified CYP4F11 and CYP4F2 (calibration standard) and corresponding isotopically-labeled peptides (internal standards) for robust quantitation. These data revealed that, on average, CYP4F11 was present at approximately half the concentration of CYP4F2 in human liver microsomes. Moreover, CYP4F2, but not CYP4F11, displayed evidence of partially sequential metabolism of MK4 to the ω-acid. Therefore, it would be expected that CYP4F2 would, in general, be a more dominant contributor to the initiation of MK4 catabolism than CYP4F11. However, both enzymes exhibit at least one common genetic variant, i.e. CYP4F2 V433M (CYP4F2*3) and CYP4F11 D446N. It is known that the CYP4F2*3 allele increases warfarin maintenance dose in patients on this anticoagulant therapy due likely to an increase in hepatic vitamin K levels that warfarin must antagonize.12 The CYP4F2*3 allele is also linked to altered 20-HETE biosynthesis and hypertension risk.39 Genetic polymorphisms in the CYP4F11 gene have not been studied; however the common SNP, rs1060463 (which results in the D446N variant), occurs with a minor allele frequency of 40% in Caucasians. We reported previously that human liver microsomal preparations from donors carrying the CYP4F2*3 (V433M) allele possessed lower levels of immunoreactive CYP4F2 protein12, and the current LC-MS quantitation efforts support this earlier finding. In contrast, CYP4F11 levels in human liver microsomes did not vary with CYP4F11 D446N genotype, and microsomal MK4 ω-hydroxylation activities were independent of CYP4F11 genotype. Therefore, the common CYP4F11 D446N variant does not appear to affect P450 enzyme activity or microsomal enzyme concentrations. Consequently, in CYP4F2*3 homozygotes (5–10% of Caucasian populations), we predict that CYP4F11 enzyme activity would be a more important contributor to MK4 ω-hydroxylation, irrespective of CYP4F11 genotype. Studies with the recombinantly expressed variants are ongoing to further evaluate the functional capabilities of CYP4F11 variants.
The foregoing findings may also be relevant to the metabolism of the structurally similar molecules vitamin E and coenzyme Q, which have degradation pathways analogous to that of vitamin K. Additionally, it is unknown whether MK7, another form of vitamin K2, is a CYP4F2 and CYP4F11 substrate. This point is of interest because MK7 has been proposed as a better vitamin K supplement than PK or MK4 due to more optimal pharmacokinetic properties.40
In summary, we have shown that both CYP4F2 and CYP4F11 are vitamin K1 and K2 ω-hydroxylases and that CYP4F2, at least to some extent, sequentially metabolizes vitamin K to the ω-carboxy metabolite. However, microsomal ADH/fALDH or other P450 enzymes may also play a role in formation of this metabolite after initial ω-hydroxylation by these CYP4 enzymes. Depending on CYP4F2 genotype, either CYP4F2 or CYP4F11 is the more dominant contributor to initiation of vitamin K catabolism. These findings are important in our efforts to understand factors involved in vitamin K homeostasis and inter-individual variability in response to supplementation with these vitamins.
Acknowledgments
This work was supported in part by NIH grants, U01 GM92676 and R01 GM109743 (A.E.R), and R37 CA090426 (F.P.G), the UW School of Pharmacy UWRAPT (J.D.U. and B.P.), and the UW School of Pharmacy Brady Fund for Natural Products and Hope Barnes Fellowship Fund (K.Z.E).
Abbreviations and Textual Footnotes
- MK4
menaquinone-4
- PK
phylloquinone
- MN
menadione
- MK7
menaquinone-7
- MRM
multiple reaction monitoring
- ADH
alcohol dehydrogenase
- fALDH
fatty aldehyde dehydrogenase
- GGCX
γ glutamyl carboxylase
- NADPH
- VLCFA
very long chain fatty acid
- CYP
cytochrome P450
- MβCDX
methyl-β-cyclodextrin
References
- 1.Nakagawa K, Hirota Y, Sawada N, Yuge N, Watanabe M, Uchino Y, Okuda N, Shimomura Y, Suhara Y, Okano T. Identification of Ubiad1 as a Novel Human Menaquinone-4 Biosynthetic Enzyme. Nature. 2010;468:117–121. doi: 10.1038/nature09464. [DOI] [PubMed] [Google Scholar]
- 2.Okano T, Shimomura Y, Yamane M, Suhara Y, Kamao M, Sugiura M, Nakagawa K. Conversion of Phylloquinone (Vitamin K1) into Menaquinone-4 (Vitamin K2) in Mice: Two Possible Routes for Menaquinone-4 Accumulation in Cerebra of Mice. J Biol Chem. 2008;283:11270–11279. doi: 10.1074/jbc.M702971200. [DOI] [PubMed] [Google Scholar]
- 3.Thijssen HH, Vervoort LM, Schurgers LJ, Shearer MJ. Menadione Is a Metabolite of Oral Vitamin K. Br J Nutr. 2006;95:260–266. doi: 10.1079/bjn20051630. [DOI] [PubMed] [Google Scholar]
- 4.Elder SJ, Haytowitz DB, Howe J, Peterson JW, Booth SL. Vitamin K Contents of Meat, Dairy, and Fast Food in the U.S. Diet. J Agric Food Chem. 2006;54:463–467. doi: 10.1021/jf052400h. [DOI] [PubMed] [Google Scholar]
- 5.Booth SL, Suttie JW. Dietary Intake and Adequacy of Vitamin K. J Nutr. 1998;128:785–788. doi: 10.1093/jn/128.5.785. [DOI] [PubMed] [Google Scholar]
- 6.Dalmeijer GW, van der Schouw YT, Vermeer C, Magdeleyns EJ, Schurgers LJ, Beulens JW. Circulating Matrix Gla Protein Is Associated with Coronary Artery Calcification and Vitamin K Status in Healthy Women. J Nutr Biochem. 2013;24:624–628. doi: 10.1016/j.jnutbio.2012.02.012. [DOI] [PubMed] [Google Scholar]
- 7.Sconce E, Avery P, Wynne H, Kamali F. Vitamin K Supplementation Can Improve Stability of Anticoagulation for Patients with Unexplained Variability in Response to Warfarin. Blood. 2007;109:2419–2423. doi: 10.1182/blood-2006-09-049262. [DOI] [PubMed] [Google Scholar]
- 8.Booth SL. Roles for Vitamin K Beyond Coagulation. Annu Rev Nutr. 2009;29:89–110. doi: 10.1146/annurev-nutr-080508-141217. [DOI] [PubMed] [Google Scholar]
- 9.Sontag TJ, Parker RS. Cytochrome P450 Omega-Hydroxylase Pathway of Tocopherol Catabolism. Novel Mechanism of Regulation of Vitamin E Status. J Biol Chem. 2002;277:25290–25296. doi: 10.1074/jbc.M201466200. [DOI] [PubMed] [Google Scholar]
- 10.Bhagavan HN, Chopra RK. Coenzyme Q10: Absorption, Tissue Uptake, Metabolism and Pharmacokinetics. Free Radic Res. 2006;40:445–453. doi: 10.1080/10715760600617843. [DOI] [PubMed] [Google Scholar]
- 11.Nakamura T, Ohno T, Hamamura K, Sato T. Metabolism of Coenzyme Q10: Biliary and Urinary Excretion Study in Guinea Pigs. Biofactors. 1999;9:111–119. doi: 10.1002/biof.5520090205. [DOI] [PubMed] [Google Scholar]
- 12.McDonald MG, Rieder MJ, Nakano M, Hsia CK, Rettie AE. Cyp4f2 Is a Vitamin K1 Oxidase: An Explanation for Altered Warfarin Dose in Carriers of the V433m Variant. Mol Pharmacol. 2009;75:1337–1346. doi: 10.1124/mol.109.054833. [DOI] [PMC free article] [PubMed] [Google Scholar]
- 13.Suhara Y, Watanabe M, Nakagawa K, Wada A, Ito Y, Takeda K, Takahashi K, Okano T. Synthesis of Novel Vitamin K2 Analogues with Modification at the Omega-Terminal Position and Their Biological Evaluation as Potent Steroid and Xenobiotic Receptor (Sxr) Agonists. J Med Chem. 2011;54:4269–4273. doi: 10.1021/jm200025f. [DOI] [PubMed] [Google Scholar]
- 14.Tang Z, Salamanca-Pinzon SG, Wu ZL, Xiao Y, Guengerich FP. Human Cytochrome P450 4f11: Heterologous Expression in Bacteria, Purification, and Characterization of Catalytic Function. Arch Biochem Biophys. 2010;494:86–93. doi: 10.1016/j.abb.2009.11.017. [DOI] [PMC free article] [PubMed] [Google Scholar]
- 15.Nakano M, Kelly EJ, Wiek C, Hanenberg H, Rettie AE. Cyp4v2 in Bietti’s Crystalline Dystrophy: Ocular Localization, Metabolism of Omega-3-Polyunsaturated Fatty Acids, and Functional Deficit of the P.H331p Variant. Mol Pharmacol. 2012;82:679–686. doi: 10.1124/mol.112.080085. [DOI] [PMC free article] [PubMed] [Google Scholar]
- 16.Mulrooney SB, Waskell L. High-Level Expression in Escherichia Coli and Purification of the Membrane-Bound Form of Cytochrome B(5) Protein Expr Purif. 2000;19:173–178. doi: 10.1006/prep.2000.1228. [DOI] [PubMed] [Google Scholar]
- 17.Shen AL, Porter TD, Wilson TE, Kasper CB. Structural Analysis of the Fmn Binding Domain of Nadph-Cytochrome P-450 Oxidoreductase by Site-Directed Mutagenesis. J Biol Chem. 1989;264:7584–7589. [PubMed] [Google Scholar]
- 18.Prasad B, Lai Y, Lin Y, Unadkat JD. Interindividual Variability in the Hepatic Expression of the Human Breast Cancer Resistance Protein (Bcrp/Abcg2): Effect of Age, Sex, and Genotype. J Pharm Sci. 2013;102:787–793. doi: 10.1002/jps.23436. [DOI] [PubMed] [Google Scholar]
- 19.Deo AK, Prasad B, Balogh L, Lai Y, Unadkat JD. Interindividual Variability in Hepatic Expression of the Multidrug Resistance-Associated Protein 2 (Mrp2/Abcc2): Quantification by Liquid Chromatography/Tandem Mass Spectrometry. Drug Metab Dispos. 2012;40:852–855. doi: 10.1124/dmd.111.043810. [DOI] [PMC free article] [PubMed] [Google Scholar]
- 20.Cooper GM, Johnson JA, Langaee TY, Feng H, Stanaway IB, Schwarz UI, Ritchie MD, Stein CM, Roden DM, Smith JD, Veenstra DL, Rettie AE, Rieder MJ. A Genome-Wide Scan for Common Genetic Variants with a Large Influence on Warfarin Maintenance Dose. Blood. 2008;112:1022–1027. doi: 10.1182/blood-2008-01-134247. [DOI] [PMC free article] [PubMed] [Google Scholar]
- 21.Hansen G, Christensen P, Tuchsen E, Lund T. Sensitive and Selective Analysis of Coenzyme Q10 in Human Serum by Negative Apci Lc-Ms. Analyst. 2004;129:45–50. doi: 10.1039/b308690a. [DOI] [PubMed] [Google Scholar]
- 22.Suhara Y, Kamao M, Tsugawa N, Okano T. Method for the Determination of Vitamin K Homologues in Human Plasma Using High-Performance Liquid Chromatography-Tandem Mass Spectrometry. Anal Chem. 2005;77:757–763. doi: 10.1021/ac0489667. [DOI] [PubMed] [Google Scholar]
- 23.Sanders RJ, Ofman R, Dacremont G, Wanders RJ, Kemp S. Characterization of the Human Omega-Oxidation Pathway for Omega-Hydroxy-Very-Long-Chain Fatty Acids. FASEB J. 2008;22:2064–2071. doi: 10.1096/fj.07-099150. [DOI] [PubMed] [Google Scholar]
- 24.Woods CM, Fernandez C, Kunze KL, Atkins WM. Allosteric Activation of Cytochrome P450 3a4 by Alpha-Naphthoflavone: Branch Point Regulation Revealed by Isotope Dilution Analysis. Biochemistry. 2011;50:10041–10051. doi: 10.1021/bi2013454. [DOI] [PMC free article] [PubMed] [Google Scholar]
- 25.Bell-Parikh LC, Guengerich FP. Kinetics of Cytochrome P450 2e1-Catalyzed Oxidation of Ethanol to Acetic Acid Via Acetaldehyde. J Biol Chem. 1999;274:23833–23840. doi: 10.1074/jbc.274.34.23833. [DOI] [PubMed] [Google Scholar]
- 26.Kalsotra A, Turman CM, Kikuta Y, Strobel HW. Expression and Characterization of Human Cytochrome P450 4f11: Putative Role in the Metabolism of Therapeutic Drugs and Eicosanoids. Toxicol Appl Pharmacol. 2004;199:295–304. doi: 10.1016/j.taap.2003.12.033. [DOI] [PubMed] [Google Scholar]
- 27.Cui X, Nelson DR, Strobel HW. A Novel Human Cytochrome P450 4f Isoform (Cyp4f11): Cdna Cloning, Expression, and Genomic Structural Characterization. Genomics. 2000;68:161–166. doi: 10.1006/geno.2000.6276. [DOI] [PubMed] [Google Scholar]
- 28.Nishimura M, Yaguti H, Yoshitsugu H, Naito S, Satoh T. Tissue Distribution of Mrna Expression of Human Cytochrome P450 Isoforms Assessed by High-Sensitivity Real-Time Reverse Transcription Pcr. Yakugaku Zasshi. 2003;123:369–375. doi: 10.1248/yakushi.123.369. [DOI] [PubMed] [Google Scholar]
- 29.Hashizume T, Imaoka S, Hiroi T, Terauchi Y, Fujii T, Miyazaki H, Kamataki T, Funae Y. Cdna Cloning and Expression of a Novel Cytochrome P450 (Cyp4f12) from Human Small Intestine. Biochem Biophys Res Commun. 2001;280:1135–1141. doi: 10.1006/bbrc.2000.4238. [DOI] [PubMed] [Google Scholar]
- 30.Vermeer C. Vitamin K: The Effect on Health Beyond Coagulation - an Overview. Food Nutr Res. 2012;56:5329–5335. doi: 10.3402/fnr.v56i0.5329. [DOI] [PMC free article] [PubMed] [Google Scholar]
- 31.Vadivel K, Bajaj SP. Structural Biology of Factor Viia/Tissue Factor Initiated Coagulation. Front Biosci. 2012;17:2476–2494. doi: 10.2741/4066. [DOI] [PMC free article] [PubMed] [Google Scholar]
- 32.Banner DW, D’Arcy A, Chene C, Winkler FK, Guha A, Konigsberg WH, Nemerson Y, Kirchhofer D. The Crystal Structure of the Complex of Blood Coagulation Factor Viia with Soluble Tissue Factor. Nature. 1996;380:41–46. doi: 10.1038/380041a0. [DOI] [PubMed] [Google Scholar]
- 33.Shirakawa H, Ohsaki Y, Minegishi Y, Takumi N, Ohinata K, Furukawa Y, Mizutani T, Komai M. Vitamin K Deficiency Reduces Testosterone Production in the Testis through Down-Regulation of the Cyp11a a Cholesterol Side Chain Cleavage Enzyme in Rats. Biochim Biophys Acta. 2006;1760:1482–1488. doi: 10.1016/j.bbagen.2006.05.008. [DOI] [PubMed] [Google Scholar]
- 34.Zhu A, Sun H, Raymond RM, Jr, Furie BC, Furie B, Bronstein M, Kaufman RJ, Westrick R, Ginsburg D. Fatal Hemorrhage in Mice Lacking Gamma-Glutamyl Carboxylase. Blood. 2007;109:5270–5275. doi: 10.1182/blood-2006-12-064188. [DOI] [PMC free article] [PubMed] [Google Scholar]
- 35.Vos M, Esposito G, Edirisinghe JN, Vilain S, Haddad DM, Slabbaert JR, Van Meensel S, Schaap O, De Strooper B, Meganathan R, Morais VA, Verstreken P. Vitamin K2 Is a Mitochondrial Electron Carrier That Rescues Pink1 Deficiency. Science. 2012;336:1306–1310. doi: 10.1126/science.1218632. [DOI] [PubMed] [Google Scholar]
- 36.Suhara Y, Hanada N, Okitsu T, Sakai M, Watanabe M, Nakagawa K, Wada A, Takeda K, Takahashi K, Tokiwa H, Okano T. Structure-Activity Relationship of Novel Menaquinone-4 Analogues: Modification of the Side Chain Affects Their Biological Activities. J Med Chem. 2012;55:1553–1558. doi: 10.1021/jm2013166. [DOI] [PubMed] [Google Scholar]
- 37.Lonkar P, Dedon PC. Reactive Species and DNA Damage in Chronic Inflammation: Reconciling Chemical Mechanisms and Biological Fates. Int J Cancer. 2011;128:1999–2009. doi: 10.1002/ijc.25815. [DOI] [PMC free article] [PubMed] [Google Scholar]
- 38.Hirani V, Yarovoy A, Kozeska A, Magnusson RP, Lasker JM. Expression of Cyp4f2 in Human Liver and Kidney: Assessment Using Targeted Peptide Antibodies. Arch Biochem Biophys. 2008;478:59–68. doi: 10.1016/j.abb.2008.06.025. [DOI] [PMC free article] [PubMed] [Google Scholar]
- 39.Stec DE, Roman RJ, Flasch A, Rieder MJ. Functional Polymorphism in Human Cyp4f2 Decreases 20-Hete Production. Physiol Genomics. 2007;30:74–81. doi: 10.1152/physiolgenomics.00003.2007. [DOI] [PubMed] [Google Scholar]
- 40.Schurgers LJ, Teunissen KJ, Hamulyak K, Knapen MH, Vik H, Vermeer C. Vitamin K-Containing Dietary Supplements: Comparison of Synthetic Vitamin K1 and Natto-Derived Menaquinone-7. Blood. 2007;109:3279–3283. doi: 10.1182/blood-2006-08-040709. [DOI] [PubMed] [Google Scholar]