

Abstract
Fourier transform infrared imaging spectroscopy (FT-IRIS) has been used extensively to characterize the composition and orientation of macromolecules in thin tissue sections. Earlier and current studies of normal and polarized FT-IRIS data have primarily used tissues sectioned onto infrared transmissive substrates, such as salt windows. Recently, the use of low-emissivity (“low-e”) substrates has become of great interest because of their low cost and favourable infrared optical properties. However, data is collected in transflectance mode when using low-e slides and in transmittance mode using salt windows. In the current study we investigated the comparability of these two modes for assessment of the composition of connective tissues. FT-IRIS data were obtained in transflectance and transmittance modes from serial sections of cartilage, bone and tendon, and from a standard polymer, polymethylmethacrylate. Both non-polarized and polarized FTIR data differed in absorbance, and in some cases peak position, between transflectance and transmittance modes. However, the FT-IRIS analysis of the collagen fibril orientation in cartilage resulted in the expected zonal arrangement of fibrils in both transmittance and transflectance. We conclude that numerical comparison of FT-IRIS-derived parameters of tissue composition should account for substrate type and data collection mode, while analysis of overall tissue architecture may be more invariant between modes.
Keywords: FT-IR Imaging Spectroscopy, BaF2 window, Low-e slide, Transflectance, Transmittance
1. Introduction
Characterization of molecular changes in connective tissues such as bone and cartilage is a critical element in the development of therapeutic approaches for degenerative tissue diseases. Many studies have used Fourier transform infrared imaging spectroscopy (FT-IRIS) to evaluate the primary components of bone and cartilage in normal and disease states, including for assessment of apatitic mineral, type I and II collagen, and proteoglycans (PGs)[1, 2]. These studies include evaluation of the relative quantity of components, as well as information on collagen helical integrity and crosslinks, and fibril orientation [2–5]. In articular cartilage, the concentration and direction of type II collagen fibers vary zonally, with collagen fibers aligned roughly parallel to the surface in the superficial (surface) zone, randomly oriented in the middle zone, and perpendicular to the surface in the deep zone [6, 7]. Cartilage degeneration is associated with chemical and structural changes in the matrix and includes changes in the quantity and quality of the primary macromolecular components, such as loss of PGs and changes in collagen fiber orientation [8–10].
The orientation of collagen molecules has been investigated in bone, articular cartilage and tendon by polarized FT-IRIS, where the IR beam is polarized after sample interaction and before detection [1, 2, 11]. For highly oriented molecules, infrared absorbance band amplitude and line width will change with rotation of the polarizer [12, 13]. It has been shown that the transition moments of the collagen amide I (1594–1718 cm−1) and amide II (1492–1594 cm−1) absorbances that arise from the C=O stretch and the N-H bending/C–N stretching vibrations of the peptide backbone, respectively [14], are approximately perpendicular to each other with respect to the long axis of collagen fibrils [15]. This permits evaluation of fibril orientation through measurement of the ratio of the amide I absorbance to the amide II absorbance under polarized infrared radiation [8, 15].
Previous studies on non-polarized and polarized infrared radiation to assess chemical composition and collagen orientation have investigated tissues in transmittance mode on salt windows, such as BaF2, where the infrared beam passes through the sample without reflection (Figure 1A) [16]. However, the high cost of these IR-transparent substrates can be impractical for biologic studies where hundreds of samples are sometimes required. Low emissivity (low-e) slides (Kevley Technologies, Chesterland, OH, USA), glass microscopy slides coated with a layer of silver-doped tin oxide, have been increasingly used for infrared imaging of biological tissues. The coating is sufficiently thin to permit transmission of visible light, while remaining highly reflective in the mid-IR region[17]. Therefore, tissue samples sectioned onto these slides can be assessed by both visual light microscopy and transflectance spectroscopy [18, 19]. In addition, the cost of a low-e slide can be as little as 1/50th the cost of an IR-transparent substrate made of BaF2 or CaF2[20].
Figure 1.

Illustration of the light path in A) transmittance and B) transflectance polarized FT-IRIS.
Low-e slides are reflective to infrared radiation, so that the beam passes through the sample twice before entering the detector (Figure 1B). This form of reflectance spectroscopy reduces flux incident into the detector by roughly 50% compared to transmittance mode, but generally results in spectra with adequate signal-to-noise ratio [16, 20]. Nonetheless, recent studies have shown that transflectance data are sensitive to sample thickness variations, and scattering artifacts and spectral distortions can present in samples when data is collected in this mode[21, 22]. Such scattering artifacts may be misconstrued as chemical differences, which may lead to erroneous biochemical classifications. Thus, it remains to be confirmed whether FT-IRIS-derived spectral parameters, and related semi-quantitative chemical and structural features, collected in these two modes are comparable for connective tissues. Accordingly, the current study compares non-polarized and polarized FT-IRIS data obtained from bovine articular cartilage and highly oriented bovine tendon, as well as non-polarized data obtained from mouse tibial bone and from a polymer standard, polymethylmethacrylate (PMMA), using transmittance and transflectance.
2. Materials and Methods
2.1. Polymethylmethacrylate Standard Preparation
Thin sections of PMMA were evaluated as a reference material, such that the effect of compositional variation observed in biological tissues was not a factor. The polymer was sectioned at 5μm thickness onto either low-e slides or BaF2 windows (N=3). Samples were investigated at the same sample thickness to avoid the complication of thickness-related scattering artifacts.
2.2. Soft Tissue Preparation
Full-depth cartilage explants (medial femur) and tendons (patellar ligament) were harvested from 2–3 month old bovine knee joints. The explants were decalcified in 10% EDTA-Tris buffer solution for 4 weeks. Cartilage explants (3 mm diameter, 2 mm height) and tendons (3 × 1 × 1 mm) were fixed in formalin, embedded in paraffin, sectioned at 7μm thickness perpendicular to the articular surface for cartilage, and along the tendon long axis, and mounted onto either low-e slides or BaF2 windows (Spectral Systems, Hopewell Junction, NY). Data were acquired from three adjacent tissue sections for each tissue sample.
2.3. Hard Tissue Preparation
Wild-type mice (DBA/1 inbred) were purchased from Taconic Laboratory (Albany, NY) and bred at Temple University, School of Medicine, Central Animal Barrier Facility, according to the guidelines of the Institutional Animal Care and Use Committee (IACUC). At eight weeks of age, animals were sacrificed as part of a different study, and one tibia and three femurs were fixed in formalin, and embedded in PMMA. Sections of 5 μm thickness were obtained from cortical bone and placed onto either a low-e slide (tibia and femur) or a BaF2 window (tibia). Three tissue samples were analyzed for each substrate. Tissue sections were de-plasticized using acetone and alcohol.
2.4. FT-IRIS Data Acquisition and Analysis
FT-IRIS data were acquired at 8 cm−1 spectral resolution, and either 6.25μm pixel resolution (for cartilage and tendon) or 25μm pixel resolution (for bone and PMMA) using a point mapping Spectrum SpotLight 400 FT-IR Imaging system (PerkinElmer, Shelton, CT) for both polarized and non-polarized data. This device consists of an FT-IR microscope with an 8×8 linear array detector for FT-IR imaging. The data is presented as a “hyperspectral” image where the x and y axes are the spatial coordinates of the tissue section and the z-axis the spectra. Thus, spatially resolved maps of the molecular environments of tissue components can be obtained. For cartilage, tendon, and bone, one FT-IR spectral image was acquired per tissue sample, where, the FT-IR image included a total of 1600 spectra (image area: 0.062 mm2), 1800 spectra (image area: 0.070 mm2), and 1200 spectra (image area: 0.75 mm2), for cartilage, tendon, and bone, respectively. One spectral image was acquired from each PMMA section, where the average FT-IR image area was 1.12 mm2 (1793 spectra). For the tissues sectioned on low-e slides and BaF2 windows, data were collected in transflectance and transmittance mode, respectively. In transmittance mode, the IR beam passes through the sample and substrate once (Figure 1A). In transflectance, the infrared beam passes through the sample, is reflected from the substrate, and again passes through the sample before reaching the detector (Figure 1B). ISys 5.0 software (Malvern Instruments, Columbia, MD) was used to create FT-IR images based on the integrated areas of the absorbance bands that reflect the quantity and quality of specific components of the tissues [1]. In addition, Bassan et al [21] reported that 2nd derivative spectra may provide more accurate quantitative information for comparison among these data collection modes, and therefore second derivative spectra peak heights were measured, and positions used to accurately define the wavenumbers of the identified peaks. The areas of the carbonyl (1660–1800 cm−1), C-O-C stretching (1256–1340 cm−1) and CH3 rocking (1092–1176 cm−1) absorbances of PMMA were identified and used to characterise differences in the transmission/transflectance spectral response[23]. For the non-polarized cartilage and tendon data, collagen and proteoglycan (PG) were evaluated in the 1594–1718 cm−1 (amide I absorbance) and 985–1140 cm−1 (sugar C-O-C ring absorbance) spectral regions, respectively. The ratio of the integrated area of the PG absorbance to the amide I collagen area was evaluated to obtain the relative quantity and distribution of the PG. The ratio of the area of the absorbance centered at 1338 cm−1 (1326–1356 cm−1) to that of the amide II band (1492–1594 cm−1) was used to evaluate the helical integrity of collagen [1]. The mineral-to-matrix ratio was calculated for the bone sample as the ratio of the area of the phosphate mineral absorbance band (900–1200cm−1) to that of the amide I absorbance, centered at 1660 cm−1[1]. Finally, it has been shown that the ratio of the heights of the absorbance bands at 1660 cm−1 and 1690 cm−1is correlated to collagen maturity in bone [1], although this has not been confirmed in other tissues. This parameter was evaluated in all tissues in the current study.
2.5. Polarized FTIR Data
A silver bromide (AgBr) wire grid polarizer (PerkinElmer, Shelton, CT) was inserted in the light path before the detector (Figure 1), to polarize the IR beam [1, 24]. For direct comparison to previous work from our group where tendon was used as a standard for a tissue with oriented collagen fibrils [15], the angle of polarization was varied from 0° to 180° in 5° increments in the 0–20° and 80–105° regions, and in 15° increments from 20° to 80° and 110° to 180° regions. The ratio of the areas of the collagen amide I and II bands under polarized IR was plotted against polarization angle. It was expected that for tendon, where collagen fibrils are oriented along the long axis of the tissue, the amide I absorbance would be maximal at an angle of ~0° and minimal at an angle of ~90°. Conversely, the amide II absorbance would be maximal at angle of ~90° and minimal at an angle of ~0°. The entire data acquisition procedure through all angles was repeated on three separate samples of bovine tendon and bovine cartilage, and for both low-e and BaF2 substrates. FT-IRIS images based on the amide I/II ratio at a polarization angle of 0° were created with red indicating higher values (collagen fibers parallel to surface), deep blue indicating lower values (collagen fibers perpendicular to surface), and intermediate colors indicating random or mixed orientation [15].
2.6. Statistical Analysis
Mean values and standard deviations were calculated for each parameter using the average integrated areas or peak height ratio values obtained from the spectral images of the samples, and presented as bar graphs (N = 3 per mode of measurement for cartilage, tendon, bone, and PMMA). Analysis of Variance (ANOVA) or Student’s t tests were used to assess differences among mean values, with p ≤ 0.05 considered significant. It has been shown that ANOVA and t tests are not very sensitive to deviation from normality and can be performed on datasets that are not normally distributed [25–27]. However, like other parametric methods, they originally assume that the data does fit a normal distribution [25–27]. Even though the ratio of two normally distributed variables is not necessarily normally distributed, in the case of the current dataset, the results of a chi-squared test showed all of the ratios were normally distributed. Further, non-parametric evaluation of the data using Wilcoxon signed rank test [28] showed equivalent results to those obtained by ANOVA and t test. Therefore, the parametric tests were used to perform all comparisons. Nonlinear fits were performed and evaluated using MATLAB (MathWorks, Natick, MA), with the F-test (ANOVA F-ratio) used to evaluate the difference between models fits for data collected in transflectance as compared to transmittance. All statistical analyses were performed using Microsoft Excel 2010 (Microsoft, Redmond, WA).
3. Results
3.1. PMMA Standard
The integrated areas of the PMMA absorbances were nearly twice as large in transflectance compared to transmittance; the notable exception being in the carbonyl stretching region, where the relative increase in transflectance was just 20%(Figure 2A, B, the average spectrum from all samples is shown). In addition, two peaks were observed in the carbonyl stretching region of the transflectance spectra, at 1720 and 1740 cm−1, whereas transmittance spectra showed only a single peak at 1728 cm−1. Peak shifts were evident in other regions, where the 1148 and 1276 cm−1 peaks observed in transmittance shifted to higher wavenumbers, 1156 and 1280 cm−1, respectively, in transflectance spectra (Figure 2C). However, interestingly, the second derivative peak heights (highest intensity measured in each spectral region) showed higher values in transflectance mode only for the C-O-C stretching mode; the CH3 rocking vibration peak heights were nearly equal (Figure 2D).
Figure 2.

A) Comparison of image averaged spectra obtained in transflectance and transmittance from a polymer standard, polymethylmethacrylate (PMMA). B) FT-IRIS derived parameters (integrated areas, mean ± SD) for CH3 rocking (1092–1176 cm−1), C-O-C stretching (1256–1340 cm−1) and carbonyl stretching (1660–1800 cm−1).* p< 0.05. C) Second derivative FT-IRIS spectra show shifts in peak positions of several bands. D) FT-IRIS derived peak heights for transflectance and transmittance for CH3 rocking (1092–1176 cm−1), C-O-C stretching (1256–1340 cm−1) and carbonyl stretching (1660–1800 cm−1). The highest intensity was measured in each spectral region. * p< 0.05.
3.2. FT-IR Imaging Spectroscopy of Soft Tissue
Average spectra obtained from superficial and mid-zone cartilage in transflectance and transmittance are shown in Figure 3A, B. Transflectance measurements generally showed higher absorbances in both the superficial (Figure 3A) and middle zones (Figure 3B). No differences were seen in PG absorbance in the superficial zone between transflectance and transmittance, as there is almost no proteoglycan in the superficial zone of articular cartilage. Second derivative spectra (Figure 3C, D) indicated small shifts to higher frequencies in the amide I and amide II bands in transflectance as compared to transmittance. Higher values were obtained in transflectance compared to transmittance for all measured collagen and PG absorbance bands (Figure 4, Table 1).
Figure 3.
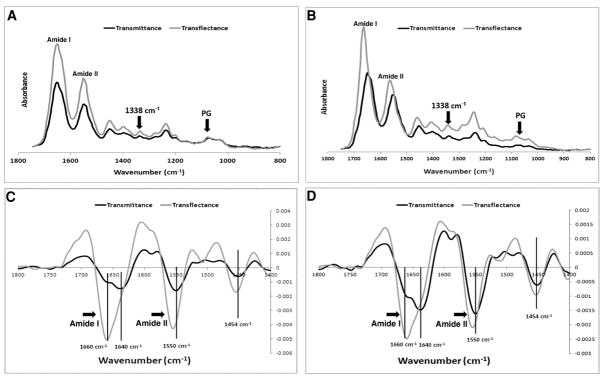
Comparison of image averaged cartilage spectra sampled in transflectance and transmittance for samples obtained from A) superficial and B) middle zone. Second derivative FT-IRIS spectra from C) superficial and D) middle zone show shifts in peak positions of the amide I and amide II sub-bands.
Figure 4.

FT-IRIS derived parameters (integrated areas, mean ± SD); A) collagen amide I, B) collagen amide II, C) collagen 1338cm−1 and D) PG sugar. Higher values are observed for the tissues sampled in transflectance (sectioned on low-e slides) compared to those sampled in transmittance (sectioned on BaF2 windows). Car=Cartilage, Ten=Tendon. * p< 0.05.
Table 1.
Differences in FT-IRIS derived parameters for tissues sampled in transmittance (sectioned on BaF2 slides) and sampled in transflectance (sampled on low-e slides).
| Cartilage – BaF2 vs. low-e | Tendon – BaF2 vs. low-e | |||
|---|---|---|---|---|
| (%)* | p-value | (%) | p-value | |
| AM I | 54 | 0.003 | 30 | 0.02 |
| AM II | 59 | 0.007 | 37 | 0.01 |
| 1338 cm−1 | 65 | 0.009 | 56 | 0.005 |
| PG | 30 | 0.02 | 25 | 0.04 |
| PG/AM I | −15 | 0.11 | 10 | 0.09 |
| 1338 cm−1/AM II | 11 | 0.1 | 32 | 0.007 |
| Collagen Maturity | −10 | 0.08 | −20 | 0.06 |
% = [(absorbance or ratio value in transflectance−value in transmittance) / (value in transflectance)]*100
No significant difference for relative PG content of cartilage and tendon was observed between the two data acquisition modes (Figure 5A). Collagen helical integrity (1338cm−1/amide II) did not vary with substrate for cartilage, but was significantly higher (p=0.007) in transflectance compared to transmittance in tendon (Figure 5B). No significant differences between the two modes were observed in the collagen maturity parameter for either tissue type (Figure 5C).
Figure 5.

FT-IRIS derived parameters (mean ± SD): A) PG/amide I, B) collagen helical integrity, and C) collagen maturity for tissues sampled in transflectance and transmittance. Higher values of collagen helical integrity was found for the tendon tissue sampled in transflectance compared to transmittance. Car=Cartilage, Ten=Tendon. * p< 0.05.
3.3. FT-IR Imaging Spectroscopy of Hard Tissue
The area of the phosphate absorbances of bone sampled in transflectance were lower than the area obtained in transmittance (Figure 6A). In addition, the band shape differed between the two modes, and for transflectance, was atypical of what is usually observed for biological hydroxyapatite [1]. The transflectance absorbance band shows two defined peaks at 1112 cm−1 and 1000cm−1, in contrast to the single broad peak centered at 1032cm−1 observed in the transmittance spectra. A higher mineral-to-matrix ratio was observed for the tissue sampled in transmittance compared transflectance, although no differences were seen in the collagen maturity (Figure 6B).
Figure 6.
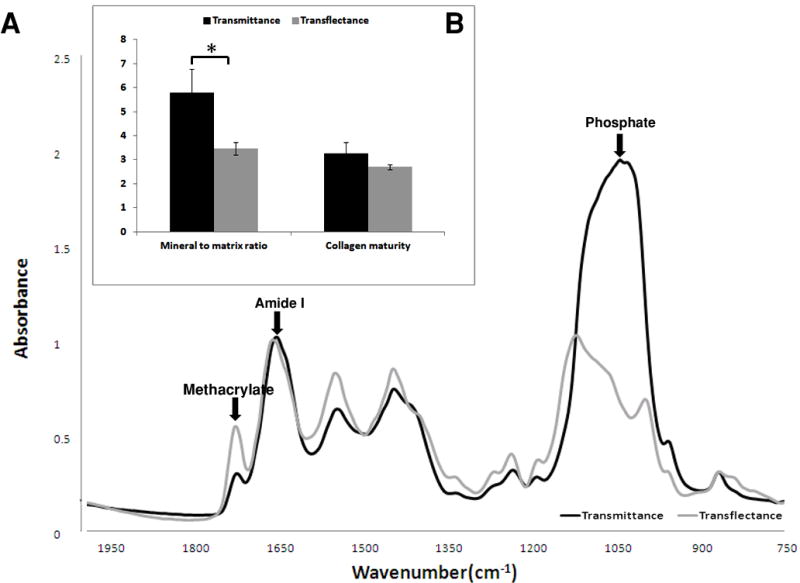
Typical FT-IRIS spectra (A) and FT-IRIS parameters (n = 3) (B) of cortical bone tissue, sampled in transflectance and transmittance. Differences in phosphate band shape, position and peak height are observed between two data collection modes. Absorbance from residual methacrylate (plastic) can be seen in the spectra, and the protein amide I vibration and major apatitic phosphate vibration are labeled.
3.4. Polarized FT-IR Imaging Spectroscopy
Tendon
The areas of the collagen amide I and amide II absorbances for bovine tendon sampled in transflectance and transmittance (Figure 7) displayed a periodic variation, as expected. Amide I exhibited a maximal amplitude at angles close to 0° and 180°, and amide II exhibited a maximal amplitude at 90°. The positions of these maxima and the corresponding minima are consistent with the known orientation of the respective transitions moments of these bonds [15]. The ratio of the amide I to the amide II area also varied periodically, ranging from 3.6 at zero and 180°, to 1.1 at 90° for transflectance measurements (Figure 7A), and 3.5 to 1.4 for transmittance (Figure 7B). This ratio is of particular importance in evaluating the architecture of tissue [15], and a statistical comparison of the amide I/amide II ratio curves for the two modes was performed. Both curves fitted well to cosines:
Figure 7.

Light microscopy image, amide I and amide II peak integrated area and amide I/II integrated area ratio for bovine tendon sampled in A) transflectance and B) transmittance. The range of amide I/amide II values is slightly larger for transflectance spectroscopy.
-
Transflectance:
Amide I/Amide II low-e = A low-e Cos (B low-e θ + ϕ low-e) + D low-e
-
Transmittance:
Amide I/Amide II BaF2 = A BaF2 Cos (B BaF2 θ + ϕ BaF2) + D BaF2
with parameters given in Table 2. However, F-test analysis demonstrated that A low-e ≠ A BaF2 (p < 0.01).
Table 2.
Amide I/Amide II cosine equation parameters for polarized tendon data collected in transmittance and transflectance.
| General Model | Coefficients (95% confidence interval) | Goodness of fit | |
|---|---|---|---|
|
| |||
| Transmittance | Amide I/Amide II BaF2 = A BaF2 Cos (B BaF2θ + ϕ BaF2) + D low- e | A= 1.27 (1.02, 1.52) | * SSE: 276.1 |
| B= 1.38 (1.13, 1.63) | R2: 0.99 | ||
| ϕ = 43.29 (18.64, 67.95) | ** RMSE: 4.29 | ||
| D= 2.65 (2.37, 2.92) | |||
|
| |||
| Transflectance | Amide I/Amide II low-e = A low-e Cos (B low-e θ + ϕ low-e) + D | A= 1.43 (1.32, 1.55) | * SSE: 191.5 |
| B= 1.68 (1.47, 1.89) | R2: 0.99 | ||
| ϕ = 28.04 (9.82, 46.26) | ** RMSE: 3.57 | ||
| D= 2.37 (2.21, 2.54) | |||
SSE = Sum of squares for error;
RMSE = Root mean square error
Cartilage
Polarized FT-IRIS images of bovine articular cartilage were obtained to compare tissue architecture findings in transflectance and transmittance (Figure 8A, B). Although variations were observed, the normal zonal arrangement of articular cartilage, with collagen fibers oriented parallel to the articular surface in the superficial zone, oriented randomly in the mid-zone, and running largely perpendicular to the articular surface in the deep zone, can be visualized in the images obtained in both acquisition modes. The most evident difference between the two modalities is the slightly higher values in the superficial zone and lower values in the deep zone for transflectance mode.
Figure 8.

Light microscopy image and FT-IRIS image based on amide I/II ratio at the polarization angle of zero for bovine cartilage sampled in A) transflectance and B) transmittance. Three different zones (superficial, middle, deep) can be distinguished in both modes based on collagen fiber orientation. Red indicates higher values (collagen fibers parallel to surface), deep blue indicates lower values (collagen fibers perpendicular to surface), and intermediate colors indicate random or mixed orientation.
4. Discussion
Several methods are available to evaluate the composition of native, repair and engineered tissues. Among them, FT-IR imaging spectroscopy is extensively used to assess cartilage, tendon and mineralized tissue composition and structure. Commensurate with the development of advanced FTIR imaging technology over the past 25 years, applications that use novel data collection modalities have evolved, including micro-ATR [29, 30], and data collection from low-e slides [1, 19, 31]. In the current study, we explored the use of a low-cost alternative to the commonly used salt windows for FT-IR analysis of all three of these tissues. We found that results obtained using BaF2 slides in transmission mode were not equivalent to results obtained in transflectance using low-e slides, both in non-polarized and polarized IR experiments, for a standard polymer material and for biological tissues. Collagen fibril orientation values obtained using polarized light exhibited a larger dynamic range in transflectance than in transmittance. The resulting greater precision could be useful for discerning subtle zonal boundaries based on collagen fibril orientation changes. Qualitatively, however, the zonal structure of articular cartilage based on polarized FT-IRIS data was similar between the two modalities, with both modalities showing the superficial zone comprised of fibrils parallel to the surface, the middle zone containing randomly oriented fibrils, and the deep zone containing collagen fibrils perpendicular to the surface.
IR data collected in transflectance was found to have higher absorbance areas for the polymer standard, PMMA CH3 rocking, C-O-C stretching and carbonyl stretching modes, the collagen amide I, II and 1338 cm−1 bands of tendon and cartilage, the PG absorbances of the cartilage, as well as mineral to matrix ratio and collagen maturity of the bone. This is consistent with the geometry of the transflectance measurement, in which the IR radiation passes through the sample twice (Figure 1). However, the absorbances were not exactly twice as large as for transmittance, and varied by frequency. A ratio of two was also not observed when the peak heights of second derivative spectra were compared. This is likely due to the distortion caused by reflection from a metallic-like surface and the resulting electric-field standing waves which cause spectral artifacts [22]. In addition, there may be slight differences in sample thickness on low-e and BaF2 slides, or possibly variation in chemical composition in the case of biological tissues because of the use of different tissue sections on low-e and BaF2 slides. However, differences from samples thickness or composition would contribute much less than reflectance differences. We believe in this study the thickness variation of PMMA was negligible based on an earlier study where thickness accuracy of histological sections was investigated [32]. Data collection from adjacent tissue sections could result in slightly different parameters, dependent on the heterogeneity of the samples, (e.g., PMMA and tissue structure does not vary substantially on the order of 7 microns), but nothing as dramatic as was seen in the differences between transflectance and transmittance samples. Thus, of the three possible reasons for the spectral differences, the reflectance artifact variations are no doubt the major contributors. In addition to higher absorbances in transflectance, slight shifts in peak positions were observed. Similarly, peak shifts were observed in recent studies that compared transflectance and transmittance data of cytosine films; these shifts were attributed to scattering artifacts and thickness variation [21].
For non-mineralized connective tissues, the artifacts can be attributable to Rayleigh scattering, which occurs when particles are much smaller (5 to 10%) than the wavelength of the light they interact with [33, 34]. The size of collagen microfibrils are ~5nm in diameter, with crosslinked fiber diameters up to 500 nm in diameter [35], while the wavelength of the IR radiation is in the range of 6 microns. Overall, optical effects arising from instrumentation, sample and substrate properties have previously been shown to more heavily influence transflection measurements and therefore result in increased spectral distortion relative to transmittance measurements [36].
The differences in the infrared spectral data acquired from the mineralized bone in transflectance vs. transmittance were dramatic. Differences in peak shape, peak position, and intensity of the mineral phosphate band were observed. In contrast to the soft tissue data, the phosphate peak intensities were lower in transflectance compared to transmittance, likely attributable to a different type of scattering phenomenon present in mineralized tissue that results either from differences in the refractive indices of the materials or from irregular hydroxyapatite (HA) particle sizes. HA, the primary mineral component of bone, typically exists as particles are on the order of 10–45 nm [37, 38]. If very irregular crystal shapes are present, scattering or dispersion within the tissue similar to that which occurs in diffuse reflectance can occur [30, 39]. In addition, hydroxyapatite may exhibit Reststrahlen bands in the phosphate absorbance region (900–1200 cm−1), an effect attributable to a change in refractive index which can happen in strongly absorbing compounds [39, 40]. Further, hydroxyapatite crystals can also cause anomalous dispersion near an absorption band, which is known as the Christiansen effect [41]. This would occur as a result of HA crystals having a high contrast edge and acting as a highly scattering point defect within the matrix [39, 42]. Although the specific origin of scattering in the mineralized tissue was not investigated here, the spectral artifacts observed in the phosphate absorbance region in transflectance mode preclude use of the low-e substrate to assess mineral composition accurately.
In previous studies, infrared spectral evaluation of collagen orientation in tendon, cartilage and bone has been performed in transmittance mode on tissues sectioned on BaF2 windows [1, 2, 15]. The results from the current study demonstrate that although the FT-IRIS-derived collagen orientation values for the amide I/amide II area ratio were qualitatively similar for data obtained in transflectance and transmittance, e.g. followed a cosine curve variation, the curves were in fact significantly different. A greater range of values was observed for the polarized transflectance measurements compared to the transmittance measurements, in particular for the non-ratio parameters of the amide I and amide II absorbances. Similar to the non-polarized absorbance data, these differences arise primarily from the spectral distortion associated with transflectance measurements. Nonetheless, FT-IRIS polarization images of the calculated amide I/II area ratio from articular cartilage sectioned on both BaF2 and low-e slides, and acquired in transmission and transflectance respectively, show the expected architecture of superficial, mid, and deep zones, which are distinguished based on the collagen fiber orientation.
5. Conclusion
Together, the results presented in this study confirm that, although qualitatively, polarized orientation data for the zonal structure of articular cartilage is similar for transmittance and transflectance, other non-polarized spectroscopic measures of soft and hard biological tissues are not always comparable when collected in transmittance and transflectance. Thus, care must be used if comparisons are made in infrared spectral studies undertaken with different data collection modes. Further, the infrared spectra of mineralized tissues sampled in transflectance showed dramatic reflectance artifacts, and thus should not be considered as a reliable source of chemical information. Regardless of the tissue type, and even in a standard polymer (PMMA), transflectance measurements had different spectral intensities, peak positions, and peak heights compared to transmittance measurements. Scattering due primarily to the reflection from the low-e slide substrate, and less so from tissue thickness variation or chemical composition differences due to evaluation of different tissue sections, were suggested as the source of these differences. Nonetheless, both transflectance and transmittance spectroscopy provide chemical and structural data from the non-mineralized connective tissue samples. Further, since low-e slides are larger (allowing more tissue sections per slide), less expensive than BaF2 windows, and can be used in histology and immunohistochemistry after FT-IR imaging is completed, transflectance sampling on low-e slides may be preferred when studies with a large number of connective tissue samples are under investigation.
Highlights.
IR data collected in transflectance are significantly different from transmittance.
Thickness variation causes spectral variation between transflectance and transmittance.
Scattering artifacts causes spectral variation between transflectance and transmittance.
Acknowledgments
This study was supported by NIH EB000744 (NP) and AR056145 (NP) and the National Institute on Aging, NIH, intramural program (RGS). The study sponsors had no involvement in the study design, in the collection, analysis and interpretation of data; in the writing of the manuscript; and in the decision to submit the manuscript for publication. We acknowledge Ms. Roshanak Razmpour for sectioning hard tissue samples.
Footnotes
Conflict of Interest Statement
The authors declare no conflict of interest related to this work.
Publisher's Disclaimer: This is a PDF file of an unedited manuscript that has been accepted for publication. As a service to our customers we are providing this early version of the manuscript. The manuscript will undergo copyediting, typesetting, and review of the resulting proof before it is published in its final citable form. Please note that during the production process errors may be discovered which could affect the content, and all legal disclaimers that apply to the journal pertain.
Contributor Information
Fayez Safadi, Email: fsafadi@neomed.edu.
Richard Spencer, Email: spencerri@mail.nih.gov.
Nancy Pleshko, Email: npleshko@temple.edu.
References
- 1.Boskey A, Camacho NP. Biomaterials. 2007;28:2465–2478. doi: 10.1016/j.biomaterials.2006.11.043. [DOI] [PMC free article] [PubMed] [Google Scholar]
- 2.Camacho NP, West P, Torzilli PA, Mendelsohn R. Biopolymers. 2001;62:1–8. doi: 10.1002/1097-0282(2001)62:1<1::AID-BIP10>3.0.CO;2-O. [DOI] [PubMed] [Google Scholar]
- 3.Kim M, Bi XH, Horton WE, Spencer RG, Camacho NP. Journal of Biomedical Optics. 2005;10 doi: 10.1117/1.1922329. [DOI] [PubMed] [Google Scholar]
- 4.Potter K, Kidder LH, Levin IW, Lewis EN, Spencer RGS. Arthritis and Rheumatism. 2001;44:846–855. doi: 10.1002/1529-0131(200104)44:4<846::AID-ANR141>3.0.CO;2-E. [DOI] [PubMed] [Google Scholar]
- 5.West PA, Bostrom MPG, Torzilli PA, Camacho NP. Applied Spectroscopy. 2004;58:376–381. doi: 10.1366/000370204773580194. [DOI] [PubMed] [Google Scholar]
- 6.Moger CJ, Barrett R, Bleuet P, Bradley DA, Ellis RE, Green EM, Knapp KM, Muthuvelu P, Winlove CP. Osteoarthritis and Cartilage. 2007;15:682–687. doi: 10.1016/j.joca.2006.12.006. [DOI] [PubMed] [Google Scholar]
- 7.Zheng S, Xia Y. Osteoarthritis and Cartilage. 2009;17:1519–1528. doi: 10.1016/j.joca.2009.05.013. [DOI] [PMC free article] [PubMed] [Google Scholar]
- 8.Bi XH, Yang X, Bostrom MPG, Camacho NP. Biochimica Et Biophysica Acta-Biomembranes. 2006;1758:934–941. doi: 10.1016/j.bbamem.2006.05.014. [DOI] [PubMed] [Google Scholar]
- 9.Bi X, Yang X, Bostrom MP, Bartusik D, Ramaswamy S, Fishbein KW, Spencer RG, Camacho NP. Anal Bioanal Chem. 2007;387:1601–1612. doi: 10.1007/s00216-006-0910-7. [DOI] [PMC free article] [PubMed] [Google Scholar]
- 10.Saarakkala S, Julkunen P, Kiviranta P, Makitalo J, Jurvelin JS, Korhonen RK. Osteoarthritis Cartilage. 2010;18:73–81. doi: 10.1016/j.joca.2009.08.003. [DOI] [PubMed] [Google Scholar]
- 11.Arteaga-Solis E, Sui-Arteaga L, Kim M, Schaffler MB, Jepsen KJ, Pleshko N, Ramirez F. Matrix Biol. 2011;30:188–194. doi: 10.1016/j.matbio.2011.03.004. [DOI] [PMC free article] [PubMed] [Google Scholar]
- 12.Griffiths PR, de Haseth JA. Fourier Transform Infrared Spectroscopy. Wiley; Hoboken, New Jersey: 2007. [Google Scholar]
- 13.Ikeda R, Chase DB, Everall NJ. In: Handbook of vibrational spectroscopy. Chamlmers JM, Griffiths PR, editors. Wiley; Chishester-West Sussex: 2002. [Google Scholar]
- 14.Miller LM, Dumas P. Current Opinion in Structural Biology. 2010;20:1–8. doi: 10.1016/j.sbi.2010.07.007. [DOI] [PMC free article] [PubMed] [Google Scholar]
- 15.Bi X, Li G, Doty SB, Camacho NP. Osteoarthritis and Cartilage. 2005;13:1050–1058. doi: 10.1016/j.joca.2005.07.008. [DOI] [PubMed] [Google Scholar]
- 16.Cohen JA, Virnelson CR. 5160826. USA: US Patent #. 1992 FT-IR spectrometer window and method.
- 17.Cohen JA, Virnelson C Patent, editor. FT-IR spectrometer window and method. USA: 1991. [Google Scholar]
- 18.Griffith PR. In: Infrared and Raman Spectroscopic Imaging. Salzer R, Siesler HW, editors. Wiley-VCH Verlag GmbH & Co; Weinheim: 2009. [Google Scholar]
- 19.Diem M, Matthaus C, Chernenko T, Romeo MJ, Miljkovic M, Bird B, Schubert J, Papamarkakis K, Laver N. In: Infrared and Raman Spectroscopic Imaging. Salzer R, Siesler HW, editors. Wiley-VCH Verlag GmbH & Co. KGaA; Weinheim: 2009. [Google Scholar]
- 20.Miller LM. National Synchrotron Light Source. Brookhaven National Laboratory; 2009. Infrared Microspectroscopy and Imaging; pp. 57–61. [Google Scholar]
- 21.Bassan P, Lee J, Sachdeva A, Pissardini J, Dorling KM, Fletcher JS, Henderson A, Gardner P. Analyst. 2012 doi: 10.1039/c2an36090j. [DOI] [PubMed] [Google Scholar]
- 22.Filik J, Frogley MD, Pijanka JK, Wehbe K, Cinque G. Analyst. 2012;137:853–861. doi: 10.1039/c2an15995c. [DOI] [PubMed] [Google Scholar]
- 23.Kaczmarczyk B, Morejko-Buz B, Stolarzewicz A. Fresenius J Anal Chem. 2001;370:899–903. doi: 10.1007/s002160100841. [DOI] [PubMed] [Google Scholar]
- 24.Infrared Polarizers – Theory and Applications. Application note PIKE Technologies; 2005. [Google Scholar]
- 25.Glass GV, Peckham PD, Sanders JR. Rev Educ Res. 1972;42:237–288. [Google Scholar]
- 26.Lix LM, Keselman JC, Keselman HJ. Rev Educ Res. 1996;66:579–619. [Google Scholar]
- 27.Harwell MR, Rubinstein EN, Hayes WS, Olds CC. J Educ Stat. 1992;17:315–339. [Google Scholar]
- 28.Crichton N. J Clin Nurs. 2000;9:584–584. [PubMed] [Google Scholar]
- 29.Kazarian SG, Chan KL. Applied Spectroscopy. 2010;64:135A–152A. doi: 10.1366/000370210791211673. [DOI] [PubMed] [Google Scholar]
- 30.Gulley-Stahl HJ, Bledsoe SB, Evan AP, Sommer AJ. Applied Spectroscopy. 2010;64:15–22. doi: 10.1366/000370210792966161. [DOI] [PMC free article] [PubMed] [Google Scholar]
- 31.Diem M, Romeo M, Matthaus C, Miljkovic M, Miller L, Lasch P. Infrared Physics & Technology. 2004;45:331–338. [Google Scholar]
- 32.Stiller KJ, Suss B. Experimental Pathology. 1983;24:213–215. doi: 10.1016/s0232-1513(83)80035-8. [DOI] [PubMed] [Google Scholar]
- 33.Jones AR. Progress in Energy and Combustion Science. 1999;25:1–53. [Google Scholar]
- 34.Rayleigh Proceedings of the Royal Society of London Series a-Containing Papers of a Mathematical and Physical Character. 1921;99:10–18. [Google Scholar]
- 35.Shoulders MD, Raines RT. Annu Rev Biochem. 2009;78:929–958. doi: 10.1146/annurev.biochem.77.032207.120833. [DOI] [PMC free article] [PubMed] [Google Scholar]
- 36.Davis BJ, Carney PS, Bhargava R. Analytical Chemistry. 2010;82:3474–3486. doi: 10.1021/ac902067p. [DOI] [PubMed] [Google Scholar]
- 37.Pleshko N, Boskey A, Mendelsohn R. Biophys J. 1991;60:786–793. doi: 10.1016/S0006-3495(91)82113-0. [DOI] [PMC free article] [PubMed] [Google Scholar]
- 38.Arsenault AL, Grynpas MD. Calcified Tissue International. 1988;43:219–225. doi: 10.1007/BF02555138. [DOI] [PubMed] [Google Scholar]
- 39.Wendlandt WH, HG . Reflectance Spectroscopy. John Wiley & Sons, Inc; New York: 1966. [Google Scholar]
- 40.Busca G, Resini C. Encyclopedia of Analytical Chemistry. John Wiley & Sons, Ltd; 2006. [Google Scholar]
- 41.Barnes RB, Bonner LG. Physical Review. 1936;49:732–740. [Google Scholar]
- 42.Kortum G. Reflectance Spectroscopy. Springer-Verlag; New York: 1969. [Google Scholar]