

Summary
Background
Tissue factor (TF) encryption plays an important role in regulating TF coagulant activity. Potential differences in experimental cell model systems and strategies hampered our understanding of the TF encryption mechanisms.
Objective
The aim of the present study is to characterize procoagulant activity status of TF in different cell types, and to determine whether increased TF procoagulant activity following the activation stems from transformation of the cryptic TF to active form.
Methods
Simultaneous kinetic analyses of TF-FVIIa activation of FX and FVIIa binding to cell surface TF were performed under identical experimental conditions in fibroblast (WI-38), cancer cell (MDA-231), endothelial cell (HUVEC), and monocytic cell (THP-1) model systems. These data were then utilized to estimate TF coagulant specific activity and percentages of active and cryptic TF present in these cell types.
Results
MDA-231 and WI-38 cells express 10 to 100-times more TF on their cell surfaces compared to perturbed HUVEC and THP-1 cells. TF specific activity on cell surfaces of MDA-231, WI-38, and THP-1 cells was very similar. Nearly, 80–90% of the TF in MDA-231, WI-38, and THP-1 cells was cryptic. A plasma concentration of FVII would be sufficient to bind both active and cryptic TF on cell surfaces. Increased TF activity following cell activation stems from decryption of cryptic TF rather than increasing the coagulant activity of the active TF.
Conclusions
Our data demonstrate that TF encryption is not limited to a specific cell type, and unlike previously thought, majority of the TF expressed in cancer cells is not constitutively procoagulant.
Keywords: Tissue factor, encryption, active, cryptic, FVIIa
Introduction
The procoagulant activity of the extrinsic coagulation initiator, tissue factor (TF), on cell surfaces is tightly regulated by various mechanisms, including post-translational mechanisms, as a means to maintain the normal hemostatic balance [1]. Previous studies with cultured cells clearly showed that unperturbed cells, even if they contain TF that is capable of binding to zymogen FVII or FVIIa, express very low procoagulant activity and a stimulus or cell disruption is required to fully express TF procoagulant activity [2–7]. A variety of mechanisms have been proposed by which TF is maintained in the cryptic state at the cell surface and processes that decrypt the latent activity of the encrypted TF. Among the proposed mechanisms, phosphatidylserine (PS) as the primary regulator of TF procoagulant activity on cell surfaces has been widely accepted [1,8]. Recent studies have suggested that protein disulfide isomerase (PDI)-dependent thiol regulation of TF’s allosteric Cys186-Cys209 disulfide bond also plays a critical role in regulating TF procoagulant activity on cell surfaces [6,7,9]. This later mechanism remained controversial at present because of the lack of direct evidence supporting this concept and failure of independent studies to confirm it [10–12]. However, differences in experimental models and cell systems could have contributed to some of the perceived controversies.
A major limitation in investigating the regulation of TF activity on cell surfaces is that the functional characteristics that identify cryptic and procoagulant TF are largely arbitrary and non-quantifiable, as there was no unified definition on what constitutes cryptic TF, and unique reagents that specifically recognize cryptic or procoagulant TF were lacking. Further, use of different experimental cell model systems and strategies in different studies by various investigators confounded the problem in comparing/contrasting the published data. For example, differences in FVIIa affinity to cell surface TF as measured in coagulant functional assays (e.g., factor X activation) vs. binding studies were used to differentiate between the active and the cryptic TF, and also to investigate decryption mechanisms [4,7,13]. However, a comparison of the affinities derived from functional assays using unlabelled FVIIa that do not involve washings and the binding studies using radiolabeled FVIIa involving multiple washings could be problematic and error prone. Further, it is unclear at present whether TF encryption is unique to specific cell types, such as monocytic cells and keratinocytes, but absent in other cell types, such as cancer cells. A relatively modest increase in TF activity in cancer cells following their perturbation was interpreted as TF expressed in these cells being constitutively active [9,14]. However, there was no real evidence showing that TF expressed in cancer cells is more active than TF expressed on monocytes or endothelial cells. Despite the general belief that latent TF on cell surfaces expresses little TF procoagulant activity, there is no clear data confirming whether the latent TF is completely inert or possesses a low but significant procoagulant activity. It is also unclear whether the increased TF activity on cell surfaces following stimulation actually comes from de-encryption of the cryptic TF or is the result of a further increase in the activity of already active TF population.
To obtain answers to some of the above questions, in the present study, we have analyzed FVIIa binding to cell surface TF and the subsequent expression of TF-FVIIa procoagulant activity under identical experimental conditions. We have used four different cell types- LPS-stimulated monocytic THP-1 cells, cytokine-stimulated HUVEC, WI-38 fibroblasts and MDA-231 cancer cells, to determine potential differences in FVIIa binding to active and cryptic TF and estimate the relative proportions of them in various cell types. Our data revealed that total TF specific activity, as determined by the rate of FX activation for mole TF-FVIIa complexes formed at the cell surface near saturating concentrations of FVIIa, was in fact lower in cancer cells than in THP-1 and endothelial cells, indicating that cancer cells do not express entirely constitutively active TF. About 80–85% of the TF expressed in cancer cells, fibroblasts and THP-1 cells, is in the cryptic state. Interestingly, in perturbed endothelial cells ~65% of the TF is active. Our data also indicate that cryptic TF possess very little procoagulant activity, if any, and the increased TF procoagulant activity at the cell surface following perturbation primarily comes from the increased procoagulant activity of the cryptic TF. Data of the present study will be helpful in resolving some of the discrepancies in the data on TF activation using different cell model systems and also in designing future experimental strategies to elucidate pathways that regulate TF encryption and de-encryption.
Materials and methods
Reagents
Recombinant human factor VIIa (FVIIa) was from Novo Nordisk (Gentofte, Denmark). Purified human factor X was purchased from Enzyme Research Laboratories (South Bend, IN). Purified human factor Va, factor Xa and human alpha-thrombin were from Haematologic Technologies, Inc. (Essex Junction, VT). Prothrombin and affinity purified rabbit anti-human FVIIa polyclonal antibody were a kind gift from Dr. Walter Kisiel, University of New Mexico Health Sciences Center, Albuquerque, NM. Preparation and characterization of monospecific polyclonal antibodies against human TF was described earlier [15]. TF10H10 and TF9C3 hybridomas were kindly provided by James H. Morrissey, University of Illinois, College of Medicine, Urbana, IL. TF mAbs were purified from ascites using Affi-Gel Protein A MAPS II Kit from Bio-Rad (Hercules, CA). HgCl2 and ionomycin were from Sigma (St Louis, MO). FXa chromogenic substrate (S-2765) was from Diapharma (West Chester, OH) and thrombin chromogenic substrate (Chromozym, TH) was from Roche Applied Science (Indianapolis, IN). Alkaline phosphatase-labeled streptavidin and BluePhos Microwell Phosphatase Substrate System were from KPL, Gaithersburg, MD.
Cell culture
MDA-231 breast carcinoma cells and human lung fibroblasts (WI-38) were obtained from American Type Culture Collection (ATCC) (Manassas, VA) and cultured in Dulbecco-modified Eagle medium supplemented with 1% penicillin/streptomycin and 10% fetal bovine serum (FBS). Human monocytic leukemia cell line, THP-1, was obtained from ATCC and was cultured in RPMI 1640 medium containing 1% penicillin/streptomycin and 10% fetal calf serum. Primary human umbilical vein endothelial cells (HUVEC) were obtained from Lonza (Walkersville, MD) and cultured in EBM-2 basal media supplemented with growth supplements (Lonza Walkersville) and 5% FBS. Endothelial cells from passages 3 to 7 were used in the present studies. For experiments, adherent cells were plated in 48-well plates and cultured for two days to reach confluency, and confluent monolayers were used for all experiments. THP-1 cells were cultured as cell suspensions in T-75 flasks. All cell types were cultured at 37°C and 5% CO2 in a humidified incubator. Monolayers or cell suspensions (THP-1 cells) were washed twice with buffer A (10 mM N-2-hydroxyethylpiperazine-N′-2-ethanesulfonic acid [HEPES], 0.15 M NaCl, 4 mM KCl, and 11 mM glucose, pH 7.5) before they were used in experiments.
TF activity assay
HUVEC were stimulated with TNF-α + IL1-β (20 ng/ml each) for 6 h in EBM-2 serum-rich medium. THP-1 (1 × 10⁶ cells/ml) were stimulated with 1 μg/ml LPS for 4 h in RPMI serum-rich medium. Cells were then washed once with buffer A, and incubated with varying concentrations of FVIIa in buffer B (buffer A containing 1 mg/ml bovine serum albumin (BSA), 5 mM CaCl2 and 1 mM MgCl2) for 2 h at room temperature under gentle shaking. At the end of the incubation period, cells were washed four times with buffer B to remove excess unbound FVIIa and then FX (175 nM) was added to the cells. FXa generation was allowed for 2 min for WI-38 and MDA-231 cells and 15 min for stimulated HUVEC and THP-1 cells, at which times the rate of factor X activation was progressive and linear. An aliquot was diluted into the stopping buffer (Tris-buffered saline containing 1 mg/ml BSA and 10 mM EDTA) and the amount of FXa generated was measured in a chromogenic assay as described previously [11].
FVIIa binding to cells
For cell surface FVIIa binding analyses, cells were incubated with varying concentrations of unlabeled FVIIa in buffer B for 2 h at room temperature as described above for the TF activity assay. To determine TF-specific FVIIa binding, in parallel wells, cells were incubated with TF polyclonal antibodies (100 μg/ml) for 45 min before adding FVIIa. At the end of 2 h incubation with FVIIa, cells were washed four times with 0.25 ml of buffer B to remove unbound FVIIa. The surface bound FVIIa was then eluted by adding 150 μl of buffer A containing BSA (1 mg/ml) and 10 mM EDTA to the cells for 5 min. Quantitative estimation of FVIIa in eluates was determined in a FXa generation assay utilizing a saturating concentration of relipidated TF (10 ng/ml; 200 pM). The values were interpolated from a standard curve constructed with known concentrations of FVIIa (0.02 to 1.2 ng/ml). To determine the accuracy of the assay in determining FVIIa levels quantitatively, FVIIa levels in the same eluted samples were also measured in an ELISA using affinity-purified FVIIa polyclonal antibodies. FVIIa levels determined with the two assays agreed at levels of FVIIa >0.5 ng/ml, confirming that FVIIa levels estimated using the function-based assay were accurate. However, the lower detection limit of FVIIa in ELISA was about 0.5 ng/ml whereas FVIIa as low as 0.02 ng/ml can be detectable accurately in the function-based assay. Because of the lower sensitivity of the ELISA, this assay was not used further, and FVIIa levels in all our samples were measured using the function-based assay.
Radiolabeled TF monoclonal antibody and FVIIa binding to cells
TF monoclonal antibodies, 10H10 and 9C3, and FVIIa were labeled with 125I using Iodo-Gen (Pierce)-coated tubes and Na125I (Perkin Elmer) according to the manufacturer’s technical bulletin and as described previously [16]. Varying concentrations of radiolabeled TF mAb were added to cells and incubated for 2 h at room temperature, and then the unbound material was removed, cells were washed and the bound radioactivity was eluted by adding 100 mM glycine, pH 2.3 for 5 min. The radioactivity in the eluted material was counted in a gamma counter. Since our earlier studies [11,16] showed very little non-specific binding of 125I-TF mAbs to cells, there was no need to perform parallel experiments using excess of unlabeled TF mAb to block 125I-TF mAb binding to cells to determine the specific binding of TF mAbs to cells. 125I-FVIIa binding studies were performed in the presence and absence of polyclonal anti-TF IgG (100 μg/ml) to determine TF-specific binding as described earlier [11,16]. Experimental conditions for FVIIa binding to cells were essentially the same as those were used for TF mAb binding.
Prothrombinase activity assay
To determine prothrombinase activity, monolayers were incubated with FVa (10 nM) and FXa (1 nM) for 5 min, and then substrate prothrombin (1.4 μM) was added. At the end of a 1-minute activation period, an aliquot was removed into the stop buffer, and thrombin generated was measured by a chromogenic assay using Chromozym TH, as described previously [11].
Real-time quantitative PCR
For analysis of FVIIa-TF-mediated signaling, confluent monolayers of MDA-231 cells grown in 6-well plates were serum starved overnight, the spent medium was replaced with fresh serum-free DMEM, and the cells were allowed to stabilize for 2 h in a CO2 incubator at 37°C. Then, the cells were incubated at 37°C with varying concentrations of FVIIa for 75 min, or 2 nM of FVIIa for 75 min, followed by additional FVIIa (10 nM) or a control vehicle for another 75 min. At the end of the treatments, cells were lysed in TRIZOL reagent (Invitrogen, San Diego, CA), total RNA was isolated and reverse transcribed to cDNA using High Capacity cDNA Reverse Transcription Kit (Applied Biosystems) following the manufacturer’s instructions. IL-8 mRNA levels were determined using a Step One Plus Real time PCR system (Applied Biosystems). PCR reaction mixtures were made of 40 ng of cDNA (for IL-8) or 4 ng of cDNA (for GAPDH internal control), 10 μM of primers, 5 μl of 2X iTaq™ SyBR® Green Supermix with ROX (Bio-Rad, Hercules, CA). All PCR analyses were performed in triplicates.
Results
FVIIa binding to cell surface TF and TF-FVIIa activation of FX in various cell types
A major hurdle in comparing FVIIa binding to cell surface TF and the subsequent TF-FVIIa activation of factor X in various cell types from published studies is that these experiments have often been performed using varying experimental protocols and methodologies. Thus, it is difficult to obtain meaningful conclusions from extrapolating results obtained by various groups on the activity status of TF in different cell types and its encryption and decryption mechanisms. Therefore, in the present study we have compared the coagulant activity of TF at the cell surface and its relation to FVIIa binding in four different cell types using identical experimental procedures. Four cell lines chosen were - WI-38 fibroblasts, MDA-231 cancer cells, LPS-stimulated monocytic THP-1, and cytokine-perturbed HUVEC - the cell systems that have been used often in investigating the regulation of TF activity on cell surfaces and represent cell types from different lineages.
First, we analyzed TF protein expression in these cell types by immunoblotting. As shown in Fig. 1A, when equal amount of total cell protein was loaded for all cell types, TF protein levels in perturbed HUVEC and THP-1 cells were markedly lower than TF protein levels observed in WI-38 fibroblasts and MDA-231 cancer cells that constitutively express TF. Unperturbed HUVEC and THP-1 cells showed undetectable or very low levels of TF protein, respectively. In all cell types, TF existed as a monomer and migrated as ~48 kDa protein. Traces of TF migrated at a higher mol. wt. in MDA-231 cells (Fig. 1A), which may represent TF dimer, was insignificant and constituted less than 2%. Next, to analyze TF protein from four cell types more closely on immnublot analysis, equal amount of TF antigen from all cell types (as measured in TF ELISA of the whole cell lysates, data not shown) was subjected to Western blot analysis. 10–200 times more HUVECs and THP-1 cells, respectively, were required to obtain similar levels of total TF antigen as that of WI-38 fibroblasts and MDA-231 carcinoma cells (data not shown). In all cell types, TF existed as a monomer with no detectable homo or heterodimers (Fig. 1B). Molecular weight determination based on pre-stained Precision Plus Protein standards (Bio-Rad) indicated that TF expressed in stimulated HUVEC or THP-1 cells may be ~ 1 to 2 kDa lower in molecular weight than TF expressed in WI-38 and MDA-231. Although these data indicate that there could be some minor differences in post-translational modifications of TF among these cell types, this needs further evaluation by other methods.
Fig. 1.
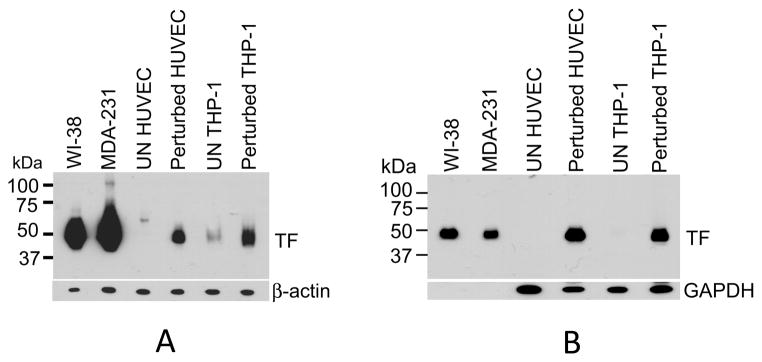
Analysis of TF protein expressed in various cell types. Confluent monolayers of WI-38, MDA-231, HUVEC (unperturbed and perturbed with TNF-α/IL1-β, 20 ng/ml each for 6 h) grown in 6-well plates and THP-1 (unperturbed and perturbed with LPS, 1 μg/ml for 4 h) in suspension were lysed in non-reducing 1X SDS-PAGE buffer. (A) Equal amount of protein (10 μg) from each cell type was then subjected to non-reducing SDS-PAGE (on 12% gel) and immunoblotted using TF monoclonal antibody (9C3, 2 μg/ml). (B) Approximately equal amount of TF antigen (0.2 ng), arising from varied cell numbers of different cell types (2 × 10⁵ for THP-1 cells, 0.5 × 10⁴ for HUVEC, 0.5 × 10³ for WI-38 and MDA-231 cells) was subjected to immunoblot analysis as in Fig. 1A.
Next, we analyzed TF-FVIIa activation of FX and FVIIa binding to TF in above four cell types under identical experimental conditions. Both the binding and activity experiments were performed at room temperature to allow their measurements without any further manipulation. It may be pertinent to note here that any TF-dependent FVIIa internalization that may occur at room temperature neither affects TF antigen levels nor TF-FVIIa coagulant activity at the cell surface [16]. Measurement of cell surface TF activity showed increasing rates of FX activation with increasing concentrations of FVIIa in all cell types (Fig. 2A–D). FX activation reached saturation at very low concentrations of FVIIa, particularly in case of HUVEC and THP-1 cells. Kinetic analysis of the FX activation data shown in Fig. 2A–D yielded the following KD for FVIIa binding to coagulant active TF expressed in various cell types (nM): HUVEC, 0.054 ± 0.006; THP-1 cells, 0.072 ± 0.043; WI-38 fibroblasts, 0.124 ± 0.017; and MDA-231 cells, 0.395 ± 0.085. Evaluation of FVIIa binding by saturation binding analyses in parallel revealed that somewhat higher concentrations of FVIIa, than those needed to obtain maximal FX activation, were required to saturate all available TF sites on the cell surface (Fig. 2E–H). Analysis of FVIIa saturating binding curves yielded the following calculated KD values for FVIIa binding to TF (nM)- HUVEC, 0.106 ± 0.014; THP-1, 0.839 ± 0.376; WI-38, 1.404 ± 0.406; and MDA-231 cells, 3.351 ± 0.616. Data from these experiments clearly demonstrate that although higher concentrations of FVIIa were required to assemble TF-FVIIa complexes with cryptic TF than those with coagulant active TF, plasma concentration of FVII (10 nM) would be sufficient to bind most of the TF, both active and cryptic, in all cell types.
Fig. 2.
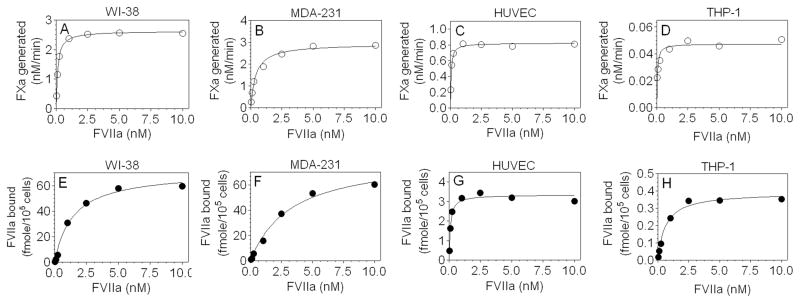
Determination of cell surface TF-FVIIa coagulant activity and FVIIa binding to cell surface TF in various cell types. WI-38, MDA-231, and cytokine-perturbed HUVEC (105 cells/well in 48-well plates) and LPS-perturbed THP-1 cells (106 cells) were washed once with buffer A and then TF-FVIIa coagulant activity (A–D) and FVIIa binding to TF (E–H) were performed in parallel under identical experimental conditions. For measurement of TF-FVIIa activity, cells were incubated with varying concentrations of FVIIa (0.025– 10 nM) for 2 h at room temperature. At the end of incubation period, cells were washed four times in calcium containing buffer to remove unbound FVIIa, and FX (175 nM) was added to cells and the rate of FX activation was measured. For FVIIa binding studies, cells were incubated with unlabeled FVIIa as described above for TF activity assay. Specific FVIIa binding was obtained by incubating cells with TF polyclonal antibodies (100 μg/ml) for 45 min before adding FVIIa. Surface bound FVIIa was then eluted with buffer containing EDTA and the amount of FVIIa in the eluates was quantitated in FXa generation assay utilizing saturating concentration of relipidated TF. Unknown values were interpolated from a standard curve made using varying concentrations of FVIIa. Results depicted in the figure are mean of three experiments. For all cell types, including THP-1 cells, data was represented for 105 cells for better comparison.
Further, utilizing the same data sets, we determined the coagulant specific activity of cell surface TF in all four cell types by calculating the amount of FXa generated (nM)/min for fmole FVIIa bound to TF at varying concentrations of FVIIa added to cells. As shown in Fig. 3A–D, TF specific activity was higher when cells were incubated with low concentrations of FVIIa; TF specific activity was markedly reduced at higher FVIIa concentrations. FVIIa-TF complexes formed at low concentrations of FVIIa (0.025 to 0.1 nM), which primarily results from FVIIa binding to active TF, resulted in 0.4 to 1.2 nM FXa generated/min/fmole FVIIa-TF in different cell types. The specific activity of TF-FVIIa complexes formed at higher concentrations of FVIIa was markedly lower, 5 to 12% of the specific activity observed at low concentrations of FVIIa, not only in THP-1 cells but also in MDA-231 cells and fibroblasts. These data suggest that most of the TF-FVIIa complexes formed on MDA-231 cells and fibroblasts were also coagulant inactive as in THP-1 cells. Interestingly, the specific activity of TF on cytokine-perturbed endothelial cells when all TF sites were occupied by FVIIa was about 50% of that seen at lower FVIIa concentrations.
Fig. 3.
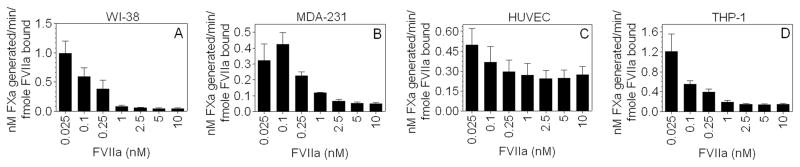
TF-FVIIa specific coagulant activity in various cell types incubated with varying concentrations of FVIIa. Coagulant specific activity of surface TF-FVIIa was calculated by the amount of FXa generated (nM/min) (obtained from Fig. 2A–D) for fmole FVIIa bound to TF (obtained from Fig. 2E–H) at varying concentrations of FVIIa added to cells. Results are presented as means ± SEM of three experiments.
Next, we estimated the approximate percentage of active and cryptic TF molecules present in the above four cell types by comparing the number of FVIIa-TF complexes formed at half-maximal concentration of FVIIa required to saturate all available TF sites at the cell surface vs. the number of FVIIa-TF complexes formed at near half-maximal concentration of FVIIa required to obtain maximum FX activation. As shown in Table 1, only 15 to 20% of the TF expressed in THP-1, MDA-231, and fibroblasts is coagulant active. These data are consistent with our earlier data where we estimated about 10 to 20% of the TF expressed in an ovarian carcinoma cell being functionally active [4].
Table 1.
Approximate percentage of coagulant-active and cryptic TF molecules on cell surfaces of various cell types
| Cell Type | Active TF (%) | Cryptic TF (%) |
|---|---|---|
| WI-38 | 17 | 83 |
| MDA-231 | 21 | 79 |
| Perturbed HUVEC | 64 | 36 |
| Perturbed THP-1 | 14 | 86 |
Percentage of active and cryptic TF molecules were calculated based on the number of FVIIa-TF complexes formed at half-maximal concentration of FVIIa required to saturate all available TF sites at the cell surface vs. the number of FVIIa-TF complexes formed at near half-maximal concentration of FVIIa required to obtain maximum FX activation
Although the above data imply that cryptic TF on the cells following its binding to FVIIa does not lead to productive FXa generation, it is not entirely clear whether cryptic TF-FVIIa complexes are completely inert in activating FX or exhibit a low, but significant, procoagulant activity. To examine this more directly, we have evaluated the effect of addition of high concentration of FVIIa (10 nM) to cells that are already treated with a concentration of FVIIa that is sufficient to saturate all coagulant active TF sites. We have chosen WI-38 and MDA-231 cells for these studies as they constitutively express abundant TF, which eliminate potential changes in TF expression levels at the cell surface throughout the experimental time period, and also allow accurate and robust quantification of TF-FVIIa complexes formed at the cell surface. As shown in Fig. 4A, TF-FVIIa activation of FX reached maximum rapidly, within 1 to 5 min, following the addition of 1 nM FVIIa to WI-38 cells, and thereafter little change in FX activation was observed. At this concentration, FVIIa binding to TF required about 15 to 30 min to reach the maximal binding. Addition of 10 nM FVIIa to cells at 60 min, when both the activity and the binding reached plateau, failed to increase the rate of factor X activation significantly (< 5%), whereas the amount of FVIIa associated with TF was increased by more than 4-fold. These data clearly indicate that cryptic TF-FVIIa complexes possess very little coagulant activity, if any. Similar data was obtained with MDA-231 cells (Fig. 4B).
Fig. 4.
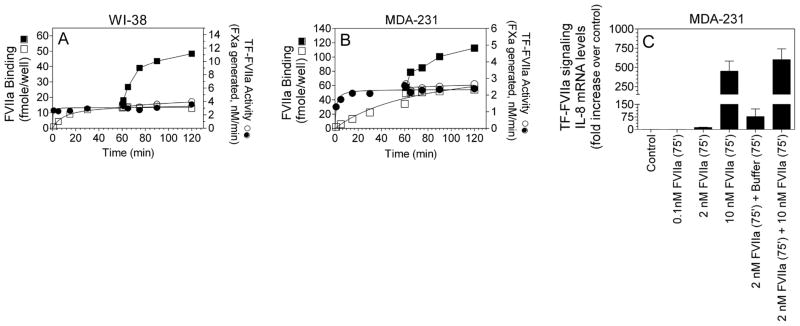
Cryptic TF on cell surfaces is coagulant inactive but fully capable of supporting cell signaling. (A) WI-38 fibroblasts cultured in 48-well plates were divided into 4 sets and all of them were incubated with 1 nM FVIIa. One set was used to determine TF-FVIIa activation of FX and second set for determining FVIIa binding to TF at varying intervals, starting at zero time. In other two sets, at the end of 60 min incubation with 1 nM FVIIa, 10 nM of additional FVIIa was added to the cells and the rate of TF-FVIIa activation of FX and the amount of FVIIa bound to the cells was determined at varying times following the addition of 10 nM FVIIa (FVIIa binding was performed in the presence and absence of TF polyclonal antibodies, 100 μg/ml, to determine TF-specific binding). Symbols are: ●,□1 nM FVIIa; ○, ■, 1 nM for 60 min, and then addition of 10 nM FVIIa at 60 min. Circles represent TF-FVIIa activation of FX; squares represent amount of FVIIa bound to TF. (B) Same as in (A) except that WI-38 cells were replaced with MDA-231 cells, 1 nM FVIIa concentration was replaced with 2 nM FVIIa. (C) MDA-231 cells were treated with varying concentrations of FVIIa for 75 min or treated first with 2 nM FVIIa for 75 min, and then with either vehicle or 10 nM FVIIa for another 75 min. Total RNA was harvested and IL-8 mRNA levels were determined by qRT-PCR.
In additional studies, we examined whether cryptic TF-FVIIa complexes are fully capable of activating PAR2-mediated cell signaling. Because TF-FVIIa binary complex signaling is robust and readily quantifiable by measuring IL-8 gene expression levels in MDA-231 cells [17], these cells were employed for evaluating the signaling activity of TF-FVIIa complexes. Addition of a low concentration of FVIIa (0.1 nM) to MDA-231 cells, which is capable of activating FX at ~ 20% of maximum attainable rate (Fig. 1), failed to produce any measurable increase in IL-8 mRNA levels. Treatment of MDA-231 cells with 2 nM of FVIIa that is capable of saturating almost all coagulant active TF sites increased IL-8 mRNA levels by about 15-fold. More importantly, treatment of MDA-231 cells with 10 nM FVIIa, which not only saturates coagulant active TF but also cryptic TF, increased IL-8 mRNA levels by more than 500-fold (Fig. 4C). In additional studies, MDA-231 cells were first incubated with 2 nM FVIIa for 75 min to saturate coagulant active TF-FVIIa complexes, and then exposed to 10 nM FVIIa to generate cryptic TF-FVIIa complexes before measuring IL-8 gene expression. Addition of 10 nM FVIIa to MDA-231 cells that were pre-exposed to 2 nM FVIIa further increased IL-8 mRNA levels markedly (Fig. 4C). These data suggest that cryptic TF-FVIIa, which is incapable of activating substrate FX, can readily activate PAR2.
Determination of cell surface TF antigen by radiolabeled TF monoclonal antibodies
We also quantified surface TF antigen by performing binding studies with TF monoclonal antibodies in all four cell types used in this study to determine whether all TF sites on the cell surface are capable of binding FVIIa and whether 10H10 TF mAb preferentially binds to cryptic TF, as previously thought [7,9]. Two different TF mAb, one believed to recognize both active and cryptic TF (9C3) and other to recognize primarily cryptic TF (10H10) [7,9], have been used for the binding studies. Data from radiolabeled TF antibody binding experiments, which were performed under identical conditions as of FVIIa binding, showed a dose-dependent increase in the antibody binding to TF. The binding curves of 9C3 and 10H10 antibodies overlapped in all cell types, and a minor difference seen in WI-38 cells was not statistically significant (Fig. 5). These data indicate that 10H10 antibody binds to both active and cryptic TF as the 9C3. Parallel binding studies performed with radiolabeled FVIIa yielded a comparable number of binding sites as of TF mAb (Table 2), which indicate all TF sites on cell surfaces are capable of forming complex with FVIIa.
Fig. 5.
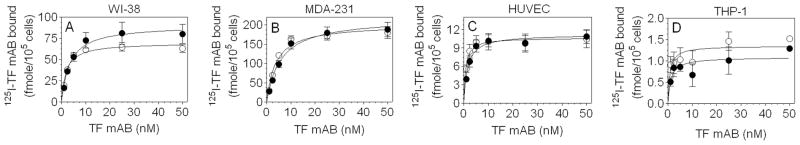
TF mAb binding to cell surface TF in various cell types. Confluent monolayers of WI-38, MDA-231, cytokine-perturbed HUVEC cultured in 48-well plates (105 cells/well) and LPS-perturbed THP-1 cells in suspension (106 cells) were incubated with varying concentrations (1– 50 nM) of radiolabeled TF monoclonal antibodies, 9C3 (○) or 10H10 (●) at room temperature for 2 h. Cells were then washed with buffer B to remove unbound radioligand and bound radioactivity was eluted by incubating cells with 100 mM glycine (pH 2.3) for 5 min. Radioactivity in eluates was then counted using a gamma counter. Results presented are means ± SEM of three experiments.
Table 2.
Number of TF molecules per cell as determined by TF mAb and FVIIa binding studies.
| Cell type | TF molecules/cell (based on 125I-TFmAb 9C3 binding) | TF molecules/cell (based on 125I-TFmAb 10H10 binding) | TF molecules/cell (based on 125I-FVIIa binding) |
|---|---|---|---|
| WI-38 | 4.2 ± 0.3 × 10⁵ | 5.47 ± 0.865 × 10⁵ | 2.703 ± 0.161 × 10⁵ |
| MDA-231 | 12.167 ± 0.902 × 10⁵ | 13.167 ± 1.255 × 10⁵ | 11.231 ± 0.776 × 10⁵ |
| Perturbed HUVEC | 6.407 ± 0.827 × 10⁴ | 6.75 ± 0.814 × 10⁴ | 4.898± 0.421 × 10⁴ |
| Perturbed THP-1 | 8.43 ± 0.57 × 10³ | 7.11 ± 0.995 × 10³ | 7.834 ± 2.7 × 10³ |
The values shown represent mean ± SEM (n=3) except TF mAb binding data of perturbed THP-1 cells (n=2).
Prothrombinase activation in different cell types
It is well known that TF-FVIIa-mediated activation of FX on cell surfaces is influenced by the presence of anionic phospholipids, particularly phosphatidylserine (PS), at the surface. Therefore, we next measured relative levels of anionic phospholipids in THP-1, HUVEC, MDA-231, and WI-38 cells in prothrombinase assay to determine whether a correlation between PS levels and TF-FVIIa coagulant activity exists in the cell types that we examined. It may be pertinent to note here that earlier studies from our laboratory showed that increased anionic phospholipids in the outer leaflet of the cell surface membrane, as demonstrated with an increase in 125I-annexin V binding to cells, led to an increase in prothrombinase activity, indicating that prothrombinase activity on cell surfaces correlate to PS content on the cell surface [10,13]. As shown in Fig. 6, the rate of prothrombin activation in various cell types was very similar except in MDA-231 cells, which showed a ~2-fold lower rate of thrombin generation compared to other cell types. It is interesting to note here that the specific activity of active TF-FVIIa complexes in MDA-231 cells was lower compared to the activity of TF-FVIIa in other cell types. Cell perturbation with cytokines and LPS did not increase thrombin generation significantly in HUVEC and THP-1 cells, respectively. A slight increase in prothrombinase activity observed in perturbed THP-1 over that observed in unstimulated cells was not statistically significant.
Fig. 6.

Prothrombinase activity in various cell types. Cell surface prothrombinase activity was determined by adding FXa (1 nM), FVa (10 nM) for 5 min, and then substrate prothrombin (1.4 μM) and measuring the amount of thrombin generated at the end of 1 min reaction period. *Denotes significant difference from unperturbed and perturbed HUVEC and perturbed THP-1 cells (P< 0.01).
TF activation increases the coagulant activity of the cryptic pool of TF
Although it is well accepted that increased levels of PS exposure following treatment with various agonists increases TF coagulant activity at the cell surface, there was no clear evidence yet on whether the activation mechanism(s) increases the activity of the cryptic TF or enhances the coagulant potential of the active TF. To answer this question, we designed an experiment where we incubated cells with either low (0.1 nM) or 10 nM FVIIa for 1 h to form either mostly active TF-FVIIa complexes or both the active and cryptic TF-FVIIa complexes at the cell surface, respectively, and then excess FVIIa was removed before activating the cells and measuring FX activation. As shown in Fig. 7, in all cell types, the fold induction in TF activity upon activation in cells incubated with 0.1 nM FVIIa was about 2 to 4-fold over the control, untreated cells. In contrast, 8 - 100-fold increase in TF activity was seen following the activation, if the cells were incubated with 10 nM FVIIa to allow formation of cryptic TF-FVIIa complexes prior to activation. These data suggest that increased TF coagulant activity following TF activation comes primarily from conversion of the cryptic TF-FVIIa to the active form and not from further increase in the activity of the active TF-FVIIa complexes. It is likely that the modest increase seen in TF activity following activation even when cells were incubated with low concentrations of FVIIa could also come from the conversion of cryptic to active TF since even at a low concentration of FVIIa still some of the FVIIa could bind to cryptic TF.
Fig. 7.
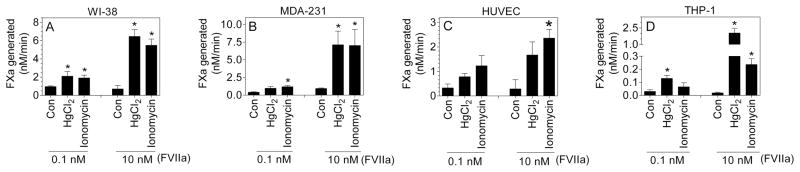
TF activation is the result of increased coagulant potential of the cryptic TF. HUVEC were stimulated with TNF-α/IL1-β, 20 ng/ml each for 6 h and THP-1 cells were perturbed with LPS, 1 μg/ml for 4 h to induce TF. All cell types were divided into two sets. One set of cells were incubated with 0.1 nM FVIIa and the other set was incubated with 10 nM FVIIa for 1 h at room temperature. Cells were then washed four times to remove unbound excess FVIIa and treated with 100 μM HgCl2 or 10 μM ionomycin for 5 min. At the end of 5 min treatment, FX (175 nM) was added to the cells and the rate of FX activation was measured. To obtain baseline cryptic TF-FVIIa activity in cells incubated with 10 nM FVIIa, TF-FVIIa activity obtained with 0.1 nM FVIIa was deducted from the value obtained with 10 nM FVIIa. “Con” denotes cells treated with a control vehicle in place of HgCl2 or Ionomycin. *Denotes significant difference compared to control in the respective group (P<0.05).
DISCUSSION
Although it was first reported many years back that TF on cells exists in a latent form and the procoagulant activity of this latent TF could be increased many-fold by various treatments [2], still basic information on how TF is maintained in the latent form at the surface, differences between the latent and coagulant active TF, and whether this phenomenon exists in all cell types is not entirely known. Largely arbitrary and descriptive functional characteristics of cryptic and procoagulant TF, lack of unique reagents that specifically recognize either cryptic or procoagulant TF, and a plethora of effects that could enhance TF activity following cell perturbation limited our efforts to perform in-depth mechanistic studies to elucidate TF encryption and decryption processes and led to few controversies in the field [18].
One of the characteristic differences between active and cryptic TF is that equilibrium binding of FVII/FVIIa to active TF is established within a minute, while binding to cryptic TF takes about 1 to 2 h to reach equilibrium [4]. Although no strict comparative studies were performed to determine FVIIa binding affinity to active and cryptic TF populations, it was found that very low concentrations of FVIIa (0.02 to 1 nM) were sufficient to achieve maximum TF-dependent activation of FX on intact cells [19–21]. In contrast to this, relatively higher concentrations of FVIIa (1 to 10 nM, or higher) were required to saturate TF sites in FVIIa binding studies, or to obtain maximal TF-FVIIa-mediated cell signaling [4,7,21–24]. Based on these data, it was postulated that one of the hallmarks of cryptic TF is, in addition to impaired activation of FX, the reduced affinity to FVIIa [9]. Thus, TF Cys186 and Cys209 disulfide mutants that had severe defect in FVIIa binding and impaired FX activation [7,11,25] were believed to mimic cryptic TF [6,7]. The data obtained in the present study, in which we determined FVIIa binding affinity to procoagulant TF and total TF in four different cell types under identical experimental conditions, in general, appear to support the above hypothesis. The data showed about 10-fold differences in FVIIa affinity to active vs. cryptic TF in THP-1 cells, WI-38 fibroblasts, and MDA-231 cancer cells. However, it is important to exercise caution in taking this difference at its face value as the real difference between them would be much smaller or none as the calculated apparent KD values will be influenced by the receptor concentration if the real KD value is lower than the concentration of receptor available on cell surfaces. Under such conditions, the apparent calculated KD values directly relate to the concentration of receptor. Here, it may be pertinent to note that some of the earlier studies using fluorescence anisotropy and surface plasmon resonance techniques reported as low as 10 to 50 pM KD values for FVIIa binding to TF [26,27]. Concentrations of TF in our cell model systems varied from ~50 pM to 1.5 nM. This could the primary reason for observed differences in calculated KD values for FVIIa binding to TF on various cell types, including both active and cryptic TF, i.e., more number of TF sites, the higher the KD. More relevant to the present discussion, our data clearly show that the KD values for FVIIa binding to cryptic TF are lower than the plasma concentration of FVII, suggesting that plasma concentration of FVII would be sufficient to form complexes not only with active TF but also with cryptic TF on cell surfaces. This reinforces our earlier concept that restricted formation of TF-FVII or TF-FVIIa complexes is not the basis for TF encryption [4,28]. If so, TF disulfide mutants that require supraphysiological concentrations of FVIIa to bind to TF [11,25] should not be viewed as mimicking cryptic TF.
In earlier studies, conflicting data was obtained on the importance of TF allsoteric Cys186-Cys209 disulfide bond exchange for regulating TF procoagulant activity by different groups [6,7,10,29]. It has been suggested that cancer cells constitutively express active TF and PDI-mediated cellular control of TF activity is deregulated in these cells [9,14]. However, data shown in the present study clearly indicate that a higher TF procoagulant activity observed in cancer cells is not the result of cancer cells predominantly expressing constitutively active TF but the consequence of high levels of TF expression in these cells. MDA-231 cancer cells expressed more than 100 times higher number of TF molecules compared to THP-1 monocytic cells. It is interesting to note that TF specific activity, as measured by the amount of FXa generated for mole TF-FVIIa complexes formed at the cell surface or for the total TF antigen on the cell surface, is actually lower in cancer cells than in THP-1 cells (Table 3). Approximate estimation of active and cryptic TF proportions in various cell types obtained by correlating the amount of FVIIa bound to TF with that of TF procoagulant activity revealed that about 80–85% of the TF exists as cryptic TF in MDA-231 cancer cells and WI-38 fibroblasts, which is very similar to that was found in THP-1 cells.
Table 3.
TF specific activity of various cell types
| Cell type | TF specific activity FXa generated nM/min/fmole TF | TF specific activity FXa generated nM/min/fmole TF-FVIIa |
|---|---|---|
| WI-38 | 0.038 ± 0.001 | 0.058 ± 0.002 |
| MDA-231 | 0.015± 0.002 | 0.016 ± 0.002 |
| Perturbed HUVEC | 0.077 ± 0.0165 | 0.101 ± 0.022 |
| Perturbed THP-1 | 0.040 ± 0.006 | 0.037 ± 0.006 |
TF specific activity was determined by normalizing FXa generated on the cell surface to TF antigen levels determined by 125I-TF monoclonal antibody binding studies or FVIIa-TF complexes formed on the cell surface obtained from 125I-FVIIa binding studies. The values shown represent the row means ± SEM (n=3).
It is generally believed that cryptic TF expresses very low procoagulant activity; and cell perturbation, such as treatment with HgCl2 or calcium ionophore, enhances TF activity by decrypting cryptic TF [8,9,28]. In the absence of specific antibodies that only binds to active TF and not the cryptic TF, it is difficult to prove the above notions convincingly. Nonetheless, the data shown in the present study provide strong support to the above concept. Addition of high concentrations of FVIIa to cells in which active TF is already saturated with a low concentration of FVIIa to yield maximum FX activation failed to increase FX activation further whereas it resulted in a marked increase in formation of TF-FVIIa complexes at the cell surface and TF-mediated cell signaling. From these data, it appears that cryptic TF is essentially inert in supporting FX activation, which is consistent with our original observation [4]. These data also suggest that cryptic TF retains its signaling function, which is consistent with earlier observations [7,21,28].
The observation that HgCl2 or ionomycin treatment increases TF procoagulant activity by many fold (8 to 100-fold) in cells when both the active and the cryptic TF were allowed to form complexes with FVIIa in comparison to the cells where the formation of TF-FVIIa complexes was restricted to active TF clearly indicates that the increased TF activity following cell perturbation primarily stems from increased TF activity of the cryptic TF-FVIIa complexes. However, as observed in the earlier studies, the fold increase in TF activity following HgCl2 or ionomycin treatment was more pronounced and robust in monocytic cells [6,11,14] compared to that was noticed with cancer cells, fibroblasts, and other cell types [10,11]. Such a difference in the fold-increase in TF activity following activation was interpreted as cancer cells being constitutively expressing active TF and thus not suitable for TF activational studies [14]. However, as discussed above, this may not be true since our present data clearly indicate that cancer cells express a similar percentage of TF in the cryptic state as in THP-1 cells. A robust increase in PS levels in THP-1 cells compared to cancer cells could explain the difference in increase in TF activity in these cells following the activation. However, measurement of prothrombin activation in these cells, before and after stimulation, did not provide convincing support for this as we observed about 3.3- and 2.7-fold increase in prothrombin activation in THP-1 cells and MDA-231 cells, respectively, following stimulation with HgCl2 (data not shown). However, a caveat exists in interpreting these data. Although prothrombinase activity on cell surfaces was found to correlate PS levels, and agonists that induce PS exposure on cell surfaces was found to increase annexin V binding, prothrombinase activity and TF coagulant activity [10,13], it is possible that a strict correlation may not exist among PS exposure, prothrombinase activity and TF-FVIIa coagulant activity since an increase in PS in the membrane at very close vicinity to TF and not other areas affect TF-FVIIa coagulant activity. Nonetheless, it is important to note that as THP-1 cells express very low levels of TF compared to MDA-231 cells, therefore, the ratio of PS: TF would be much higher in THP-1 cells compared to MDA-231 cells.
In summary, our present study of analyzing antigenic and coagulant expression of TF in four different cell types depicting different lineages demonstrate that the majority of TF in many cell types, including cancer cells, is cryptic. Although some differences between cryptic and active TF may exist in their affinity to FVIIa, but plasma concentration of FVII would be sufficient to saturate both the active and cryptic TF pools. Our data also reveal that cryptic TF does not exhibit any measurable coagulant activity and the increased TF activity associated with cell activation stems from decryption of cryptic TF rather than increasing the coagulant activity of the active TF. The present data would be helpful in removing some of the misconceptions in the field on FVIIa binding to cryptic TF and whether TF encryption is limited to specific cell types.
Acknowledgments
The authors are thankful to James H. Morrissey, University of Illinois College of Medicine, Urbana, IL for providing TF hybridomas, and Walter Kisiel, University of New Mexico School of Medicine, Albuquerque, NM for providing FVIIa, affinity purified anti-FVIIa antibodies, and prothrombin. This work was supported by National Institutes of Health grants HL107483 and HL058869 (to LVMR).
Footnotes
Disclosure of Conflict of Interest
The authors state that they have no conflict of interest.
References
- 1.Rao LVM, Pendurthi UR. Regulation of tissue factor coagulant activity on cell surfaces. J Thromb Haemost. 2012;10:2242–53. doi: 10.1111/jth.12003. [DOI] [PMC free article] [PubMed] [Google Scholar]
- 2.Maynard JR, Heckman CA, Pitlick FA, Nemerson Y. Association of tissue factor activity with the surface of cultured cells. J Clin Invest N Y. 1975;55:814–22. doi: 10.1172/JCI107992. [DOI] [PMC free article] [PubMed] [Google Scholar]
- 3.Bach R, Rifkin DB. Expression of tissue factor procoagulant activity: regulation by cytosolic calcium. Proc Natl Acad Sci U S A. 1990;87:6995–9. doi: 10.1073/pnas.87.18.6995. [DOI] [PMC free article] [PubMed] [Google Scholar]
- 4.Le DT, Rapaport SI, Rao LVM. Relations between factor VIIa binding and expression of factor VIIa/tissue factor catalytic activity on cell surfaces. J Biol Chem. 1992;267:15447–54. [PubMed] [Google Scholar]
- 5.Bach RR, Moldow CF. Mechanism of tissue factor activation on HL-60 cells. Blood. 1997;89:3270–6. [PubMed] [Google Scholar]
- 6.Chen VM, Ahamed J, Versteeg HH, Berndt MC, Ruf W, Hogg PJ. Evidence for activation of tissue factor by an allosteric disulfide bond. Biochem. 2006;45:12020–8. doi: 10.1021/bi061271a. [DOI] [PubMed] [Google Scholar]
- 7.Ahamed J, Versteeg HH, Kerver M, Chen VM, Mueller BM, Hogg PJ, Ruf W. Disulfide isomerization switches tissue factor from coagulation to cell signaling. Proc Natl Acad Sci U S A. 2006;103:13932–7. doi: 10.1073/pnas.0606411103. [DOI] [PMC free article] [PubMed] [Google Scholar]
- 8.Bach RR. Tissue factor encryption. Arterioscler Thromb Vasc Biol. 2006;26:456–61. doi: 10.1161/01.ATV.0000202656.53964.04. [DOI] [PubMed] [Google Scholar]
- 9.Versteeg HH, Ruf W. Thiol pathways in the regulation of tissue factor prothrombotic activity. Curr Opin Hematol. 2011;18:343–8. doi: 10.1097/MOH.0b013e32834981de. [DOI] [PubMed] [Google Scholar]
- 10.Pendurthi UR, Ghosh S, Mandal SK, Rao LV. Tissue factor activation: is disulfide bond switching a regulatory mechanism? Blood. 2007;110:3900–8. doi: 10.1182/blood-2007-07-101469. [DOI] [PMC free article] [PubMed] [Google Scholar]
- 11.Kothari H, Nayak RC, Rao LV, Pendurthi UR. Cystine186-cystine 209 disulfide bond is not essential for the procoagulant activity of tissue factor or for its de-encryption. Blood. 2010;115:4273–83. doi: 10.1182/blood-2009-09-241356. [DOI] [PMC free article] [PubMed] [Google Scholar]
- 12.Popescu NI, Lupu C, Lupu F. Extracellular protein disulfide isomerase regulates coagulation on endothelial cells through modulation of phosphatidylserine exposure. Blood. 2010;116:993–1001. doi: 10.1182/blood-2009-10-249607. [DOI] [PMC free article] [PubMed] [Google Scholar]
- 13.Le DT, Rapaport SI, Rao LVM. Studies of the mechanism for enhanced cell surface factor VIIa/tissue factor activation of factor X in fibroblast monolayers after their exposure to N-ethylmalemide. Thromb Haemost. 1994;72:848–55. [PubMed] [Google Scholar]
- 14.Liang HPH, Hogg PJ. Critical importance of the cell system when studying tissue factor de-encryption. Blood. 2008;112:912–3. doi: 10.1182/blood-2008-05-158766. [DOI] [PMC free article] [PubMed] [Google Scholar]
- 15.Rao LVM. Characterization of anti-tissue factor antibody and its use in immunoaffinity purification of human tissue factor. Thromb Res. 1988;51:373–84. doi: 10.1016/0049-3848(88)90373-8. [DOI] [PubMed] [Google Scholar]
- 16.Iakhiaev A, Pendurthi UR, Voigt J, Ezban M, Rao LVM. Catabolism of factor VIIa bound to tissue factor in fibroblasts in the presence and absence of tissue factor pathway inhibitor. J Biol Chem. 1999;274:36995–7003. doi: 10.1074/jbc.274.52.36995. [DOI] [PubMed] [Google Scholar]
- 17.Hjortoe GM, Petersen LC, Albrektsen T, Sorensen BB, Norby PL, Mandal SK, Pendurthi UR, Rao LV. Tissue factor-factor VIIa-specific up-regulation of IL-8 expression in MDA-MB-231 cells is mediated by PAR-2 and results in increased cell migration. Blood. 2004;103:3029–37. doi: 10.1182/blood-2003-10-3417. [DOI] [PMC free article] [PubMed] [Google Scholar]
- 18.Rao LV, Kothari H, Pendurthi UR. Tissue factor encryption and decryption: facts and controversies. Thromb Res. 2012;129 (Suppl 2):S13–S17. doi: 10.1016/j.thromres.2012.02.021. [DOI] [PMC free article] [PubMed] [Google Scholar]
- 19.Fair DS, MacDonald MJ. Cooperative interaction between factor VII and cell surface-expressed tissue factor. J Biol Chem. 1987;262:11692–8. [PubMed] [Google Scholar]
- 20.Ploplis VA, Edgington TS, Fair DS. Initiation of the extrinsic pathway of coagulation. Association of factor VIIa with a cell line expressing tissue factor. J Biol Chem. 1987;262:9503–8. [PubMed] [Google Scholar]
- 21.Petersen LC, Albrektsen T, Hjorto GM, Kjalke M, Bjorn SE, Sorensen BB. Factor VIIa/tissue factor-dependent gene regulation and pro-coagulant activity: effect of factor VIIa concentration. Thromb Haemost. 2007;98:909–11. [PubMed] [Google Scholar]
- 22.Sakai T, Lund-Hansen T, Paborsky L, Pedersen AH, Kisiel W. Binding of human factors VII and VIIa to a human bladder carcinoma cell line (J82) J Biol Chem. 1989;264:9980–8. [PubMed] [Google Scholar]
- 23.Sorensen BB, Persson E, Freskgard P-O, Kjalke M, Ezban M, Williams T, Rao LVM. Incorporation of an active site inhibitor in factor VIIa alters the affinity for tissue factor. J Biol Chem. 1997;272:11863–8. doi: 10.1074/jbc.272.18.11863. [DOI] [PubMed] [Google Scholar]
- 24.Pendurthi UR, Allen KE, Ezban M, Rao LVM. Factor VIIa and thrombin induce the expression of Cyr61 and connective tissue growth factor, extracellular matrix signaling proteins that could act as possible downstream mediators in factor VII. tissue factor-induced signal transduction. J Biol Chem. 2000;275:14632–41. doi: 10.1074/jbc.275.19.14632. [DOI] [PubMed] [Google Scholar]
- 25.Rehemtulla A, Ruf W, Edgington TS. The integrity of the cysteine 186-cysteine 209 bond of the second disulfide loop of tissue factor is required for binding of factor VII. J Biol Chem. 1991;266:10294–9. [PubMed] [Google Scholar]
- 26.Waxman E, Ross JBA, Laue TM, Guha A, Thiruvikraman SV, Lin TC, Konigsberg WH, Nemerson Y. Tissue factor and its extracellular soluble domain: The relationship between intermolecular association with factor VIIa and enzymatic activity of the complex. Biochem. 1992;31:3998–4003. doi: 10.1021/bi00131a015. [DOI] [PubMed] [Google Scholar]
- 27.Sen P, Neuenschwander PF, Pendurthi UR, Rao LV. Analysis of factor VIIa binding to relipidated tissue factor by surface plasmon resonance. Blood Coagul Fibrinolysis. 2010;21:376–9. doi: 10.1097/MBC.0b013e328333b084. [DOI] [PMC free article] [PubMed] [Google Scholar]
- 28.Rao LVM, Kothari H, Pendurthi UR. Tissue factor: Mechanisms of decryption. Front Biosci. 2012;E4:1513–27. doi: 10.2741/477. [DOI] [PMC free article] [PubMed] [Google Scholar]
- 29.Reinhardt C, von Bruhl ML, Manukyan D, Grahl L, Lorenz M, Altmann B, Dlugai S, Hess S, Konrad I, Orschiedt L, Mackman N, Ruddock L, Massberg S, Engelmann B. Protein disulfide isomerase acts as an injury response signal that enhances fibrin generation via tissue factor activation. J Clin Invest. 2008;118:1110–22. doi: 10.1172/JCI32376. [DOI] [PMC free article] [PubMed] [Google Scholar]