Figure 2.
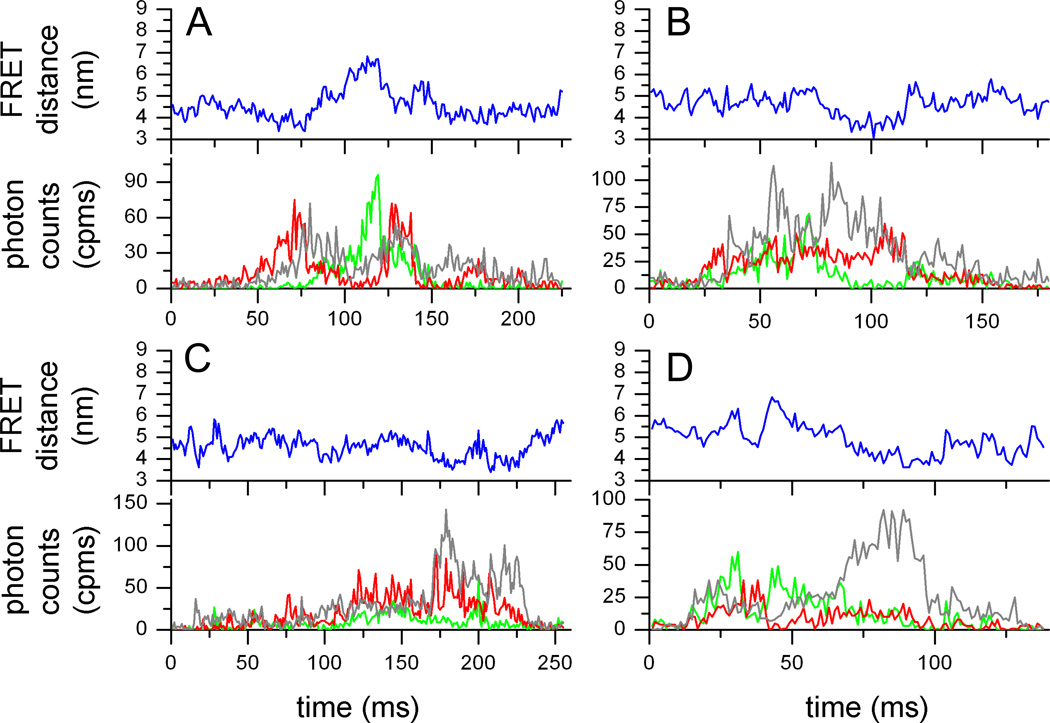
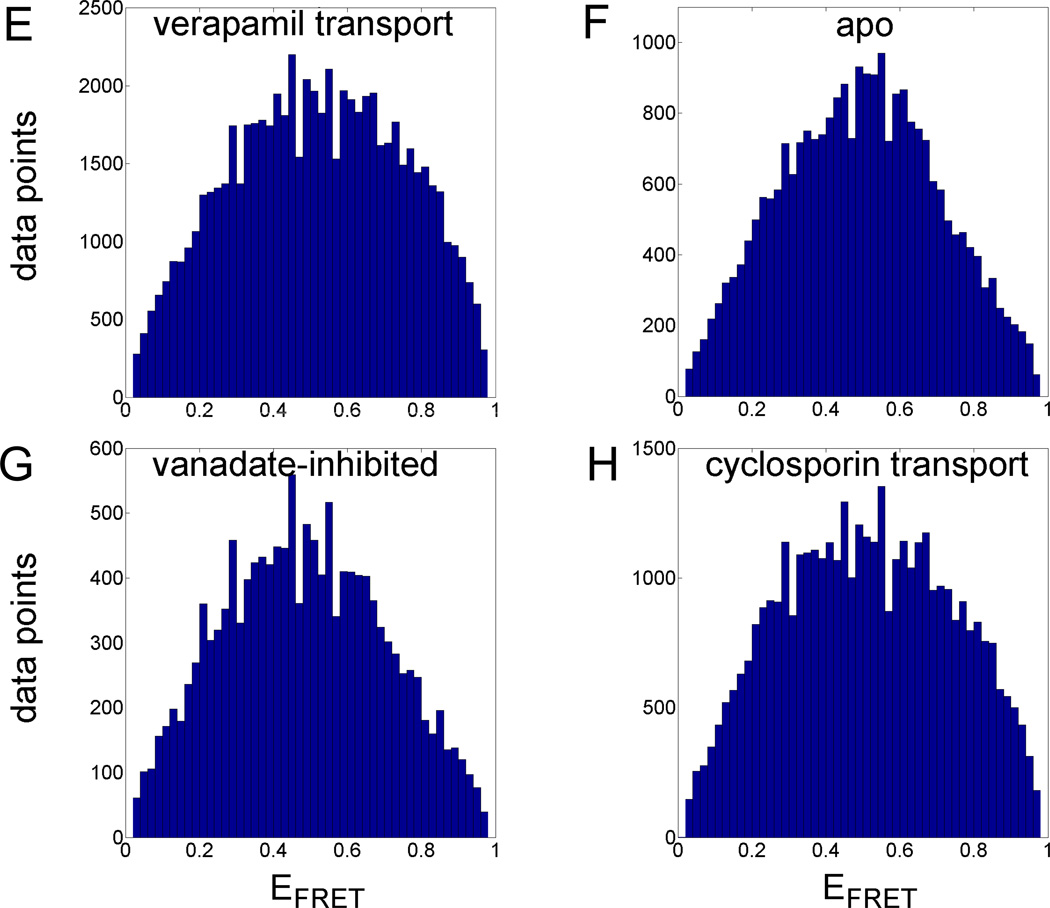
Single-molecule FRET data of Pgp. (A–D) Time trajectories of single Pgp molecules during 'cyclosporin transport'. FRET donor fluorescence (Alexa 488) excited with 488 nm is shown in the lower panels as green time traces, with 1 ms time binning. FRET acceptor fluorescence (Atto 610) is shown as red trace. Intensities are backgound and detection efficiency corrected. Direct excitation of Atto 610 with 594 nm results in fluorescence intensities shown as grey time traces. Blue traces are the fluorophore distance trajectories calculated by maximum-likelihood estimation [45]. (E–H) FRET efficiency histograms for the four biochemical conditions plotting each time bin of the photon bursts. (E) 'verapamil transport', (F) 'apo', (G) 'vanadate-inhibited', (H) 'cyclosporin transport' (see Materials and Methods).


