

Abstract
Variability in attention towards direct gaze and child-directed speech may contribute to heterogeneity of clinical presentation in toddlers with autism spectrum disorders (ASD). To evaluate this hypothesis, we clustered sixty-five 20-month-old toddlers with ASD based on their visual responses to dyadic cues for engagement, identifying three subgroups. Subsequently, we compared social, language, and adaptive functioning of these subgroups at 3 years of age. The cluster displaying limited attention to social scenes in general exhibited poor outcome at 3 years; the cluster displaying good attention to the scene and to the speaker's mouth were verbal and high functioning at 3 years. Analysis of visual responses to dyadic cues may provide a clinically meaningful approach to identifying early predictors of outcome.
Keywords: autism, eye-tracking, visual attention, heterogeneity, eye contact, child-directed speech
Phenotypic heterogeneity of autism spectrum disorder (ASD) is a well-known but poorly understood phenomenon. It is apparent in the 2nd year with social deficits spanning from extreme withdrawal to moderate difficulties in reciprocal interactions, and with verbal and nonverbal skills ranging from severe impairments to above average levels (Chawarska, Klin, Paul, Macari & Volkmar, 2009). Despite advances in early diagnosis and treatment, a considerable proportion of children with ASD make very limited progress over time, while others are likely to reach superior performance levels in selected developmental domains (Howlin, 2005; Lord et al., 2006). Factors responsible for such variable outcomes remain to be identified (Perry et al., 2011; Sherer & Schreibman, 2005). The limited ability to parse the heterogeneity of syndrome expression in its early stages hinders efforts at identification of early diagnostic markers and factors affecting amenability to treatment, as well as underlying neurobiological and genetic mechanisms.
One of the quintessential features of ASD in young children is their limited attention to faces combined with under-responsivity to speech (Chawarska et al., 2009; Nadig et al., 2007; Paul, Chawarska, Fowler, Cicchetti, & Volkmar, 2007). Typically developing newborns are equipped with perceptual mechanisms that facilitate detection of and preference for faces, particularly those that afford direct eye contact (Farroni, Csibra, Simion, & Johnson, 2002) or child-directed (CD) speech (Kisilevsky et al., 2009; Vouloumanos, Hauser, Werker, & Martin, 2010). Given infants' ability to integrate multimodal perceptual input (Bahrick, 1987; Lewkowicz, 2000), face and speech stimuli are processed in a mutually reinforcing manner. For instance, speaking faces are encoded faster and recognized more effectively than faces whose mouths move silently (Guellaï, Coulon, & Streri, 2011; Sai, 2005) and attention to lip movements enhances speech processing in very young infants (Burnham & Dodd, 2004; Teinonen, Aslin, Alku, & Csibra, 2008). Considering that learning about people is a highly experience-dependent process (Greenough, Black, & Wallace, 2002; Johnson, Grossmann, & Kadosh, 2009), individual differences in attention to socially relevant stimuli early in development are highly consequential for the development of social cognition and language.
In recent years, eye-tracking studies have offered great promise for identifying mechanisms underlying atypical social engagement in school-age children with ASD (Klin, Jones, Schultz, Volkmar, & Cohen, 2002; Norbury et al., 2009) as well as in infants and toddlers (Chawarska, Macari, & Shic, 2012; Jones, Carr, & Klin, 2008; Pierce, Conant, Hazin, Stoner, & Desmond, 2011; Shic, Bradshaw, Klin, Scassellati, & Chawarska, 2010; Young, Merin, Rogers, & Ozonoff, 2009). These studies suggest that toddlers with ASD have difficulties directing attention to socially relevant aspects of scenes, be they faces of interactive partners (Chawarska et al., 2012; Jones et al., 2008) or shared activities (Shic et al., 2010). A recent study (Chawarska et al., 2012), employing a free-viewing paradigm while presenting a complex scene of an actress engaged in several different activities, examined the conditions under which toddlers with autism show the most atypical patterns of attention. Compared to developmentally delayed and typical controls, 14- to 24-month-old toddlers with autism showed particularly atypical visual responses when the actress tried to engage the viewers' attention using eye contact and child-directed speech. In these dyadic bid conditions, toddlers with autism showed diminished attention to the scene in general, and when looking at the scene, showed pronounced deficits in monitoring the actress' face and her key facial features.
Considering that mechanisms supporting responsivity to dyadic cues for attention are present shortly after birth and are highly consequential for development of social cognition and communication, individual differences in responses to these bids in ASD may be linked to the observed heterogeneity in clinical presentation. Shifting attention to individual variability within ASD samples offers an opportunity to examine more homogeneous phenotypic subtypes which may be associated with distinct underlying neural or genetic mechanisms. The present study represents a follow-up to our earlier work (Chawarska et al., 2012) and examines variability within a group of children diagnosed with ASD (autism or Pervasive Developmental Disorder-Not Otherwise Specified [PDD-NOS]) between 14 and 24 months (N = 65). The research strategy adopted in this study involves subgrouping based on attentional responses in an eye-tracking paradigm, followed by validation of the clusters on phenotypic features intrinsic to ASD concurrently and prospectively (Cantwell & Rutter, 1994). To this end, we examine (1) whether subgroups of toddlers can be reliably identified based on their visual responses to dyadic bids for engagement in the 2nd year of life; and (2) whether the subgroups differ in levels of social impairment, verbal and nonverbal abilities, and adaptive functioning, concurrently and at 3 years of age.
Methods
Participants
Participants were 65 toddlers with ASD between the ages of 14 and 24 months of age (Visit 1) who were referred to a specialized university clinic for differential diagnosis (autism: n=50, PDD-NOS: n=15; see Table 1). Forty-eight (74%) were reassessed at 36 months (Visit 2). Eight (12%) relocated or were lost to follow-up, and nine (14%) were too young for confirmatory assessment at the time of the analysis; these children had all received a clinical best-estimate diagnosis of ASD at their 24-month visit and were kept in the sample for that reason, although they contributed no data at 36 months. The original sample of toddlers with autism (Chawarska et al., 2012) was enriched for this analysis with 11 additional toddlers with PDD-NOS. Two expert clinicians assigned best estimate diagnosis based on a review of all standardized tests as well as medical and family history (see Chawarska et al., 2009 for details). The majority of the participants were male (80%), 75% of parents declared their race as Caucasian, and 12% were Hispanic. Toddlers with gestational age below 34 weeks, non-febrile seizures, visual or auditory impairments, or known genetic abnormalities were not included in this study. An additional ten toddlers with ASD were tested but contributed insufficient data to the experiment due to technical difficulties, inattention, or negative affect, which resulted in a calibration error exceeding 1 degree of visual angle (Shic, 2008). The toddlers did not differ significantly from the retained sample in terms of age (p = .57), verbal functioning (p = .33), nonverbal functioning (p = .28), or ADOS-1 total score (p = .56).
Table 1.
Sample characterization: Means and standard deviations for measures of development, adaptive skills and autism symptoms at Visit 1 and Visit 2.
| Visit 1 N=65 | Visit 2 N=48 | P-value for visit differences | |
|---|---|---|---|
| Age (months) | 21.4 (2.9) | 36.2 (4.2) | <.001 |
| Mullen NVDQ1 | 81 (17) | 80 (22) | .93 |
| Mullen VDQ2 | 48 (25) | 78 (36) | <.001 |
| Vineland Communication | 74 (14) | 86 (16) | <.001 |
| Vineland Daily Living Skills | 78 (10) | 81 (11) | .21 |
| Vineland Socialization | 77 (7) | 79 (11) | .36 |
| ADOS-G Module 1 Total | 19.4 (4.7) | 16.6 (5.9) | .004 |
| ADOS Comparison Score | 7.3 (1.9) | 7.6 (2.0) | .61 |
NVDQ: Nonverbal developmental quotient
VDQ: Verbal developmental quotient
All parents provided informed consent in adherence to the Yale University Human Investigation Committee.
Characterization Measures
At both time points, verbal and nonverbal skills were assessed using the Mullen Scales of Early Learning (Mullen, 1995). The Mullen scales captures functioning in Fine Motor (FM), Visual Reception (VR), Receptive Language (RL), and Expressive Language (EL) domains. For the purpose of this study we calculated verbal developmental quotient (VDQ; average age equivalent in EL and RL domains/chronological age) and nonverbal DQ (NVDQ; average age equivalent in FM and VR domains/chronological age). Adaptive functioning in the areas of socialization and communication were assessed using a structured parent interview, the Vineland Adaptive Behavior Schedule (Vineland-II; Sparrow, Balla, & Cicchetti, 2005). Two scales are reported from the Vineland: Socialization and Communication (M = 100, SD = 15). Autism symptoms were quantified using the Autism Diagnostic Observation Schedule–Generic, (ADOS-G), Module 1 or 2 (Lord, Rutter, DiLavore, & Risi, 2000; Lord et al., 2012). At both visits, Module 1 was administered, although items from Module 2 in addition to Module 1 were administered at Visit 2 whenever clinically indicated. To evaluate changes in the severity of autism symptoms we converted the total ADOS-G Module 1 or 2 total algorithm scores into ADOS comparison scores (CS; Gotham, Pickles, & Lord, 2009). The ADOS CS scores range from 1 to 10 and provide a way of indicating a child's level of ASD-related symptomatology compared with that of children with ASD who are of the same chronological age and language level.
To account for intensity of intervention received in the period between visits, we calculated the average intensity of intervention collapsed across the different types of treatment received by individual children (e.g. educational, occupational, or speech and language therapy). We defined average intensity of intervention as the total number of hours of all types of intervention services received between Visit 1 and Visit 2, as reported by the parents at the second visit, divided by the time interval in weeks between the two visits.
Stimuli
The stimuli consisted of a 3-minute video of an actress filmed in a setting containing four toys and a table with ingredients for making sandwiches (Figure 1A). The experiment consisted of four conditions, with each condition presented over multiple episodes, where each episode was an instance of the behavior associated with the condition (see Chawarska et al., 2012 for details). In the Sandwich condition, the actress looked down at the table and made a sandwich; no direct gaze or speech cues were present. In the Joint Attention condition the actress looked up briefly at the camera, and then exclaimed ‘uh-oh’ as she turned toward one of the toys and remained still for 4 seconds. In the Moving Toys condition, after the actress looked up at the camera, a toy began to move and make noises; this was immediately followed by the actress turning to look at the diametrically opposed toy. Finally, in the Dyadic Bid condition the actress engaged in child-directed speech while looking directly at the camera (11 episodes, total duration 69 seconds), resembling a bid for dyadic attention. The content of the actress' speech was related to the events presented in the video and included greeting the viewer (“How are you, baby?”), complimenting (“You are so cute!”), commenting on the toys moving in a prior episode (“Did you see it? It was so much fun!”), or referring to a video the child watched just before the experiment (“Did you see the tigers?”). Considering that the main focus of the experiment was examining spontaneous attentional responses to a changing social context, the video consisted of a stream of activities with no breaks to re-center the viewer's attention, requiring the toddlers to adjust their fixation patterns depending on context, as they would in real life.
Figure 1.


(a) Single frame from the video stimulus. (b) Regions of interest (ROIs) used in analysis for the frame in Figure 1a. Labeled regions are Eyes (E), Mouth (M), Body (B), Hands Area (H), Toys (T), and Background (BG). The scene subtended 27 × 21 degrees of visual angle, the Face 3.9 × 5.6, Mouth 3.5 × 2.0, and the individual Toys 5.8 × 6.4.
Considering the aims, analysis in this paper is focused exclusively on the performance patterns in the Dyadic Bid condition, which produced the greatest differences between the autism and control groups (Cohen's d ranging from .93 to 1.2) paired with notable variability within the autism group (Chawarska et al, 2012).
Apparatus
Gaze trajectories were recorded at a sampling rate of 60Hz using a SensoMotoric Instruments IView X™ RED eye tracking system. Eye tracking data were processed using custom software written in Matlab (MathWorks, 2009). The software accommodated standard techniques for processing eye-tracking data including blink detection, data calibration, recalibration, and Region of Interest (ROI) analysis (Duchowski, 2003; Shic, 2008).
Procedure
At Time 1, we conducted the eye tracking experiment and a comprehensive behavioral evaluation including the Mullen, ADOS-G, and Vineland assessments; the behavioral assessments were repeated at Time 2, which were used in validation of clusters. In the eye tracking experiment at Time 1, toddlers were seated in a car seat in a dark and soundproof room 75cm from a 24” widescreen LCD monitor. Each session began with a cartoon video to help the child get settled. A five-point calibration procedure was then initiated with calibration points consisting of dynamic targets presented simultaneously with sound (e.g. a meowing, walking cartoon tiger). Subsequently, each participant was presented with the video described in Stimuli.
Data reduction
The visual scene was divided into several regions of interest (ROIs; Figure 1b). ROIs were dilated by 1.25 degrees on each side with no overlap between different regions to accommodate calibration error and eye-tracker noise. Dependent variables were based on the proportions of time spent examining each of the regions (i.e. the total proportion of time the participant's point of regard was located within each region) and include: (1) overall attention to the scene, %Scene, (2) proportion of attention directed towards the person, including %Face, %Eyes, %Mouth, %Hands Area, and %Eye-to-Mouth, defined as %Eyes/(%Eyes + %Mouth); and (3) attention towards distractors, %Toys. The proportion of total looking time (%Scene) was standardized by the total duration of the video display; the remaining variables with the exception of %Eye-to-Mouth were standardized by the total looking time at the scene.
Statistical analysis
Subgrouping was conducted using hierarchical clustering (HC; Hastie, Tibshirani, & Friedman, 2009) applied to the Euclidean distances between each pair of subjects using Ward's method as linkage criterion (Ward, 1963), resulting in a hierarchy of cluster partitions. HC partitions the data based on the structural relationships of the input eye-tracking measures alone, without appealing to a predetermined set of outcome labels (e.g., autism or PDD-NOS). This approach allows for discovery of groupings that may not otherwise be considered or explored. Differences between discovered clusters on variables external to the model (i.e., clinical characterization features) serve as validation for the clusters. Based on our previous work (Chawarska et al., 2012) as well as work by others (Jones et al., 2008; Klin et al., 2002; Norbury et al., 2009), we selected as inputs to HC the three variables that most succinctly captured responsivity to direct eye contact (%Eyes) and CD speech (%Eye-to-Mouth), as well as the general ability to maintain focused attention towards the scene (%Scene).
Once the cluster tree was constructed, the optimal number of clusters was chosen by the location of an “elbow” in a plot of height differences on the y-axis (analogous to the gain in explanatory power obtained by making the split) versus cluster number on the x-axis. This represents the point at which subsequent partitions of the data provide marginally little information compared to prior partitions and therefore can be disregarded (Goutte, Toft, Rostrup, Nielsen, & Hansen, 1999; Tibshirani, Walther, & Hastie, 2001).
We assessed whether the clusters represented a generalizable, robust phenomenon rather than an incidental reflection of a particular dataset using bootstrapping, a resampling method for assessing the variability of a statistical measure (Efron, 1979; Efron & Tibshirani, 1993). To create each bootstrapped sample, participants from the original dataset were sampled with replacement, approximating a sample drawn from the original population and preserving the distributions and interdependencies of measurements without actually specifying them (Efron, 1979). Cluster robustness was assessed in two ways: replication of the choice of the identified number of clusters and agreement of the cluster assignments across bootstrapped samples. To facilitate analysis of large numbers of bootstrapped samples, we automated the selection of the optimal number of clusters by fitting a simple linear regression model with cluster number as predictor variable and height difference as response variable, and selected the largest index which is identified as an outlier by Cook's distance (Cook & Weisberg, 1982) as our location for the elbow. Agreement of cluster partitions between each bootstrapped sample's clusters and the clusters based on our sample were measured using the adjusted-for-chance Adjusted Rand Index (ARI; Hubert & Arabie, 1985).
The identified clusters were compared on other aspects of eye-tracking performance and phenotypic features using mixed-effects models, with cluster as between-subject effect, visit and cluster-by-visit interaction as within-subject effects, and the average number of hours of intervention per week between visits 1 and 2 as a covariate. Post-hoc comparisons are reported with Tukey-Kramer corrections for multiple comparisons. To compare the magnitude of change in skill acquisition within each cluster we computed the repeated-measures effect size, a version of Cohen's d (Cohen, 1988) which corrects for within-subject correlation across the two visits (Morris & DeShon, 2002). Data analysis was implemented in SAS (SAS Institute Inc., 2002-2010) and R (R Development Core Team, 2011).
Results
Clustering Analysis
Cluster identification
The analysis identified three well-separated clusters of toddlers within the ASD group (Figure 2a). Analysis of height differences in the cluster tree as a function of the number of clusters shows that the three clusters have much greater explanatory power than two clusters, and partitioning the three clusters further yields only marginal gains so it was not recommended (Figure 2b). Clusters 1, 2, and 3 were comprised by 22 (34%), 20 (31%) and 23 (35%) of the toddlers with ASD, respectively. There was no gender effects, χ2(2) = .89, p = .61, or diagnosis (autism vs. PDD-NOS) effects, χ2(2) = .86, p = .65, on cluster assignment.
Figure 2.

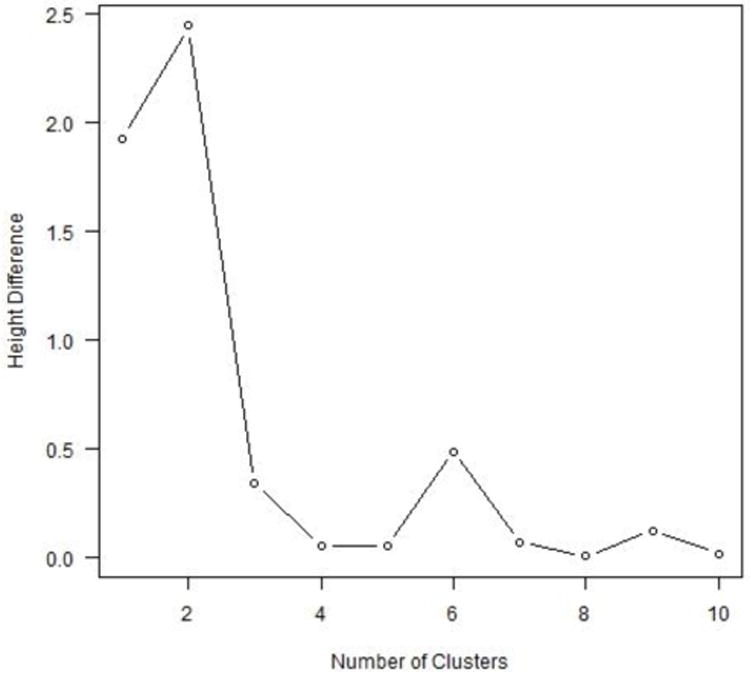
(a) Dendrogram reflecting the cluster tree based on three performance measures: proportion of time spent attending to the scene (%Scene), Eyes (%Eyes) and Eye-to-Mouth ratio. (b) Height differences in the cluster dendogram for each additional cluster added. The largest difference is made when moving from two to three clusters.
Cluster robustness
We applied hierarchical clustering with the same distance measure and linkage criterion as in our analysis above to each of 1,000 bootstrapped samples to estimate the optimal number of clusters (Figure 3a). Three clusters were chosen most commonly, by 66% of the bootstrapped samples, followed by four clusters (19%) and two clusters (11%). Subsequently, we conducted a second bootstrapping analysis that recorded the cluster assignments (out of three labels) for each bootstrapped sample. ARI values were significantly larger than would be expected under random cluster assignment (Figure 3b). The mean and standard deviation of the bootstrapped ARI's for the cluster analysis were 0.537 and 0.203, respectively. The corresponding values for random group assignment were 0 and 0.033, respectively. Cohen's d for the difference in means using a pooled standard deviation was 3.69, suggesting significant stability in cluster agreement. The results of both bootstrapping simulations indicate that the partition of the data into three clusters is robust to changes in the data and hence suggests a replicable cluster structure in the population.
Figure 3.
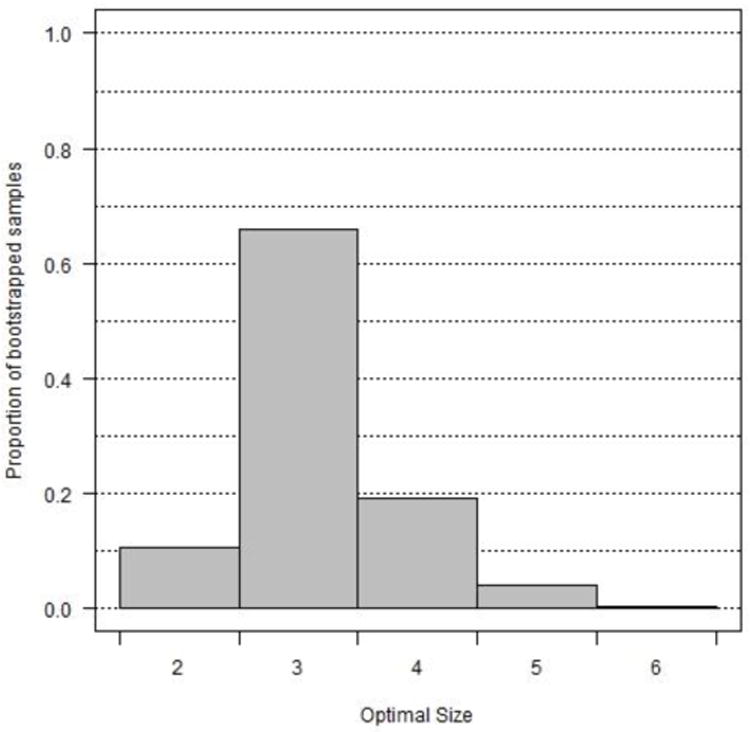
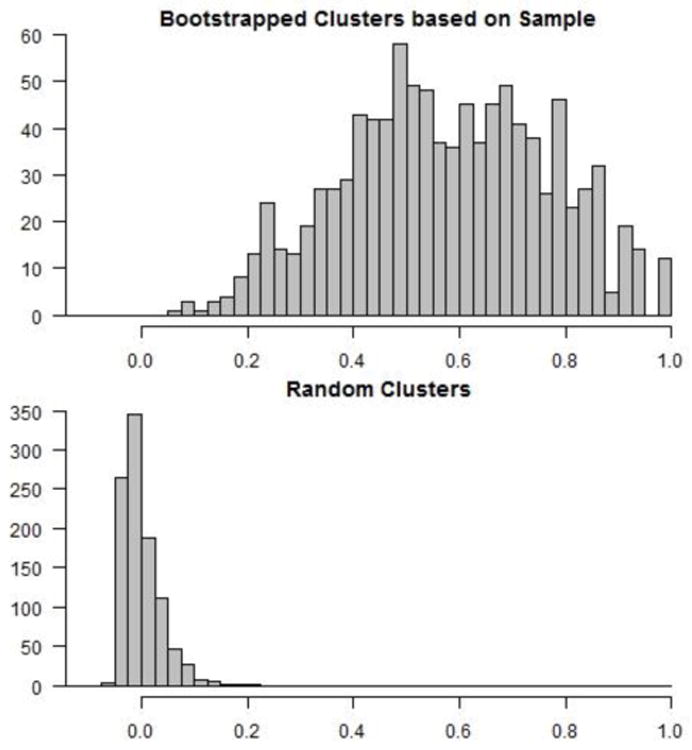
(a) Histogram of the optimal number of clusters based on 1,000 bootstrapped samples. 66% of the samples had an optimal cluster number of 3, consistent with our reported findings. (b) The top figure displays a histogram of the values of cluster consistency, as measured by the adjusted Rand index of agreement between our reported cluster partition and each bootstrapped cluster partition. The degree of cluster consistency is significantly larger than that observed from random cluster assignment, shown in the bottom figure.
Cluster characteristics
As expected, the clusters differed significantly with regard to the eye-tracking variables of %Scene, F(2,62) = 52.79, p = .0001; %Eyes, F(2,62) = 41.18, p < .001; and %Eye-to-Mouth, F(2,62) = 47.17, p < .001 (Figure 4, Table 2). Significant differences were also found for %Face, F(2,62) = 12.67, p < .001; %Mouth F(2,62) = 20.89, p < .001; and %Toys F(2,62) = 8.00, p < .001.
Figure 4.
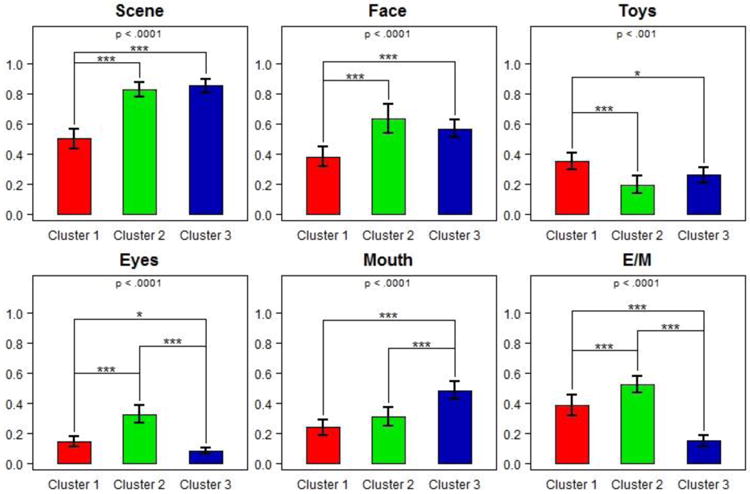
Looking time ratios for each of the indicated regions of interest by cluster group. P-values reported at the top of each plot are from ANOVA F-tests for differences in mean. E/M = eye-to-mouth ratio. Pairwise significances are indicated according to the following legend: *: p<0.05; **: p<0.01; ***: p<0.001.
Table 2.
Means and standard deviations for eye-tracking looking ratios by Cluster at Time 1. Within each row, means with different superscripts differ at least at the .01 level after correcting for multiple comparisons.
| Cluster 1 N=22 | Cluster 2 N=20 | Cluster 3 N=23 | |
|---|---|---|---|
| Scene | .50 (.15)a | .82 (.11)b | .85 (.11)b |
| Face | .38 (.15)a | .63 (.21)b | .56 (.14)b |
| Toys | .36 (.13)a | .20 (013)b | .26 (.12)b |
| Eyes | .14 (.08)a | .32 (.13)b | .08 (.05)c |
| Mouth | .24 (.12)a | .31 (.14)a | .48 (.14)b |
| E/M Ratio | .38 (.17)a | .52 (.13)b | .15 (.08)c |
Post-hoc comparisons (Figure 4, Table 2) indicated that toddlers in Cluster 1 exhibited a limited ability to attend to the scene in general compared to those in Clusters 2 (p = .001) and 3 (p = .001). When they attended to the scene, they spent less time looking at the speaker's face than toddlers in Clusters 2 (p < .001) and 3 (p = .002), and more time looking at the toys compared with Clusters 2 (p = .008) and 3 (p < .001). The time that toddlers in Cluster 1 spent looking at eyes was significantly lower than those in Cluster 2 (p = .001) and marginally higher than those in Cluster 3 (p = .064). Proportion of time looking at the mouth in Cluster 1 was comparable to that observed in Cluster 2 (p = .205), but lower than in Cluster 3 (p = .001). Although their overall attention to the faces was very limited, their eye-to-mouth ratio (M=38%, SD=17) was greater than in Cluster 3 (M=15%, SD=8; p < .001) and smaller than in Cluster 2 (M=52%, SD=13; p = .003).
Toddlers in Clusters 2 and 3 showed comparable (p = .784) attention to the scene and did not differ significantly in their looking ratios to the Face (p = .398) or Toys (p = .505). They did, however, differ in how they distributed attention to the key facial features of eyes (p = .001) and mouth (p = .001). When looking at the speaker's face, toddlers in Cluster 3 almost exclusively focused on her mouth, leading to a significantly lower Eye to Mouth ratio compared to Clusters 1 (p = .001) and 2 (p < .003). In comparison, those in Cluster 2 divided their attention to eyes and mouth almost equally.
Clinical Characteristics of the Identified Clusters
Intensity of intervention
A comparison of the average number of hours per week of intervention in the three clusters indicated no significant differences, F(2,47) = .17, p = .848. Toddlers in Clusters 1, 2, and 3 received on average 14.3 (SD=5.5), 14.3 (SD=9.2) and 13.1 (SD=6.1) hours per week of early intervention services, respectively. Nonetheless, given variability across participants in all groups, intervention was included in subsequent analyses as a covariate.
Social functioning
Analysis of the ADOS-Module1 Total scores indicated significant main effects of Cluster and Visit, no Cluster-by-Visit interaction and no effect of Intervention (see Table 3, Figure 5). Toddlers in Cluster 1 exhibited a greater degree of social-affective difficulties and repetitive behavior symptoms than those in Clusters 2 ( = .018) and 3 (p = .021). Clusters 2 and 3 did not differ (p = .976). The ADOS- Module1 total algorithm scores declined over time in all three Clusters, with Cohen's d effect sizes equal to -.25, -.28, and -.47 in Clusters 1, 2, 3, respectively (Figure 6). Despite changes in the ADOS total algorithm scores signifying progress in acquisition of elementary nonverbal social-communicative skills, there were no significant main effects or interaction with regard to the autism severity or the Vineland-II Socialization scores, suggesting that despite gains in nonverbal social-communicative skills, children in all clusters continued to exhibit challenges consistent with the diagnosis of ASD. The effect of Intervention for the Socialization score was significant (β = -.233, p = .038) suggesting that those with greater impairment in social functioning received more intensive treatment.
Table 3.
Comparisons between clusters with regard to characterization data at Time 1 and Time 2. Intensity of intervention was included as a covariate.
| Outcome measure | Factor/Covariate | F value | p-value |
|---|---|---|---|
| ADOS-G Total Score (N=65) | Cluster | 4.87 | .009 |
| Visit | 16.72 | <.001 | |
| Cluster × Visit | 1.41 | .36 | |
| Intensity of Intervention | 2.16 | .15 | |
| ADOS Comparison Score (N=65) | Cluster | 1.49 | .23 |
| Visit | 0.09 | .77 | |
| Cluster × Visit | 0.78 | .46 | |
| Intensity of Intervention | 2.32 | .13 | |
| Vineland II Socialization (N=62) | Cluster | 2.16 | .13 |
| Visit | 2.12 | .15 | |
| Cluster × Visit | 1.90 | .16 | |
| Intensity of Intervention | 4.51 | .04 | |
| Nonverbal DQ (N=64) | Cluster | 7.81 | .001 |
| Visit | 0.29 | .60 | |
| Cluster × Visit | 2.38 | .10 | |
| Intensity of Intervention | 5.22 | .03 | |
| Verbal DQ (N=64) | Cluster | 7.66 | .001 |
| Visit | 62.51 | <.001 | |
| Cluster × Visit | 4.01 | .02 | |
| Intensity of Intervention | 0.03 | .87 | |
| Vineland II Communication (N=62) | Cluster | 4.12 | .02 |
| Visit | 44.03 | <.001 | |
| Cluster × Visit | 4.37 | .02 | |
| Intensity of Intervention | 1.98 | .16 |
Figure 5.
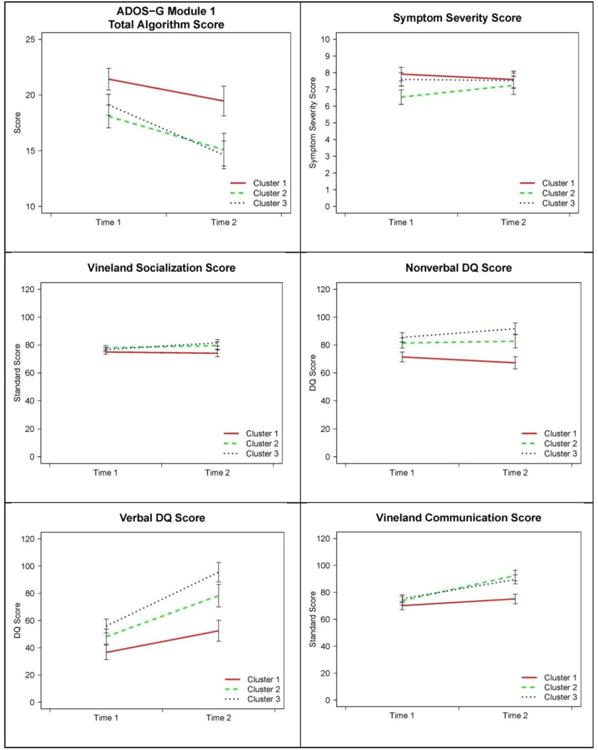
Results of mixed-effects models predicting each outcome variable using Visit, Cluster, Visit-by-Cluster interaction, and intensity of treatment between visits 1 and 2. Marginal means (+/-1 standard error) after accounting for effects of treatment intensity are plotted for each outcome variable and cluster.
Figure 6.
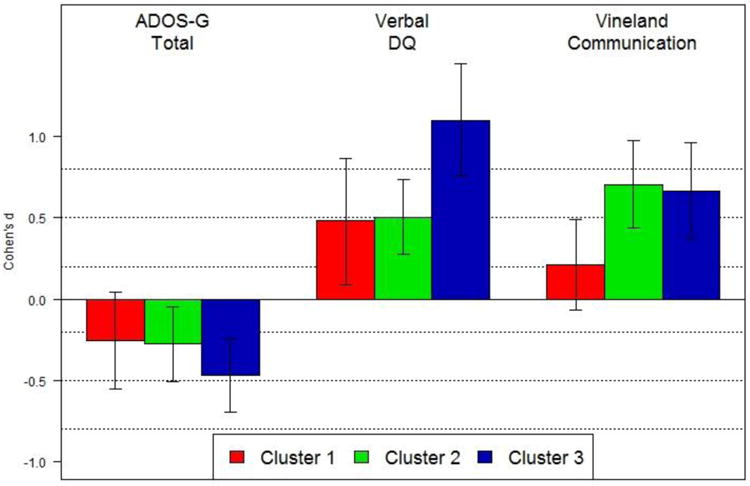
Repeated-measures Cohen's d effect sizes for the magnitude of change in each outcome variable from Visit 1 to Visit 2, performed separately on each identified cluster. All effect sizes are computed over marginal means, controlling for intensity of intervention. Vertical lines indicate 95% confidence intervals for the effect sizes.
Nonverbal functioning
Analysis of the Nonverbal DQ scores suggests significant effects for Cluster and Intervention only (β = -.546, p = .026; see Table 3, Figure 5). Cluster 1 had significantly lower NVDQ compared to Cluster 2 (p = .043) and Cluster 3 (p = .001), while Clusters 2 and 3 did not differ (p = .408). Thus, while all groups made progress over time, the differences between clusters that were present at Visit 1 continued at Visit 2. Those with more extensive delays in nonverbal functioning were more likely to receive more intensive intervention.
Verbal functioning
Analysis of the Verbal DQ scores suggested significant effects for Cluster, Visit, and Cluster-by-Visit interaction, with no significant effect of the Intervention covariate (see Table 3, Figure 5). Although mean verbal scores improved over time in all groups, after correcting for multiple comparisons, the increase in Cluster 1 was non-significant (p = .119), but it was significant in Clusters 2 (p = .001) and 3 (p = .001). Cohen's d effect sizes for change over time ranged from .48, .50, and 1.09 for Clusters 1, 2, and 3, respectively (Figure 6). As a complementary measure of adaptive communication in naturalistic settings we compared standard scores on the Communication Scale of the Vineland-II. There was a significant effect of Cluster, Visit, and Cluster-by-Visit interaction, but no effect of the Intervention covariate. The increase in adaptive communication skills in Cluster 1 was not significant (p = .643), but it was marked in Clusters 2 (p = .001) and 3 (p = .001). Cohen's d effect sizes for change over time in Communication domain ranged from .21, .70, and .66 for Clusters 1, 2, and 3, respectively (Figure 6). To test for differential rate of language versus adaptive communication skills acquisition in the three Clusters, we transformed Visit 2 VDQ and Vineland Communication scores into z-scores and computed difference scores. A series of t-tests indicated that in Clusters 1 and 2 the VDQ and Communication difference scores were not significantly different from zero, t(15) = .61, p = .548 and t(12) = -1.5, p = .158, respectively, but they were in Cluster 3, t(18) = 2.70, p = .015, suggesting that children in Cluster 3 achieved a higher level of formal language relative to the ability to use it functionally for communicative purposes.
Discussion
This study utilized eye tracking to measure visual attention in response to prototypical bids for social engagement consisting of eye contact and child-directed speech. The sample was assembled at the time of first diagnosis and included toddlers with both rapid and slow rates of progress, enhancing the generalizability of the findings to a broader population of young children with ASD. We identified three subgroups based on overall attention to the scene, to the speaker's face, and the distribution of attention between eyes and mouth. The subtypes identified in the 2nd year of life showed highly clinically relevant differences in the rates of skill acquisition between 2 and 3 years and, subsequently, behavioral presentation at the age of 3 years. The fact that the identified clusters have a predictive interpretation for individual rates of progress suggests that the use of unsupervised methods to identify toddlers at greatest risk for poor outcome from individual visual attention patterns constitutes a new and exciting avenue for future research. Although biological underpinnings of the subgroups are currently unknown, these findings support the notion that subgrouping based on visual responses to dyadic cues provides clinically and theoretically meaningful solution to parsing heterogeneity of early syndrome expression.
Approximately one-third of the toddlers (Cluster 1) had marked difficulties attending to the scene containing gaze and child-directed speech. Several hypotheses could be advanced to account for this finding. One such hypothesis is that toddlers in Cluster 1 experience heightened autonomic arousal in response to direct eye contact, triggering active avoidance (Dalton et al., 2005) exemplified by gazing away from the scene. However, when looking at the face, these toddlers monitored the eyes proportionally more than toddlers in Cluster 3. Alternatively, Cluster 1's response can be seen as consistent with limited salience of social stimuli hypothesis (Klin, Jones, Schultz, & Volkmar, 2003) expressed, for instance, as difficulty in sustaining attention to faces amongst competing internal and external stimuli (Chawarska et al., 2010). If present early in development, this deficit may have profound impacts on access to learning opportunities across domains, extending beyond social cognition and language (Chawarska, Volkmar, & Klin, 2012; Landa, Holman, & Garrett-Mayer, 2007; Paul et al., 2007; Tsao, Liu, & Kuhl, 2004) and into observational learning (Falck-Ytter, Gredeback, & von Hofsten, 2006; Shic et al., 2010).
Consistent with this hypothesis, despite the very early age at diagnosis and entry into intensive treatment programs, the rate of progress in toddlers in Cluster 1 was limited, and by the age of 3 years, they displayed the most severe delays in cognitive and language domains. We hypothesize that these toddlers may represent the ‘difficult-to-treat’ and poor outcome subgroup frequently described in the treatment literature (Eikeseth, Klintwall, Jahr, & Karlsson, 2011; Klintwall & Eikeseth, 2012; Perry et al., 2011; Sherer & Schreibman, 2005). Extant evidence is very limited with regard to predictors of outcome, as indicators in older children such as IQ cannot be measured reliably in the 2nd year of life and most toddlers with ASD at this age are largely nonverbal. Our results suggest that examination of elementary attentional processing may identify those toddlers who are at greatest risk for poor outcome in ASD at a very early point in development. Determining early predictors of limited amenability to treatment is highly consequential for designing more specialized treatments and improving our understanding of the mechanisms underlying sub-optimal outcomes in ASD.
Toddlers in Clusters 2 and 3 constituted over 60% of the sample. As a group, they exhibited very good attention to the scene and the speaker's face, comparable to that observed in typically developing and developmentally delayed children (Chawarska et al., 2012). Although these findings are encouraging, an intact ability to attend to faces does not necessarily translate into a typical mode of processing of these stimuli. For instance, while toddlers with ASD exhibited no deficits in attention to static photos of faces, they showed an impaired ability to abstract their invariant features necessary for successful recognition (Bradshaw, Shic, & Chawarska, 2011; Chawarska & Shic, 2009). Similarly, although toddlers with ASD reorient reflexively to gaze cues (Chawarska, Klin, & Volkmar, 2003), their level of attentional engagement with such cues is limited compared to non-ASD controls (Chawarska et al., 2003; Chawarska et al., 2010) and they are likely to employ different neural substrates to process them (Greene et al., 2011). Nevertheless, being able to orient to a complex social scene and to the face of the speaker was associated prospectively with gains in verbal, nonverbal, and social-communicative functioning.
Despite similarities in overall attention regulation, Clusters 2 and 3 exhibited intriguing differences in the distribution of fixations between the eyes and mouth. When looking at the face, toddlers in Cluster 3 focused almost exclusively on the speaker's mouth. This strategy combined with attention to the scene comparable to that observed in typically developing toddlers (Chawarska et al., 2012), was associated prospectively with a rapid rate of language acquisition paired with an emerging discrepancy between formal language skills and adaptive communication, a phenomenon previously described in older high-functioning individuals with autism (Klin et al., 2007). Redundant audio-visual cues contained in mouth movements accompanying speech help to disambiguate degraded speech in adults (Lansing & McConkie, 1999) and facilitate language acquisition in infancy (Lewkowicz & Hansen-Tift, 2012), and it is possible that similar mechanisms were in play in Cluster 3. In comparison, children in Cluster 2 distributed their attention between eyes and mouth equally. Their progress in language acquisition was significant but the magnitude was lower than that observed in Cluster 3. It is not clear if this pattern of scanning signifies greater sensitivity to information conveyed through eyes or limited appreciation of both cues resulting in chance-level distribution of attention between eyes and mouth. These differences between Clusters 2 and 3 perhaps provide an early manifestation in infancy of the results of a video-based eye-tracking experiment performed on adolescents with autism by Norbury and colleagues (2009), who showed that increased visual fixation time on the mouth region was positively correlated with the communication scale on the Vineland. Further experimental work will pinpoint the specific mechanisms involved in regulation of attention in response to dyadic cues amongst toddlers with ASD, and how these mechanisms affect attention regulation over time.
Although the mechanisms underlying variability of response to dyadic bids for attention are presently unknown, we hypothesize that they may be associated with disturbances occurring at different levels of social information processing. Relevance or salience of dyadic bids for attention depends not only on stimulus features (e.g., direct gaze) and characteristics of the perceptual and attentional systems that facilitate detection and prioritization of stimuli for processing, but also on the goals and expectations of the viewer. We propose that variation in responses to bids for social attention amongst toddlers with ASD originates in a differential contribution of bottom-up and top-down influences on performance. In this vein, deficits in Cluster 1 may involve the subcortical systems that detect and prioritize socially and biologically relevant stimuli for processing, while the abnormalities observed in the two remaining clusters might involve higher-level and fine-grained aspects of social stimulus processing subserved by cortical networks. This hypothesis will have to be tested directly in future studies.
Conclusion
Phenotypic heterogeneity of ASD in toddlers is expressed on multiple levels including the ability to spontaneously attend to elementary bids for social engagement. Based on a brief and non-invasive eye-tracking procedure we identified subgroups of toddlers with ASD with distinct patterns of attention towards dyadic cues for attention. These patterns were associated with clinical outcome 1-2 years later. Our analytic approach intended to uncover subgroups based on eye-tracking behavior in the context of dyadic bids for attention. The fact that these subgroups displayed clinically relevant patterns of development illustrates that responsivity to dyadic bids is potentially related to underlying mechanisms and constitutes a promising area of future inquiry into predictors of outcome in infants and toddlers with ASD and may advance our understanding of factors contributing to short- and potentially long-term outcome.
Limitations
Longer-term follow-up of the identified clusters past the age of three years will be necessary to fully appreciate the contribution of attentional patterns to overall outcome.
Acknowledgments
The study was supported by the National Alliance for Autism Research Foundation, Autism Speaks Foundation, NICHD ACE grant P50 MH081756-0, NIMH grants 1R03MH086732, and R03 MH092618-01A1. We would also like to thank Celine Saulnier, Amanda Steiner, Karyn Bailey, and Rhea Paul for their contribution to the sample characterization as well as Jessica Bradshaw, Mairin Meltvedt, Grace Chen, Marika Coffman, Alexandra Dowd, Eugenia Gisin, and Jessica Reed for assistance in data collection. We wish to express our appreciation to the families and their children for their time and participation.
References
- Bahrick LE. Infant's intermodal perception of two levels of temporal stucture in natural events. Infant Behavior and Development. 1987;10:387–416. [Google Scholar]
- Bradshaw J, Shic F, Chawarska K. Brief Report: Face-Specific Recognition Deficits in Young Children with Autism Spectrum Disorders. Journal of Autism and Developmental Disorders. 2011;41(10):1429–1435. doi: 10.1007/s10803-010-1150-4. [DOI] [PMC free article] [PubMed] [Google Scholar]
- Burnham D, Dodd B. Auditory-Visual Speech Integration by Prelinguistic Infants: Perception of an Emergent Consonant in the McGurk Effect. Developmental Psychobiology. 2004;45(4):204–220. doi: 10.1002/dev.20032. [DOI] [PubMed] [Google Scholar]
- Cantwell D, Rutter M. Classification: Conceptual issues and substantive findings. In: Rutter M, Taylor E, Hersov L, editors. Chid and Adolescent Psychiatry: Modern Approaches. Oxford: Blackwell; 1994. pp. 2–21. [Google Scholar]
- Chawarska K, Klin A, Paul R, Macari S, Volkmar F. A prospective study of toddlers with ASD: short-term diagnostic and cognitive outcomes. Journal of Child Psychology & Psychiatry & Allied Disciplines. 2009;50(10):1235–1245. doi: 10.1111/j.1469-7610.2009.02101.x. [DOI] [PMC free article] [PubMed] [Google Scholar]
- Chawarska K, Klin A, Volkmar F. Automatic Attention Cueing Through Eye Movement in 2-Year-Old Children With Autism. Child Development. 2003;74(4):1108–1122. doi: 10.1111/1467-8624.00595. [DOI] [PubMed] [Google Scholar]
- Chawarska K, Macari S, Shic F. Context modulates attention to social scenes in toddlers with autism. Journal of Child Psychology and Psychiatry. 2012;53(8):903–913. doi: 10.1111/j.1469-7610.2012.02538.x. [DOI] [PMC free article] [PubMed] [Google Scholar]
- Chawarska K, Shic F. Looking but not seeing: Atypical visual scanning and recognition of faces in 2 and 4-year-old children with autism spectrum disorder. Journal of Autism and Developmental Disorders. 2009;39(12):1663–1672. doi: 10.1007/s10803-009-0803-7. [DOI] [PMC free article] [PubMed] [Google Scholar]
- Chawarska K, Volkmar F, Klin A. Limited attentional bias for faces in toddlers with autism spectrum disorders. Archives of General Psychiatry. 2010;67(2):178–185. doi: 10.1001/archgenpsychiatry.2009.194. [DOI] [PMC free article] [PubMed] [Google Scholar]
- Cohen J. Statistical Power Analysis for the Behavioral Sciences. Hillsdale, New Jersey: Erlbaum-Drucker; 1988. [Google Scholar]
- Cook RD, Weisberg S. Residuals and Influence in Regression. London: Chapman and Hall; 1982. [Google Scholar]
- Dalton KM, Nacewicz BM, Johnstone T, Schaefer HS, Gernsbacher MA, Goldsmith H, et al. Gaze fixation and the neural circuitry of face processing in autism. Nature Neuroscience. 2005;8(4):519–526. doi: 10.1038/nn1421. [DOI] [PMC free article] [PubMed] [Google Scholar]
- Duchowski AT. Eye Tracking Methodology: Theory and Practice. New York: Springer; 2003. [Google Scholar]
- Efron B. Bootstrap methods: another look at the jackknife. The Annals of Statistics. 1979;7(1):1–26. [Google Scholar]
- Efron B, Tibshirani R. An Introduction to the Bootstrap. London: Chapman and Hall; 1993. [Google Scholar]
- Eikeseth S, Klintwall L, Jahr E, Karlsson P. Outcome for children with autism receiving early and intensive behavioral intervention in mainstream preschool and kindergarten settings. Research in Autism Spectrum Disorders. 2011;6(2):829–835. [Google Scholar]
- Falck-Ytter T, Gredeback G, von Hofsten C. Infants predict other people's action goals. Nature Neuroscience. 2006;9(7):878–879. doi: 10.1038/nn1729. [DOI] [PubMed] [Google Scholar]
- Farroni T, Csibra G, Simion F, Johnson MH. Eye contact detection in humans from birth. Proceedings of the National Academy of Sciences of the United States of America. 2002;99(14):9602–9605. [Google Scholar]
- Gotham K, Pickles A, Lord C. Standardizing ADOS Scores for a Measure of Severity in Autism Spectrum Disorders. Journal of Autism and Developmental Disorders. 2009;39(5):693–705. doi: 10.1007/s10803-008-0674-3. [DOI] [PMC free article] [PubMed] [Google Scholar]
- Goutte C, Toft P, Rostrup E, Nielsen FA, Hansen LK. On Clustering fMRI Time Series. NeuroImage. 1999;9:298–310. doi: 10.1006/nimg.1998.0391. [DOI] [PubMed] [Google Scholar]
- Greene DJ, Colich N, Iacoboni M, Zaidel E, Bookheimer SY, Dapretto M. Atypical neural networks for social orienting in autism spectrum disorders. NeuroImage. 2011;56(1):354–362. doi: 10.1016/j.neuroimage.2011.02.031. [DOI] [PMC free article] [PubMed] [Google Scholar]
- Greenough WT, Black JE, Wallace CS. Experience and brain development. In: Johnson M, Munakata Y, editors. Brain development and cognition: A reader. Malden, MA: Blackwell Publishers; 2002. pp. 186–216. [Google Scholar]
- Guellaï B, Coulon M, Streri A. The role of motion and speech in face recognition at birth. Visual Cognition. 2011;19(9):1212–1233. [Google Scholar]
- Hastie T, Tibshirani R, Friedman J. The elements of statistical learning: data mining, inference, and prediction. New York: Springer; 2009. [Google Scholar]
- Howlin P. Outcomes in Autism Spectrum Disorders. In: Volkmar FR, Paul R, Klin A, Cohen D, editors. Handbook of autism and pervasive developmental disorders, Vol 1: Diagnosis, development, neurobiology, and behavior. 3rd. Hoboken, NJ: John Wiley & Sons Inc; 2005. pp. 201–220. [Google Scholar]
- Hubert L, Arabie P. Comparing partitions. Journal of Classification. 1985;2(1):193–218. [Google Scholar]
- Johnson MH, Grossmann T, Kadosh KC. Mapping functional brain development: Building a social brain through interactive specialization. Developmental Psychology. 2009;45(1):151–159. doi: 10.1037/a0014548. [DOI] [PubMed] [Google Scholar]
- Jones W, Carr K, Klin A. Absence of preferential looking to the eyes of approaching adults predicts level of social disability in 2-year-old toddlers with autism spectrum disorder. Archives of General Psychiatry. 2008;65(8):946–954. doi: 10.1001/archpsyc.65.8.946. [DOI] [PubMed] [Google Scholar]
- Kisilevsky BS, Hains SMJ, Brown CA, Lee CT, Cowperthwaite B, Stutzman SS, et al. Fetal sensitivity to properties of maternal speech and language. Infant Behavior and Development. 2009;32(1):59–71. doi: 10.1016/j.infbeh.2008.10.002. [DOI] [PubMed] [Google Scholar]
- Klin A, Jones W, Schultz R, Volkmar F. The enactive mind, or from actions to cognition: Lessons from autism. In: Frith U, Hill E, editors. Autism: Mind and brain. New York: Oxford University Press; 2003. [DOI] [PMC free article] [PubMed] [Google Scholar]
- Klin A, Jones W, Schultz R, Volkmar F, Cohen D. Visual fixation patterns during viewing of naturalistic social situations as predictors of social competence in individuals with autism. Archives of General Psychiatry. 2002;59(9):809–816. doi: 10.1001/archpsyc.59.9.809. [DOI] [PubMed] [Google Scholar]
- Klin A, Saulnier CA, Sparrow SS, Cicchetti DV, Volkmar FR, Lord C. Social and communication abilities and disabilities in higher functioning individuals with autism spectrum disorders: The Vineland and the ADOS. Journal of Autism and Developmental Disorders. 2007;37(4):748–759. doi: 10.1007/s10803-006-0229-4. [DOI] [PubMed] [Google Scholar]
- Klintwall L, Eikeseth S. Number and controllability of reinforcers as predictors of individual outcome for children with autism receiving early and intensive behavioral intervention. Research in Autism Spectrum Disorders. 2012;6:493–499. [Google Scholar]
- Landa RJ, Holman KC, Garrett-Mayer E. Social and communication development in toddlers with early and later diagnosis of autism spectrum disorders. Archives of General Psychiatry. 2007;64(7):853–864. doi: 10.1001/archpsyc.64.7.853. [DOI] [PubMed] [Google Scholar]
- Lansing CR, McConkie GW. Attention to facial regions in segmental and prosodic visual speech perception tasks. Journal of Speech, Language, & Hearing Research. 1999;42(3):526–539. doi: 10.1044/jslhr.4203.526. [DOI] [PubMed] [Google Scholar]
- Lewkowicz DJ. The development of intersensory temporal perception: An epigenetic systems/limitations view. Psychological Bulletin. 2000;126:2281–2308. doi: 10.1037/0033-2909.126.2.281. [DOI] [PubMed] [Google Scholar]
- Lewkowicz DJ, Hansen-Tift AM. Infants deploy selective attention to the mouth of a talking face when learning speech. Proceedings of the National Academy of Sciences. 2012;109(5):1431–1436. doi: 10.1073/pnas.1114783109. [DOI] [PMC free article] [PubMed] [Google Scholar]
- Lord C, Risi S, DiLavore PS, Shulman C, Thurm A, Pickles A. Autism From 2 to 9 Years of Age. Archives of General Psychiatry. 2006;63(6):694–701. doi: 10.1001/archpsyc.63.6.694. [DOI] [PubMed] [Google Scholar]
- Lord C, Rutter M, DiLavore PC, Risi S. Autism Diagnostic Observation Schedule. Los Angeles, CA: Western Psychological Services; 2000. [Google Scholar]
- Lord C, Rutter M, DiLavore PC, Risi S, Gotham K, Bishop S. Autism Diagnostic Observation Scale-2. Torrance, CA: Western Psychological Services; 2012. [Google Scholar]
- MathWorks. MATLAB 7.8 (Release R2009a) 2009 Retrieved from http://www.mathworks.com.
- Morris SB, DeShon RP. Combining effect size estimates in meta-analysis with repeated measures and independent-groups designs. Psychological Methods. 2002;7:105–125. doi: 10.1037/1082-989x.7.1.105. [DOI] [PubMed] [Google Scholar]
- Mullen E. Mullen Scales of Early Learning AGS Edition. Circle Pines, MN: American Guidance Serivce, Inc; 1995. [Google Scholar]
- Nadig AS, Ozonoff S, Young GS, Rozga A, Sigman M, Rogers SJ. A prospective study of response to name in infants at risk for autism. Archives of Pediatrics & Adolescent Medicine. 2007;161(4):378–383. doi: 10.1001/archpedi.161.4.378. [DOI] [PubMed] [Google Scholar]
- Norbury CF, Brock J, Cragg L, Einav S, Griffiths H, Nation K. Eye-movement patterns are associated with communicative competence in autistic spectrum disorders. Journal of Child Psychology and Psychiatry. 2009;50(7):834–842. doi: 10.1111/j.1469-7610.2009.02073.x. [DOI] [PubMed] [Google Scholar]
- Paul R, Chawarska K, Fowler C, Cicchetti D, Volkmar F. “Listen my children and you shall hear”: Auditory preferences in toddlers with autism spectrum disorders. Journal of Speech, Language, and Hearing Research. 2007;50(5):1350–1364. doi: 10.1044/1092-4388(2007/094). [DOI] [PubMed] [Google Scholar]
- Perry A, Cummings A, Geier JD, Freeman NL, Hughes S, Managhan T, et al. Predictors of outcome for children receiving intensive behavioral intervention in a large, community-based program. Research in Autism Spectrum Disorders. 2011;5(1):592–603. [Google Scholar]
- Pierce K, Conant D, Hazin R, Stoner R, Desmond J. Preference for geometric patterns early in life as a risk factor for autism. Archives of General Psychiatry. 2011;68(1):101–109. doi: 10.1001/archgenpsychiatry.2010.113. [DOI] [PMC free article] [PubMed] [Google Scholar]
- R Development Core Team. R: A language and environment for statistical computing. Vienna, Austria: R Foundation for Statistical Computing; 2011. Retrieved from http://www.R-project.org. [Google Scholar]
- Sai FZ. The Role of the Mother's Voice in Developing Mother's Face Preference: Evidence for Intermodal Perception at Birth. Infant & Child Development. 2005;14(1):29–50. [Google Scholar]
- SAS institute Inc. SAS Proprietary Software 9.3. Cary, NC: 2002-2010. [Google Scholar]
- Sherer MR, Schreibman L. Individual Behavioral Profiles and Predictors of Treatment Effectiveness for Children With Autism. Journal of Consulting and Clinical Psychology. 2005;73(3):525–538. doi: 10.1037/0022-006X.73.3.525. [DOI] [PubMed] [Google Scholar]
- Shic F. Computational Methods for Eye-Tracking Analysis: Applications to Autism Computer Science. Yale University; New Haven, CT: 2008. [Google Scholar]
- Shic F, Bradshaw J, Klin A, Scassellati B, Chawarska K. Limited Activity Monitoring in Toddlers with Autism Spectrum Disorder. Brain Research. 2010;1380:246–254. doi: 10.1016/j.brainres.2010.11.074. [DOI] [PMC free article] [PubMed] [Google Scholar]
- Sparrow SS, Balla DA, Cicchetti DV. Vineland Adaptive Behavior Scales, Second Edition (Vineland-II) Circle Pines, MN: American Guidance Service; 2005. [Google Scholar]
- Teinonen T, Aslin RN, Alku P, Csibra G. Visual speech contributes to phonetic learning in 6-month-old infants. Cognition. 2008;108(3):850–855. doi: 10.1016/j.cognition.2008.05.009. [DOI] [PubMed] [Google Scholar]
- Tibshirani R, Walther G, Hastie T. Estimating the number of clusters in a dataset via the gap statistic. Journal of the Royal Statistical Society, Series B. 2001;32(2):411–423. [Google Scholar]
- Tsao FM, Liu HM, Kuhl PK. Speech Perception in Infancy Predicts Language Development in the Second Year of Life: A Longitudinal Study. Child Development. 2004;75(4):1067–1084. doi: 10.1111/j.1467-8624.2004.00726.x. [DOI] [PubMed] [Google Scholar]
- Vouloumanos A, Hauser MD, Werker JF, Martin A. The Tuning of Human Neonates' Preference for Speech. Child Development. 2010;81(2):517–527. doi: 10.1111/j.1467-8624.2009.01412.x. [DOI] [PubMed] [Google Scholar]
- Ward JH., Jr Hierarchical Grouping to Optimize an Objective Function. Journal of the American Statistical Associattion. 1963;58(301):236–244. [Google Scholar]
- Young GS, Merin N, Rogers SJ, Ozonoff S. Gaze behavior and affect at 6 months: predicting clinical outcomes and language development in typically developing infants and infants at risk for autism. Developmental Science. 2009;12(5):798–814. doi: 10.1111/j.1467-7687.2009.00833.x. [DOI] [PMC free article] [PubMed] [Google Scholar]