

Abstract
Study Objectives:
Obstructive sleep apnea (OSA) is associated with significant alterations in neuronal integrity resulting from either hypoxemia and/or sleep loss. A large body of imaging research supports reductions in gray matter volume, alterations in white matter integrity and resting state activity, and functional abnormalities in response to cognitive challenge in various brain regions in patients with OSA. In this study, we used high-density electroencephalography (hdEEG), a functional imaging tool that could potentially be used during routine clinical care, to examine the regional distribution of neural activity in a non-clinical sample of untreated men and women with moderate/severe OSA.
Design:
Sleep was recorded with 256-channel EEG in relatively healthy subjects with apnea-hypopnea index (AHI) > 10, as well as age-, sex-, and body mass index-matched controls selected from a research population initially recruited for a study on sleep and meditation.
Setting:
Sleep laboratory.
Patients or Participants: Nine subjects with AHI > 10 and nine matched controls.
Interventions:
N/A.
Measurements and Results:
Topographic analysis of hdEEG data revealed a broadband reduction in EEG power in a circumscribed region overlying the parietal cortex in OSA subjects. This parietal reduction in neural activity was present, to some extent, across all frequency bands in all stages and episodes of nonrapid eye movement sleep.
Conclusion:
This investigation suggests that regional deficits in electroencephalography (EEG) power generation may be a useful clinical marker for neural disruption in obstructive sleep apnea, and that high-density EEG may have the sensitivity to detect pathological cortical changes early in the disease process.
Citation:
Jones SG; Riedner BA; Smith RF; Ferrarelli F; Tononi G; Davidson RJ; Benca RM. Regional reductions in sleep electroencephalography power in obstructive sleep apnea: a high-density EEG study. SLEEP 2014;37(2):399-407.
Keywords: Brain imaging, EEG, neural activity, obstructive sleep apnea
INTRODUCTION
Obstructive sleep apnea (OSA) is a chronic sleep breathing disorder with an estimated prevalence ranging from 3-7% in the adult population.1 The disorder is characterized by repetitive cessations in breathing (apneas) or reductions in breath amplitude (hypopneas) resulting from changes in upper airway patency during sleep. These respiratory events and the accompanying hypoxemia result in transient arousals from sleep and sleep state fragmentation throughout the night.2 OSA is the most common disorder studied in the clinical sleep laboratory and is associated with significant adverse health outcomes, including hypertension, cardiovascular and cerebrovascular disease, and premature all-cause mortality.3,4
In addition to the many medical comorbidities associated with OSA, neurobehavioral impairments, including sleepiness, fatigue, impaired memory, poor concentration, and motor/ sensory deficits, are cardinal features of the disorder.5,6 The neural mechanisms responsible for these deficits are unclear, although research suggests that alterations in neuronal integrity resulting from either hypoxemia and/or sleep loss likely underpin many of the cognitive symptoms.7,8 Indeed, a large body of imaging research points to reductions in gray matter volume, alterations in white matter integrity, resting state activity, as well as, functional abnormalities in response to cognitive challenge, in a variety of brain areas in patients with OSA.9–20 Although studies using various imaging modalities support the notion that OSA may lead to neuronal damage, no consistent regional finding has emerged from this literature. This lack of consistency may be the result of differences in the age, disease severity, or disease duration of subjects studied. It is also conceivable that imaging technologies, particularly structural analyses, may not have sufficient sensitivity to detect subtle changes early in the disease process.
The number of polysomnographic (PSG) recordings performed each year to identify some form of sleep disordered breathing (SDB) is on the order of millions.21 In an effort to reduce diagnostic costs, many sleep studies of SDB are now conducted in the home and, as a result, do not use electroencephalographic (EEG) technology to assess sleeping neural function in patients with OSA. However, this constrained diagnostic approach may serve to limit our understanding of the effect of OSA on brain function. Although the limited EEG montages used in most sleep laboratories have done little to expand our understanding of brain function in OSA, recent technological advances have made recording with up to 256 electrodes (high-density EEG [hdEEG]) for the entire night simple and relatively inexpensive. Topographic images obtained from these sleep recordings are stable across nights and across subjects,22,23 and can provide information on regional neural function with the temporal resolution lacking in other imaging modalities. In addition, sleep imaging with hdEEG allows for the collection of spontaneous brain activity without the confounds associated with waking behavior. For example, recent studies using hdEEG have revealed unique regional distribution patterns of slow wave and spindle activity in major depression and schizophrenia, respectively,24–28 suggesting that local sleep oscillations may provide insight into the pathophysiology of these disorders.
One question in OSA research is whether the disorder, per se, is responsible for neural injury or if the comorbidities commonly associated with OSA, such as obesity, diabetes, or cardiovascular disease are more important modifiers of neurobehavioral health and neuronal integrity. In this study, we used hdEEG recordings to examine the regional distribution of neural activity in an otherwise healthy nonclinical sample of men and women with moderate/severe obstructive sleep apnea. The hdEEG sleep recordings were collected as part of a larger study that aimed to recruit healthy individuals to examine alterations in sleep related neural activity following meditation practice.
METHODS
Subjects
Subjects for this analysis were selected from a pool of 158 subjects participating in a study of sleep and meditation being conducted at the University of Wisconsin-Madison. Of these 158 participants screened in the laboratory, 20 men and women were identified as having an apnea-hypopnea index (AHI) > 10, a percentage consistent with epidemiological data.29 For this analysis, we used nine of the 20 subjects identified as having OSA along with nine healthy control subjects matched by age, sex, and body mass index (BMI) (AHI < 5) selected from the pool of 158. Reasons excluding 11 of the subjects identified as having OSA were as follows: one subject was excluded because the pulse oximeter was removed early in the sleep period, making the assessment of OSA less reliable, one was excluded because of the absence of rapid eye movement (REM) sleep, four subjects were excluded because of technical difficulties with the hdEEG, which resulted in poor quality signals, and five subjects were excluded due to a lack of a suitable control subject.
For the sleep and meditation study, subjects between the ages of 25–65 y were recruited through newspaper advertisements, email, and distribution of recruitment flyers to meditation and wellness centers. After an initial phone screening to collect medical and psychiatric history, each subject underwent a thorough in-person screening, including a general medical questionnaire and a modified version of the Sleep Disorders Questionnaire (SDQ), which included 16 questions assessing symptoms of sleep apnea and periodic limb movement disorder.30 Exclusion criteria for the meditation study included psychotropic or sleep medication use, lifetime history of bipolar disorder or schizophrenia, and any episode of major depression within the past 5 y. Subjects in whom a sleep disorder was currently diagnosed were excluded from participation. Subjects with a previously diagnosed sleep disorder were allowed to participate based on the discretion of the study physician. The subject with the highest AHI had previously undergone surgical treatment of the upper airway for OSA, but had no further treatment and was not currently symptomatic. No other subject had a previous diagnosis of sleep disorder. Subjects identified during overnight polysomnography as having a periodic limb movement arousal index > 10 were excluded from this analysis. To assess subjective sleepiness, subjects completed the Epworth Sleepiness Scale (ESS) and the Fatigue Severity Scale.31,32
All subjects provided informed consent and were instructed to maintain regular sleep-wake schedules in the week preceding EEG recordings. The study was approved by the Institutional Review Board of the University of Wisconsin-Madison.
Polysomnography
Subjects underwent in-laboratory hdEEG polysomnography (hdPSG) that used 256- channel hdEEG (Electrical Geodesics Inc., Eugene, OR), as well as standard monitoring with electro-oculogram (EOG), submental electromyogram (EMG), electrocardiogram (ECG), bilateral tibial EMG, respiratory inductance plethysmography, pulse oximetry, and a position sensor. Participants arrived at the laboratory between 20:00 and 21:00 for set-up, and were allowed to go to bed at their habitual bedtime, but not later than 24:00, and sleep undisturbed in the laboratory until 06:30. Sleep records were initially scored by a registered sleep technologist and then reviewed by a sleep medicine physician certified by the American Board of Medical Specialties. Sleep staging was performed in 30-sec epochs according to standard criteria,33 using Alice® Sleepware (Philips Respironics, Murrysville, PA) based on the six hdEEG channels at the approximate 10 to 20 locations (F3, F4, C3, C4, O1, O2) re-referenced to the mastoids.
HdEEG Recordings
HdEEG signals were sampled at 500 Hz with vertex referencing, using a NetAmps 300 amplifier and NetStation software (Electrical Geodesics Inc.). A first-order high-pass filter (0.1 Hz) was initially applied in NetStation to mimic common hardware analog filters and eliminate low frequency drift. The data were then band-pass filtered (Kaiser type, 0.3 – 50 Hz) in NetStation, before being downsampled to 128 Hz and high-pass filtered again (two-way least-squares Frequency Infinite Response Filter (FIR), 1 Hz) to remove low-frequency artifact associated with sweating. After visual inspection and removal of bad channels with high-frequency noise or interrupted contact with the scalp, the data were average-referenced to the mean voltage across all good channels using MATLAB (The MathWorks Inc., Natick, MA).
Spectral analysis was performed for each channel in 6-sec epochs (Welch's averaged modified periodogram with a Hamming window). For nonrapid eye movement (NREM) sleep data, a semiautomatic artifact rejection was conducted to remove 6-sec sleep epochs that exceeded thresholds for individual channels based on the mean power in either low (1-4 Hz) or high (20-30 Hz) frequency bands.34 EEG channels in which artifacts affected most of the recording were subsequently removed. REM sleep epochs were visually analyzed and further subdivided in tonic and phasic epochs (i.e., characterized by REM). To eliminate artifacts distinctively observed during REM sleep (i.e., muscle twitches, eye movements, heartbeats), independent component analysis (ICA) was performed.35 After removal of ICA components, power spectra of tonic and phasic REM epochs were computed. Because there was virtually no difference between the topographies in tonic and phasic REM after ICA, we report the results for both phases combined. We computed average spectral density for six frequency ranges (delta: 1–4.5 Hz; theta: 4.5–8 Hz; alpha: 8–12 Hz; sigma: 12–15 Hz; beta: 15–25 Hz; and gamma: 25-40 Hz) consistent with studies from our laboratory and others.36,37
Statistics
Differences in clinical as well as sleep architecture variables were examined using two-tailed, unpaired t-tests. Topographic differences between groups were originally assessed using electrode-to-electrode unpaired t-tests. However, as a more rigorous assessment of significance, absolute and normalized topographical power maps in NREM and REM sleep were subjected to statistical nonparametric mapping, using a supra-threshold cluster test to identify significant clusters of electrodes.38 This type of test addresses the problem of multiple comparisons and has weak distributional assumptions, making it particularly appropriate for a small sample size for which the normality of the data is difficult to assess. Briefly, after choosing an appropriate threshold t-value (for consistency a t-value threshold = 2 was chosen for all frequency ranges), topographic power maps were randomly shuffled between groups (OSA and control) in all possible combinations (n = 48,620). The size of the largest cluster above the threshold for each reshuffling was then used to create a maximal cluster size distribution. The suprathreshold cluster P value was then determined by comparison of the actual cluster size (the cluster above threshold for the real subject grouping) against the maximal cluster size distribution. To account for interindividual variability in absolute data, normalized topographic maps were created by taking the z-score across all good channels for each subject. To increase the signal-to-noise ratio, statistical analyses of topographies were restricted to channels that were not on the neck or the face (specifically, those falling within a plotting radius of 0.57 specified in the topoplot function of the EEGLAB plug-in for MATLAB), resulting in 173 channels overlying the scalp. Correlations were assessed using Spearman rank correlation. All statistical analyses were performed using MATLAB (The MathWorks Inc.).
RESULTS
Patient Characteristics
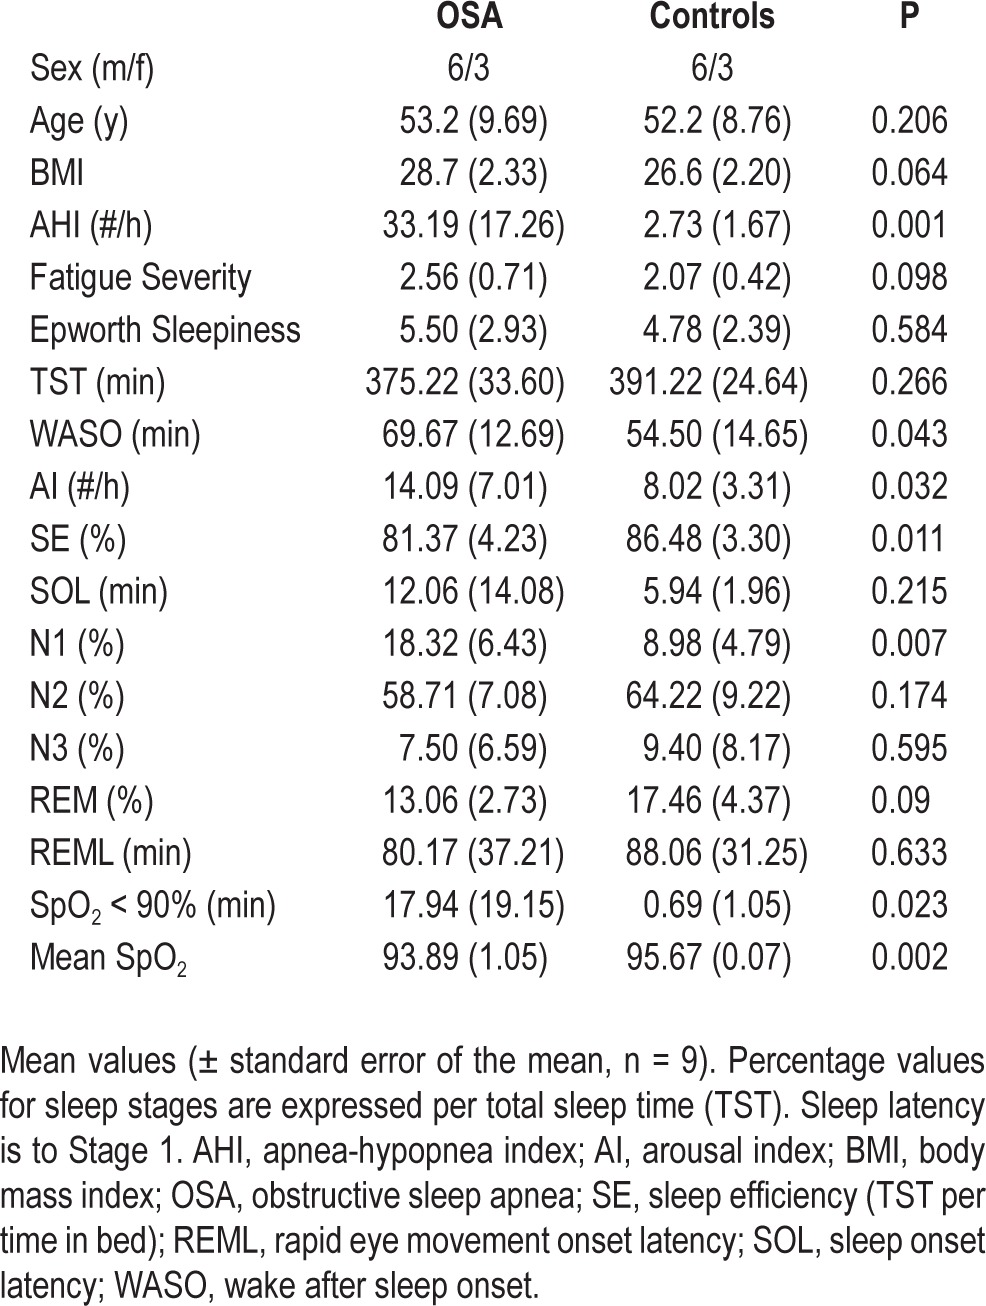
Of 158 subjects studied in the sleep laboratory, a total of nine subjects with AHI > 10 and available age and BMI-matched control subjects with AHI < 5 were used in this analysis. All results are expressed as mean ± standard deviation unless otherwise noted. The clinical characteristics of the groups are shown in Table 1. The average ages of the OSA and control groups were 53.2 ± 9.69 y and 52.2 ± 8.76 y, respectively. The age range of the OSA group was 36–66 y and the control group was 35–65 y, with no more than ± 3 y between any patient with OSA and his or her matched control. Although the BMI of the OSA group (28.7 ± 2.3) was slightly higher than that of the control group (26.6 ± 2.2), this difference did not reach statistical significance. Mean scores of subjective sleepiness, as assessed by the ESS did not differ between groups (5.50 ± 2.93; 4.78 ± 2.39, P = 0.58), and no subject scored > 10. One OSA subject was missing an ESS value. Scores on the Fatigue Severity Scale also did not differ between groups (2.56 ± 0.71; 2.07 ± 0.42, P = 0.098). Responses to the eight questions from the SDQ used to assess the likelihood of obstructive sleep apnea were significantly different between OSA subjects and controls (16.56 ± 2.83 versus 12.11 ± 3.33, P = 0.008), suggesting that OSA subjects were not totally free from symptoms of apnea. There was one experienced meditator in the OSA group, and two experienced meditators in the control group.
Table 1.
Comparison between patients with obstructive sleep apnea and control subjects on sleep and demographic measures
PSG Data
Sleep parameters derived from PSG data are summarized in Table 1. The AHI for OSA subjects was 33.19 ± 17.26 events per hour with values ranging from 12.4–59.6. Although none of the control subjects met criteria for OSA, most of the subjects in our sample population who were older than 45 y had some degree of sleep disordered breathing. The average AHI of control subjects was 2.73 ± 1.67 events per hour, ranging from 0.3–4.7. However, these breathing events had significantly less effect on oxygen saturation values in the control group compared to the OSA group. The average number of min spent with oxygen values below 90% was significantly higher in the OSA group relative to controls (17.94 ± 19.15 versus 0.69 ± 1.05; P = 0.023), and the average all-night oxygen saturation values were significantly lower in the OSA group relative to control subjects (93.89 ± 1.05 versus 95.67 ± 0.7, P = 0.002). The arousal index was higher in OSA subjects relative to controls (14.09 ± 7.01 versus 8.02 ± 3.31, P = 0.032) as was the total number of arousals (103.44 ± 48.58 versus 58.44 ± 22.79, P = 0.023). Spontaneous arousals did not differ significantly between the groups. Total sleep time was slightly shorter in OSA subjects (375.22 ± 33.60 versus 391.22 ± 24.64 min, P = 0.266), but this effect did not reach statistical significance. OSA subjects spent a larger percentage of total sleep time in stage N1 relative to controls (18.32 ± 6.43% versus 8.98 ± 4.79%; P = 0.003), and had reduced sleep efficiency (81.37 ± 4.23 versus 86.48 ± 3.30; P = 0.011). Similarly, wakefulness after sleep onset was significantly longer in OSA subjects (69.67 ± 14.69 versus 54.50 ± 14.65 min; P = 0.043). No significant differences were found between groups for the percentages of total sleep time spent in N2, N3, or REM.
In order to examine how OSA affected absolute global sleep EEG power, we compared the EEG spectral profile of OSA subjects compared to their matched controls in both NREM and REM sleep. Although OSA subjects tended to exhibit slightly more beta/gamma activity (> 15 Hz) when averaged across channels, no frequency bins were found to be significantly different for either NREM sleep (uncorrected P > 0.08) or REM sleep (uncorrected P > 0.22, Figure 1). In addition, no signifi-cant absolute global EEG power differences were found when each NREM stage (N1, N2, N3) was compared independently (data not shown).
Figure 1.
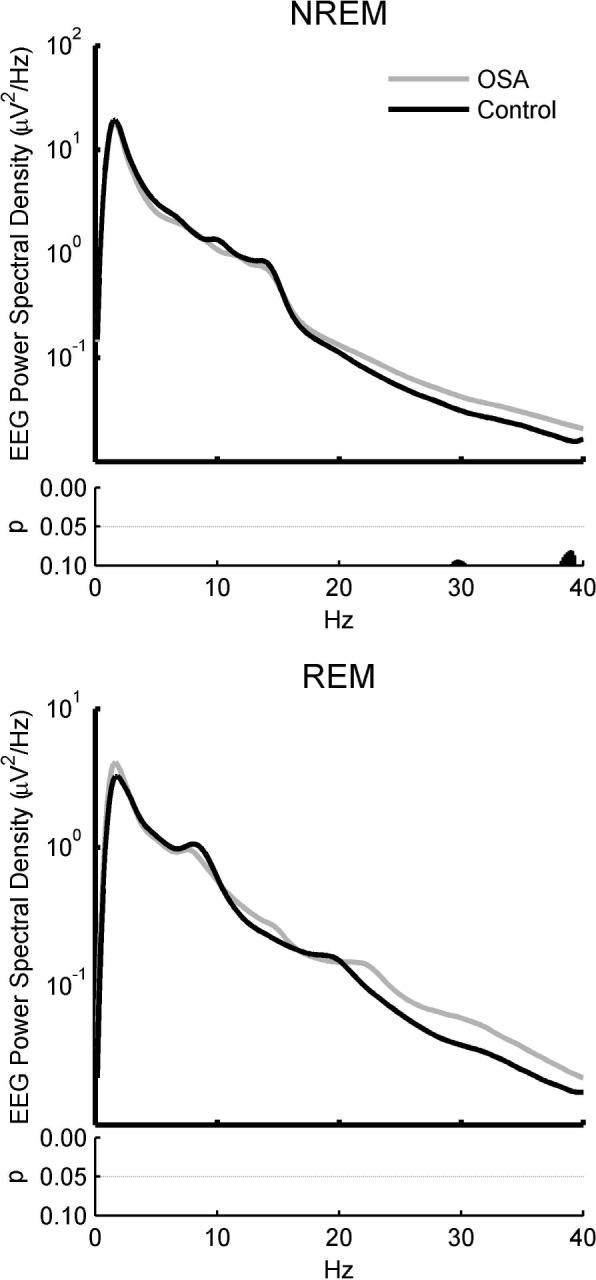
Spectral analysis of absolute global electroencephalographic (EEG) power for obstructive sleep apnea (OSA) and control subjects in nonrapid eye movement (NREM) and rapid eye movement (REM) sleep shows no significant differences between groups despite an average increase in higher frequencies. Spectral density plots for the global average across all electrodes in NREM (upper) and REM (lower) sleep. Uncorrected P values for the comparison between OSA (black) and control (gray) subjects are shown below each plot, respectively. Note despite the apparent increase in higher frequency activity in OSA relative to control subjects, there is no significant differences using two-tailed t-tests even uncorrected for multiple comparisons.
OSA-Related Regional Reductions in Sleep EEG Power During Sleep
We next examined the topographical distribution of absolute EEG power of specific frequency bands of interest (slow-wave activity (SWA), Theta, Alpha, Beta, Sigma and Gamma). OSA and control groups both had topographies similar to those previously reported for NREM sleep in normal subjects (Figure 2, EEG Topography). Visual examination of the absolute power comparisons between groups suggested that the OSA group seemed to have a regionally specific broadband reduction in EEG power in a posterior region of the brain (Figure 2, T-values, Absolute), with the same posterior region consistently decreased in OSA subjects relative to controls regardless of frequency band. Statistical nonparametric mapping failed to discover any significantly different electrode clusters between groups in the absolute comparison. However, after spatially normalizing each subject's topography within the frequency bands of interest as a means to reduce between-subject variance and examine relative topography, the statistical significance of the posterior difference between groups became apparent. A cluster of posterior electrodes (N = cluster size) adjacent to Pz were significantly decreased in normalized SWA (N = 15, P = 0.0477; Figure 2, Normalized). These results did not appear to be driven by a difference in variability between groups, as a comparison of average values across the significant cluster for the individuals within each group revealed similar distributions (Figure S1, supplemental material).
Figure 2.

Topographical analysis of nonrapid eye movement (NREM) sleep electroencephalography (EEG) for obstructive sleep apnea (OSA) and control subjects reveals a parietal decrease in EEG power. Rows represent frequency bands of interest as indicated: SWA (1-4.5 Hz), Theta (4.5-8 Hz), Alpha (8-12 Hz), Sigma (12-15 Hz), Beta (15-25 Hz), Gamma (25-40 Hz). First column: Average NREM sleep EEG topographies across frequency bands for OSA subjects. Second column: Scaled the same as OSA subjects, topographical averages for healthy control matches during NREM sleep. Third column: Map showing the individual electrode t-value (two-tailed, unpaired) maps for the comparison between OSA and control subjects in terms of absolute power. Blue values represent a decrease in absolute EEG power in OSA subjects relative to controls (OSA < control) and red values represent an increase (OSA > control). Fourth column: Same as third column except that each subject was spatially normalized using the z-score across electrodes before creating the t-value comparison. White dots indicate channels that belong to a statistically significant cluster of electrodes (P ≤ 0.05) using statistical nonparametric mapping suprathreshold cluster testing. Black dots indicate channels with P ≤ 0.05 (uncorrected).
We next examined the normalized data to determine whether a particular stage of sleep or cycle of sleep was responsible for the posterior reduction in EEG power, and whether SWA was the only frequency to show a statistically significant difference (Figure 3). Once again, the posterior reduction of sleep EEG power in OSA subjects was apparent across all stages of sleep and all frequency bands. Electrode clusters (N = cluster size) were significantly reduced in stage N3 in the gamma band (N = 25, P = 0.0296) and trends in SWA (N1, N = 15, P = 0.0561; N2, N = 14, P = 0.0602) and Alpha (N = 22, P = 0.0558), in OSA subjects as shown in Figure 3. Across NREM cycles the posterior reduction in normalized power was also apparent, most prominently in cycle 3 for SWA (N = 33, P = 0.0034) and Alpha (N = 22, P = 0.0487), as well as trending toward significance in cycle 2 for SWA (N = 14, P = 0.0552) and Gamma bands (N = 15, P = 0.0748). Although no electrode clusters were significantly different in REM sleep, the posterior reduction was still visible, notably in the higher frequency bands (Figure S2, supplemental material).
Figure 3.

Breakdown of normalized comparison maps between patients with obstructive sleep apnea (OSA) and control subjects for nonrapid eye movement (NREM) sleep stages and periods. Rows represent frequency bands of interest as in Figure 2. Left columns: T-value comparisons between electroencephalographic (EEG) power topographies for OSA subjects and healthy controls after spatial normalization during sleep stage N1, N2, and N3, respectively. Right columns: Same as left columns except for comparisons are for NREM during the first three NREM periods. All topographies are on the same scale. Blue indicates OSA < control and red indicates OSA > control. White dots are significant using the statistical nonparametric mapping suprathreshold cluster test (P ≤ 0.05), gray dots indicate a trend cluster (P ≤ 0.08), and black dots indicate individual channels with P ≤ 0.05 (uncorrected).
Exploratory Correlations
Based on this unexpected finding, we performed an exploratory analysis to determine whether the posterior decrease in EEG power correlated with either OSA severity (AHI, saturation of oxygen (SpO2) minimum, number of minutes below 90% SpO2) or arousal index. To do so, we correlated the average normalized SWA during NREM across the cluster of 15 significant electrodes (Figure 2) with each variable using the nonparametric Spearman rank-order correlation. When the OSA and control groups were considered together, we identified a negative correlation between regional SWA power and AHI (ρ = -0.59, P = 0.01), number of minutes below 90% SpO2 (ρ = -0.60, P = 0.011), as well as arousal index (ρ = -0.52, P = 0.025) (Figure S3, supplemental material). However, when correlations were performed on each of the groups individually, no correlations were significant (P > .05). These results were similar regardless of the significant cluster used to define the EEG power reduction (data not shown).
DISCUSSION
In this study, we used hdEEG topography to examine regional neural activity patterns during sleep in a group of men and women with moderate to severe OSA. This middle-aged, non-clinical sample of subjects was selected from a larger set of participants involved in a study of sleep related neural plasticity following mediation practice. These subjects were not selected for participation based on their OSA and were therefore largely free of many of the comorbidities often associated with OSA, including sleepiness, obesity, diabetes, hypertension, cerebrovascular disease, and psychiatric illness. Despite the fact that OSA severity in our population ranged from moderate to severe, alterations in sleep architecture were minimal and included a significant reduction of N1, increased waking after sleep onset, increased arousal index, and reduced sleep efficiency in the OSA group. These sleep architecture alterations are consistent with previous studies of OSA in nonclinical samples.39
The most intriguing finding in the current analysis was the identification of a circumscribed power reduction overlying the parietal cortex in OSA subjects. This parietal reduction in neural activity was significant most notably in SWA during NREM sleep. However, to some extent, the posterior power reduction was visible on topographic displays across all frequency bands during NREM and REM sleep. It is possible that the regional power reduction we identified in our OSA population is a consequence of acute sleep fragmentation. One argument against this, however, is that although OSA subjects generated on average more absolute high-frequency power globally relative to control subjects (Figure 1 and Figure 2 [Column 3, Absolute]), perhaps indicative of more waking during sleep, they still showed a deficit in the ability to generate high-frequency activity still in this circumscribed area of parietal cortex. Moreover, in a subset of subjects taken from this same study who were found to have increased periodic limb movements during sleep, the extent of sleep fragmentation, quantified by arousal index, was similar to that of this OSA group. Unlike the OSA group, however, the distribution of neural activity during sleep in the subjects with periodic limb movement did not show a distinct regional abnormality.40 Our research group has also conducted other hdEEG studies in clinical populations, including subjects with primary insomnia, and have not identified a similar pattern of regional alterations in neural function. However, a recent hdEEG analysis of sleep in major depressive disorder demonstrated that hypersomnolent depressed subjects, relative to those without hypersomnolence, experienced a reduction in absolute EEG SWA power over a similar parietal region.41 The observed reduction in regional power between these two groups of depressed subjects did not seem to be related to acute sleep fragmentation because the two groups did not differ on any sleep architecture variables during the hdEEG laboratory recording, including arousal index. Finally, because our correlational analyses indicated that AHI, number of min below SpO2 90% and arousal index were all negatively correlated with the regional reduction in EEG power, it is impossible to determine whether sleep fragmentation or some measure of disease severity is related to this functional deficit; a larger sample size may help to clarify this relationship.
An alternative possibility is that this region of altered functional activity may be related to the chronic effects of OSA. Support for neural injury in OSA, including injury to the parietal cortex, is supported by both structural and functional neuroimaging data.9,10,17,18 Morphometric scans in OSA subjects have identified diffuse reductions in gray matter volume across the brain, including in hippocampus and cerebellum, cingulate and insular cortices, mammillary bodies, and frontal, temporal and parietal cortices,12,15,19,42,43 suggestive of neuronal loss in these regions. Interestingly, treatment with continuous positive airway pressure was recently shown to reverse gray matter loss in hippocampal and frontal cortices, but not in parietal cortex.42 Diffusion tensor imaging (DTI) studies have also identified widespread regions of axonal injury.11,13,14 A recent DTI study in an OSA population similar to ours revealed a large area of significant reduction in mean diffusivity localized to the posterior portion of the corona, a fiber bundle projecting broadly to the posterior cerebral cortex.11 Functional MRI analyses have highlighted regional alterations in task-related brain activation in OSA subjects.44 Patients with severe apnea were shown to have reduced prefrontal and parietal cortex activation during tasks of working memory.45 Interestingly, however, subjects with more significant hypoxemia showed less activation in the parietal cortex only when compared with their nonhypoxemic counterparts, suggesting that the parietal cortex may be particularly sensitive to the chronic effect of hypoxemia.45
Although we have not analyzed waking EEG data in our population, several analyses of waking neural function using low-resolution electromagnetic tomography and quantitative electroencephalography also support alterations in neural function in posterior regions of the cortex. Interestingly, Toth and colleagues detected increased waking EEG alpha activity bilaterally in the posterior cingulate cortex in OSA subjects relative to controls in the evening, whereas Lee et al. found decreased alpha activity in the right posterior cingulate during the morning after sleep.46–47,48 Although the functional significance of these changes during waking, particularly during the day, or their relationship to sleep related neural activity is unclear, both studies highlight patterns of altered neural activity in a brain region that overlaps significantly with our identified region.
Hypoxemia is undoubtedly one path to neural injury in OSA. However, although speculative, posterior regions of the cortex may also be uniquely sensitive to the effects of chronic sleep disruption. As part of the default mode network, some regions of the posterior parietal cortex, including the posterior cingulated, are distinguished by reliance on elevated aerobic glycolysis for glucose utilization.49,50 Intriguingly, regions with elevated levels of aerobic glycolysis have recently been demonstrated to be uniquely vulnerable to the accumulation of amyloid-β deposition, the pathological hallmark Alzheimer disease.47 In the adult human brain, aerobic glycolysis is elevated nearly twofold during waking and returns to baseline levels after a night of sleep.51 It is conceivable that the elevated neuronal activation associated with apneic arousals may render the parietal cortex incapable of clearing the by-products of chronic activation, leading to cellular injury or deficits in synaptic function. However, given our sample size, and given that both disease severity variables as well as sleep architecture variables were related to the regional reduction in EEG power only when both OSA and control groups were combined, it is impossible to confidently speculate about causal mechanisms.
There are strengths and limitations of this study that merit discussion and affect the interpretation of our results. A central strength of this study includes the use of hdEEG, which allows for a regional analysis of neural activity and which is not possible with traditional PSG studies. In addition, our analyses were conducted in a medically healthy population of OSA subjects, so that our results are not confounded by factors common to OSA such as obesity and/or hypertension. Given that our subjects were drawn post hoc from a larger study on sleep and meditation, it is possible that this group of subjects is not representative of the population of nonclinical OSA subjects. Importantly, the sample size used in this analysis was small. One major limitation of small studies is that they can produce false-positive results or overestimate the magnitude of effects. However, this concern was mitigated through the use of non-parametric statistical methods, which make few assumptions about the distribution of the data and are more robust to outliers. In addition, variability between individual subjects was similarly distributed within each group, indicating that the reduction in regional activity was not driven by a single subject. Still, the small sample size may have contributed to our inability to establish relationships between measures of OSA severity and/or sleep architecture and our region of hypoactivity.
The current investigation suggests that regional deficits in EEG power generation may be a useful clinical marker for neural disruption in OSA. Additional adequately powered, prospective research that more rigorously examines this hdEEG finding in patients with OSA of varying ages and degrees of disease severity may aid in the identification of patients at greater risk for poor outcomes. In addition, in future studies, it will be important to examine the relationship between hdEEG findings and neurobehavioral measures to understand the relationship between brain integrity, cognition, and, ultimately, response to treatment. Although more work is required to understand the extent and significance of this functional alteration in neural activity in OSA, characterizing the association between brain integrity changes and disease severity may serve as an important prognostic tool and help to guide treatment decisions for this common disorder.
DISCLOSURE STATEMENT
This was not an industry supported study. Funding source for this study was The National Center for Complementary and Alternative Medicine (NCAAM). Dr. Tononi serves as a consultant for Philips-Respironics. The other authors have indicated no financial conflicts of interest.
ACKNOWLEDGMENTS
Drs. Jones and Riedner contributed equally to this work. The authors gratefully acknowledge the contributions of the following individuals, who assisted in subject recruitment, data collection and analysis: David Bachhuber, Daniela Dentico, Corinna Zennig, Jeffrey Guokas, Timothy Wanger, and Antoine Lutz.
SUPPLEMENTAL MATERIAL
Scatterplots of average power density across a region of interest for individual subjects. The region of interest (ROI) is defined as the cluster of 15 electrodes significantly reduced in obstructive sleep apnea (OSA) subjects relative to controls in normalized nonrapid eye movement (NREM) power density (see Figure 2). Rows represent frequency bands of interest as indicated: SWA (1-4.5 Hz), Theta (4.5-8 Hz), Alpha (8-12 Hz), Sigma (12-15 Hz), Beta (15-25 Hz), and Gamma (25-40 Hz). First column: Absolute power density. Second column: Normalized power density. OSA subjects are shown in red and control subjects in black. The colored vertical line for each row of dots represents the average for each group respectively.
Topographical analysis of rapid eye movement (REM) sleep electroencephalography (EEG) shows an apparent parietal decrease in power for obstructive sleep apnea (OSA) subjects relative to controls despite lack of significance. Rows represent frequency bands of interest as indicated: SWA (1-4.5 Hz), Theta (4.5-8 Hz), Alpha (8-12 Hz), Sigma (12-15 Hz), Beta (15-25 Hz), and Gamma (25-40 Hz). First column: Average REM sleep EEG topographies across frequency bands for OSA subjects. Second column: Scaled the same as for OSA subjects, topographical averages for healthy control matches during REM sleep. Third column: Map showing the individual electrode t-value (two-tailed, unpaired) maps for the comparison between OSA and control subjects in terms of absolute power. Blue values represent a decrease in absolute EEG power in OSA subjects relative to controls (OSA < control) and red represents an increase (OSA > control). Fourth column: Same as third column except that each subject was spatially normalized using the z-score across electrodes before creating the t-value comparison. Black dots indicate individual channels with P ≤ 0.05 (uncorrected).
Scatterplots and correlations between SWA in the parietal cluster, obstructive sleep apnea (OSA) severity, and arousal index. SWA region of interest (ROI) is defined as the average normalized SWA in the cluster significantly reduced in OSA subject relative to controls during nonrapid eye movement (NREM) sleep (see Figure 2). Dotted line on each plot indicates the least-squares line after data had been rank transformed. OSA subjects are shown in red and control subjects in black.
REFERENCES
- 1.Punjabi NM. The epidemiology of adult obstructive sleep apnea. Proc Am Thorac Soc. 2008;5:136–43. doi: 10.1513/pats.200709-155MG. [DOI] [PMC free article] [PubMed] [Google Scholar]
- 2.Dempsey JA, Veasey SC, Morgan BJ, O'Donnell CP. Pathophysiology of sleep apnea. Physiol Rev. 2010;90:47–112. doi: 10.1152/physrev.00043.2008. [DOI] [PMC free article] [PubMed] [Google Scholar]
- 3.Lavie L, Polotsky V. Cardiovascular Aspects in Obstructive Sleep Apnea Syndrome - Molecular Issues, Hypoxia and Cytokine Profiles. Respiration. 2009;78:361–70. doi: 10.1159/000243552. [DOI] [PubMed] [Google Scholar]
- 4.Young T, Palta M, Dempsey J, Peppard PE, Nieto FJ, Hla KM. Burden of sleep apnea: rationale, design, and major findings of the Wisconsin Sleep Cohort study. Wmj. 2009;108:246–9. [PMC free article] [PubMed] [Google Scholar]
- 5.Antic NA, Catcheside P, Buchan C, et al. The effect of CPAP in normalizing daytime sleepiness, quality of life, and neurocognitive function in patients with moderate to severe OSA. Sleep. 2011;34:111–9. doi: 10.1093/sleep/34.1.111. [DOI] [PMC free article] [PubMed] [Google Scholar]
- 6.Kielb SA, Ancoli-Israel S, Rebok GW, Spira AP. Cognition in obstructive sleep apnea-hypopnea syndrome (OSAS): current clinical knowledge and the impact of treatment. Neuromolecular Med. 2012;14:180–93. doi: 10.1007/s12017-012-8182-1. [DOI] [PMC free article] [PubMed] [Google Scholar]
- 7.Tsai JC. Neurological and neurobehavioral sequelae of obstructive sleep apnea. NeuroRehabilitation. 2010;26:85–94. doi: 10.3233/NRE-2010-0538. [DOI] [PubMed] [Google Scholar]
- 8.Li Y, Veasey SC. Neurobiology and neuropathophysiology of obstructive sleep apnea. Neuromolecular Med. 2012;14:168–79. doi: 10.1007/s12017-011-8165-7. [DOI] [PubMed] [Google Scholar]
- 9.Kamba M, Inoue Y, Higami S, Suto Y. Age-related changes in cerebral lactate metabolism in sleep-disordered breathing. Neurobiol Aging. 2003;24:753–60. doi: 10.1016/s0197-4580(02)00191-4. [DOI] [PubMed] [Google Scholar]
- 10.Kamba M, Inoue Y, Higami S, Suto Y, Ogawa T, Chen W. Cerebral metabolic impairment in patients with obstructive sleep apnoea: an independent association of obstructive sleep apnoea with white matter change. J Neurol Neurosurg Psychiatry. 2001;71:334–9. doi: 10.1136/jnnp.71.3.334. [DOI] [PMC free article] [PubMed] [Google Scholar]
- 11.Kumar R, Chavez AS, Macey PM, Woo MA, Yan-Go FL, Harper RM. Altered global and regional brain mean diffusivity in patients with obstructive sleep apnea. J Neurosci Res. 2012;90:2043–52. doi: 10.1002/jnr.23083. [DOI] [PMC free article] [PubMed] [Google Scholar]
- 12.Macey PM, Henderson LA, Macey KE, et al. Brain morphology associated with obstructive sleep apnea. Am J Respir Crit Care Med. 2002;166:1382–7. doi: 10.1164/rccm.200201-050OC. [DOI] [PubMed] [Google Scholar]
- 13.Macey PM, Kumar R, Woo MA, Valladares EM, Yan-Go FL, Harper RM. Brain structural changes in obstructive sleep apnea. Sleep. 2008;31:967–77. [PMC free article] [PubMed] [Google Scholar]
- 14.Macey PM, Kumar R, Yan-Go FL, Woo MA, Harper RM. Sex differences in white matter alterations accompanying obstructive sleep apnea. Sleep. 2012;35:1603–13. doi: 10.5665/sleep.2228. [DOI] [PMC free article] [PubMed] [Google Scholar]
- 15.Morrell MJ, McRobbie DW, Quest RA, Cummin AR, Ghiassi R, Corfield DR. Changes in brain morphology associated with obstructive sleep apnea. Sleep Med. 2003;4:451–4. doi: 10.1016/s1389-9457(03)00159-x. [DOI] [PubMed] [Google Scholar]
- 16.Santarnecchi E, Sicilia I, Richiardi J, et al. Altered cortical and subcortical local coherence in obstructive sleep apnoea: a functional magnetic resonance imaging study. J Sleep Res. 2013 doi: 10.1111/jsr.12006. [DOI] [PubMed] [Google Scholar]
- 17.Sarchielli P, Presciutti O, Alberti A, et al. A 1H magnetic resonance spectroscopy study in patients with obstructive sleep apnea. Eur J Neurol. 2008;15:1058–64. doi: 10.1111/j.1468-1331.2008.02244.x. [DOI] [PubMed] [Google Scholar]
- 18.Tonon C, Vetrugno R, Lodi R, et al. Proton magnetic resonance spectroscopy study of brain metabolism in obstructive sleep apnoea syndrome before and after continuous positive airway pressure treatment. Sleep. 2007;30:305–11. doi: 10.1093/sleep/30.3.305. [DOI] [PubMed] [Google Scholar]
- 19.Yaouhi K, Bertran F, Clochon P, et al. A combined neuropsychological and brain imaging study of obstructive sleep apnea. J Sleep Res. 2009;18:36–48. doi: 10.1111/j.1365-2869.2008.00705.x. [DOI] [PubMed] [Google Scholar]
- 20.Veasey SC. Piecing together phenotypes of brain injury and dysfunction in obstructive sleep apnea. Front Neurol. 2012;3:139. doi: 10.3389/fneur.2012.00139. [DOI] [PMC free article] [PubMed] [Google Scholar]
- 21.Tachibana N, Ayas NT, White DP. A quantitative assessment of sleep laboratory activity in the United States. J Clin Sleep Med. 2005;1:23–6. [PubMed] [Google Scholar]
- 22.Finelli LA, Borbely AA, Achermann P. Functional topography of the human nonREM sleep electroencephalogram. Eur J Neurosci. 2001;13:2282–90. doi: 10.1046/j.0953-816x.2001.01597.x. [DOI] [PubMed] [Google Scholar]
- 23.Tinguely G, Finelli LA, Landolt HP, Borbely AA, Achermann P. Functional EEG topography in sleep and waking: state-dependent and state-independent features. Neuroimage. 2006;32:283–92. doi: 10.1016/j.neuroimage.2006.03.017. [DOI] [PubMed] [Google Scholar]
- 24.Ferrarelli F, Huber R, Peterson MJ, et al. Reduced sleep spindle activity in schizophrenia patients. Am J Psychiatry. 2007;164:483–92. doi: 10.1176/ajp.2007.164.3.483. [DOI] [PubMed] [Google Scholar]
- 25.Ferrarelli F, Peterson MJ, Sarasso S, et al. Thalamic dysfunction in schizophrenia suggested by whole-night deficits in slow and fast spindles. Am J Psychiatry. 2010;167:1339–48. doi: 10.1176/appi.ajp.2010.09121731. [DOI] [PMC free article] [PubMed] [Google Scholar]
- 26.Ferrarelli F, Sarasso S, Guller Y, et al. Reduced natural oscillatory frequency of frontal thalamocortical circuits in schizophrenia. Arch Gen Psychiatry. 2012;69:766–74. doi: 10.1001/archgenpsychiatry.2012.147. [DOI] [PMC free article] [PubMed] [Google Scholar]
- 27.Plante DT, Goldstein MR, Landsness EC, et al. Topographic and sex-related differences in sleep spindles in major depressive disorder: A high-density EEG investigation. J Affect Disord. 2012 doi: 10.1016/j.jad.2012.06.016. [DOI] [PMC free article] [PubMed] [Google Scholar]
- 28.Plante DT, Landsness EC, Peterson MJ, et al. Sex-related differences in sleep slow wave activity in major depressive disorder: a high-density EEG investigation. BMC Psychiatry. 2012;12:146. doi: 10.1186/1471-244X-12-146. [DOI] [PMC free article] [PubMed] [Google Scholar]
- 29.Young T, Peppard PE, Gottlieb DJ. Epidemiology of obstructive sleep apnea: a population health perspective. Am J Respir Crit Care Med. 2002;165:1217–39. doi: 10.1164/rccm.2109080. [DOI] [PubMed] [Google Scholar]
- 30.Douglass AB, Bornstein R, Nino-Murcia G, et al. The Sleep Disorders Questionnaire. I: Creation and multivariate structure of SDQ. Sleep. 1994;17:160–7. doi: 10.1093/sleep/17.2.160. [DOI] [PubMed] [Google Scholar]
- 31.Johns MW. A new method for measuring daytime sleepiness: the Epworth sleepiness scale. Sleep. 1991;14:540–5. doi: 10.1093/sleep/14.6.540. [DOI] [PubMed] [Google Scholar]
- 32.Krupp LB, LaRocca NG, Muir-Nash J, Steinberg AD. The fatigue severity scale. Application to patients with multiple sclerosis and systemic lupus erythematosus. Arch Neurol. 1989;46:1121–3. doi: 10.1001/archneur.1989.00520460115022. [DOI] [PubMed] [Google Scholar]
- 33.Silber MH, Ancoli-Israel S, Bonnet MH, et al. The visual scoring of sleep in adults. J Clin Sleep Med. 2007;3:121–31. [PubMed] [Google Scholar]
- 34.Huber R, Graf T, Cote KA, et al. Exposure to pulsed high-frequency electromagnetic field during waking affects human sleep EEG. Neuroreport. 2000;11:3321–5. doi: 10.1097/00001756-200010200-00012. [DOI] [PubMed] [Google Scholar]
- 35.Jung TP, Makeig S, McKeown MJ, Bell AJ, Lee TW, Sejnowski TJ. Imaging Brain Dynamics Using Independent Component Analysis. Proc IEEE Inst Electr Electron Eng. 2001;89:1107–22. doi: 10.1109/5.939827. [DOI] [PMC free article] [PubMed] [Google Scholar]
- 36.Kurth S, Ringli M, Geiger A, LeBourgeois M, Jenni OG, Huber R. Mapping of cortical activity in the first two decades of life: a high-density sleep electroencephalogram study. J Neurosci. 2010;30:13211–9. doi: 10.1523/JNEUROSCI.2532-10.2010. [DOI] [PMC free article] [PubMed] [Google Scholar]
- 37.Murphy M, Bruno MA, Riedner BA, et al. Propofol anesthesia and sleep: a high-density EEG study. Sleep. 2011;34:283–91A. doi: 10.1093/sleep/34.3.283. [DOI] [PMC free article] [PubMed] [Google Scholar]
- 38.Nichols TE, Holmes AP. Nonparametric permutation tests for functional neuroimaging: a primer with examples. Hum Brain Mapp. 2002;15:1–25. doi: 10.1002/hbm.1058. [DOI] [PMC free article] [PubMed] [Google Scholar]
- 39.Redline S, Kirchner HL, Quan SF, Gottlieb DJ, Kapur V, Newman A. The effects of age, sex, ethnicity, and sleep-disordered breathing on sleep architecture. Arch Intern Med. 2004;164:406–18. doi: 10.1001/archinte.164.4.406. [DOI] [PubMed] [Google Scholar]
- 40.Rodriquez A, RB, Smith R, Benca R. A high density EEG analysis of periodic limb movements in sleep. Sleep. 2012:35. [Google Scholar]
- 41.Plante DT, Landsness EC, Peterson MJ, et al. Altered slow wave activity in major depressive disorder with hypersomnia: a high density EEG pilot study. Psychiatry Res. 2012;201:240–4. doi: 10.1016/j.pscychresns.2012.03.001. [DOI] [PMC free article] [PubMed] [Google Scholar]
- 42.Canessa N, Castronovo V, Cappa SF, et al. Obstructive sleep apnea: brain structural changes and neurocognitive function before and after treatment. Am J Respir Crit Care Med. 2011;183:1419–26. doi: 10.1164/rccm.201005-0693OC. [DOI] [PubMed] [Google Scholar]
- 43.Joo EY, Tae WS, Lee MJ, et al. Reduced brain gray matter concentration in patients with obstructive sleep apnea syndrome. Sleep. 2010;33:235–41. doi: 10.1093/sleep/33.2.235. [DOI] [PMC free article] [PubMed] [Google Scholar]
- 44.Ayalon L, Peterson S. Functional central nervous system imaging in the investigation of obstructive sleep apnea. Curr Opin Pulm Med. 2007;13:479–83. doi: 10.1097/MCP.0b013e3282f0e9fb. [DOI] [PubMed] [Google Scholar]
- 45.Thomas RJ, Rosen BR, Stern CE, Weiss JW, Kwong KK. Functional imaging of working memory in obstructive sleep-disordered breathing. J Appl Physiol. 2005;98:2226–34. doi: 10.1152/japplphysiol.01225.2004. [DOI] [PubMed] [Google Scholar]
- 46.Lee HK, Park DH, Shin HS, Hong SC. Comparison of low resolution electromagnetic tomography imaging between subjects with mild and severe obstructive sleep apnea syndrome: a preliminary study. Psychiatry Investig. 2008;5:45–51. doi: 10.4306/pi.2008.5.1.45. [DOI] [PMC free article] [PubMed] [Google Scholar]
- 47.Toth M, Faludi B, Kondakor I. Effects of CPAP-therapy on brain electrical activity in obstructive sleep apneic patients: a combined EEG study using LORETA and Omega complexity : reversible alterations of brain activity in OSAS. Brain Topogr. 2012;25:450–60. doi: 10.1007/s10548-012-0243-0. [DOI] [PubMed] [Google Scholar]
- 48.Toth M, Faludi B, Wackermann J, Czopf J, Kondakor I. Characteristic changes in brain electrical activity due to chronic hypoxia in patients with obstructive sleep apnea syndrome (OSAS): a combined EEG study using LORETA and omega complexity. Brain Topogr. 2009;22:185–90. doi: 10.1007/s10548-009-0110-9. [DOI] [PubMed] [Google Scholar]
- 49.Vaishnavi SN, Vlassenko AG, Rundle MM, Snyder AZ, Mintun MA, Raichle ME. Regional aerobic glycolysis in the human brain. Proc Natl Acad Sci U S A. 2010;107:17757–62. doi: 10.1073/pnas.1010459107. [DOI] [PMC free article] [PubMed] [Google Scholar]
- 50.Vlassenko AG, Vaishnavi SN, Couture L, et al. Spatial correlation between brain aerobic glycolysis and amyloid-beta (Abeta) deposition. Proc Natl Acad Sci U S A. 2010;107:17763–7. doi: 10.1073/pnas.1010461107. [DOI] [PMC free article] [PubMed] [Google Scholar]
- 51.Boyle PJ, Scott JC, Krentz AJ, Nagy RJ, Comstock E, Hoffman C. Diminished brain glucose metabolism is a significant determinant for falling rates of systemic glucose utilization during sleep in normal humans. J Clin Invest. 1994;93:529–35. doi: 10.1172/JCI117003. [DOI] [PMC free article] [PubMed] [Google Scholar]
Associated Data
This section collects any data citations, data availability statements, or supplementary materials included in this article.
Supplementary Materials
Scatterplots of average power density across a region of interest for individual subjects. The region of interest (ROI) is defined as the cluster of 15 electrodes significantly reduced in obstructive sleep apnea (OSA) subjects relative to controls in normalized nonrapid eye movement (NREM) power density (see Figure 2). Rows represent frequency bands of interest as indicated: SWA (1-4.5 Hz), Theta (4.5-8 Hz), Alpha (8-12 Hz), Sigma (12-15 Hz), Beta (15-25 Hz), and Gamma (25-40 Hz). First column: Absolute power density. Second column: Normalized power density. OSA subjects are shown in red and control subjects in black. The colored vertical line for each row of dots represents the average for each group respectively.
Topographical analysis of rapid eye movement (REM) sleep electroencephalography (EEG) shows an apparent parietal decrease in power for obstructive sleep apnea (OSA) subjects relative to controls despite lack of significance. Rows represent frequency bands of interest as indicated: SWA (1-4.5 Hz), Theta (4.5-8 Hz), Alpha (8-12 Hz), Sigma (12-15 Hz), Beta (15-25 Hz), and Gamma (25-40 Hz). First column: Average REM sleep EEG topographies across frequency bands for OSA subjects. Second column: Scaled the same as for OSA subjects, topographical averages for healthy control matches during REM sleep. Third column: Map showing the individual electrode t-value (two-tailed, unpaired) maps for the comparison between OSA and control subjects in terms of absolute power. Blue values represent a decrease in absolute EEG power in OSA subjects relative to controls (OSA < control) and red represents an increase (OSA > control). Fourth column: Same as third column except that each subject was spatially normalized using the z-score across electrodes before creating the t-value comparison. Black dots indicate individual channels with P ≤ 0.05 (uncorrected).
Scatterplots and correlations between SWA in the parietal cluster, obstructive sleep apnea (OSA) severity, and arousal index. SWA region of interest (ROI) is defined as the average normalized SWA in the cluster significantly reduced in OSA subject relative to controls during nonrapid eye movement (NREM) sleep (see Figure 2). Dotted line on each plot indicates the least-squares line after data had been rank transformed. OSA subjects are shown in red and control subjects in black.