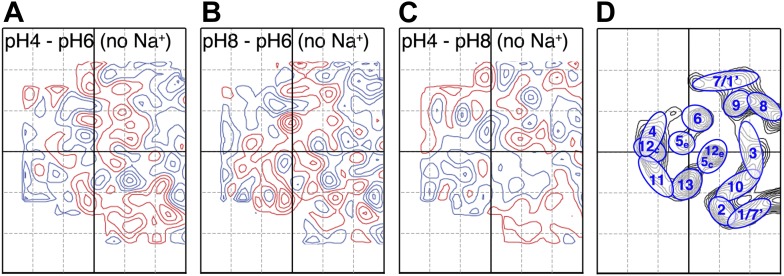
Figure 3. pH-induced conformational changes in absence of sodium.
Difference maps at 6 Å resolution between projection maps of MjNhaP1 2D crystals grown without sodium at different pH: (A) pH 4 minus pH 6; (B) pH 8 minus pH 6; and (C) pH 4 minus pH 8. (D) Helix assignment as in Figure 2B. Blue contours indicate positive differences, negative differences are shown in red.

