Abstract
This letter summarizes modifications to the results presented in Lavoué et al. (2012): Lavoué, J., Burstyn, I., Friesen, M. (2012) Workplace Measurements by the US Occupational Safety and Health Administration since 1979: Descriptive Analysis and Potential Uses for Exposure Assessment. Annals of occupational hygiene 57(1):77–97. Although several results were altered, the conclusions were not affected by the changes.
PAAnn. Occup. Hyg. , Vol. 57, No. 1, pp.77–97, 2013
In Lavoue et al. 2012, we reported the relationship between two U.S. measurement databases: the CEHD (chemical exposure health data) and IMIS (Integrated management information system) databases for personal lead measurements. To further examine the utility of CEHD and IMIS databases for occupational health research, we subsequently requested mid-2012 the IMIS data from OSHA for all agents available in IMIS, including a re-extraction of lead. This subsequent data extraction extracted 11 966 more personal lead measurements for the same time period than previously reported in Lavoue et al. 2012. The creation of measurement data from IMIS requires data extraction from multiple inter-relational and historical databases from OSHA personnel. We suspect that the original extraction included only those measurements that had related variables in all related databases. The subsequent extraction used more inclusive linkage parameters and thus identified more measurements. Here, we report the revised results from the comparison of CEHD and IMIS databases using the more inclusive personal lead data set and discuss their impact on our previously reported findings. To facilitate comparison of the original and revised results, we also present here in square brackets and in italic font the results published in the original paper.
For lead, the extracted data from the 1985–2009 IMIS data contained 46 050 [34 225] personal records, which were reduced to 45 680 [33 714] records corresponding to 14 272 [9905] inspections after elimination of coding errors and duplicates. When the IMIS and CEHD data were merged, 31 019 (49.5%) [23 033 (39.2%)] records were in common to both IMIS and CEHD datasets (‘both-IMIS-CEHD data’), 14 661 (23.4%) [10 681 (18.2%)] records were only in IMIS (‘IMIS-only data’), and 17 026 (27.2%) [25 012 (42.6%)] records were only in the CEHD database (‘CEHD-only data’). The distribution differed when we stratified by type of OSHA program (Table 4). Measurements collected under State OSHA plans were much less likely to be in the both-IMIS-CEHD data (14%) [13%] than measurements collected under federal OSHA (58%) [44%].
Table 4.
Distribution of the presence of data records in IMIS only, the Salt Lake City dataset, or both, according to the presence of OSHA stet plan.
| Federal plan | State plan (1) | Partial state plan (2) | ||||
|---|---|---|---|---|---|---|
| n | % | n | % | n | % | |
| IMIS only | 4,185 [3083] | 11 [8] | 8,285 [5,948] | 74 [67] | 2,191 [1,650] | 16 [13] |
| CEHD only | 11,678 [17,363] | 31 [47] | 1,376 [1,691] | 12 [19] | 3,972 [5,958] | 29 [45] |
| Both IMIS and CEHD | 21,945 [16,260] | 58 [44] | 1,530 [1,214] | 14 [14] | 7,544 [5,559] | 55 [42] |
| Total | 37,808 [36,706] | 100 [100] | 11,191 [8,853] | 100 [100] | 13,707 [13,167] | 100 [100] |
(1) States with OSHA state plans include: AK, AZ, CA, HI, IN, IA, KY, MD, MI, MN, NM, NC, OR, PR, SC, TN, UT, VT, VA, WA, WY.
(2) States with partial OSHA state plans include: CT, IL, NJ, NY, VI, NV.
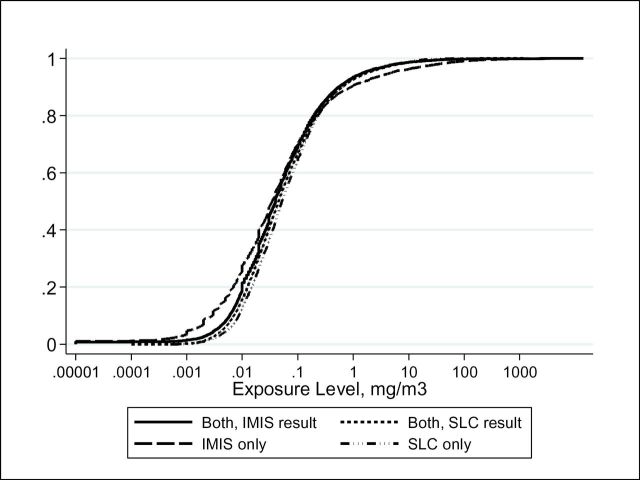
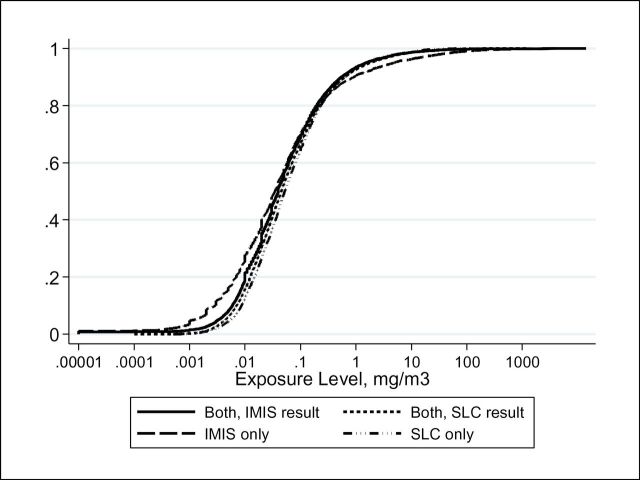
Figure 2 shows the empirical cumulative distribution functions of the lead concentrations in each data set, with all values shown in figure 2a and only detected values shown in figure 2b. As shown on the left-hand side of figure 2a, the percentage of non-detects differed substantially among the both-IMIS-CEHD, CEHD-only and IMIS-only datasets (50% [42%], 74% [74%], and 46% [46%], respectively), causing very different empirical cumulative distribution functions in figure 2a. On the other hand, figure 2b shows very similar empirical cumulative distribution functions when data is restricted to detected samples. Hence, the 25th percentile, median and 75th percentile were similar among the both-IMIS-CEHD, CEHD-only and IMIS-only datasets for detected samples (25th percentile: 0.013 [0.015], 0.019 [0.015], 0.010 [0.010]; median: 0.040 [0.042], 0.052 [0.043], 0.035 [0.039]; 75th percentile: 0.140 [0.150], 0.171 [0.141], 0.140 [0.150]). Values for the both-CEHD-IMIS subset in the previous calculation data were taken from the IMIS results data; there were negligible differences when the CEHD values were used.
Fig. 2a.
Empirical cumulative distribution functions of the lead concentrations in the IMIS-only, CEHD-only, and both-IMIS-CEHD datasets.
Fig. 2b.
Empirical cumulative distribution functions of the detected lead concentrations in the IMIS-only, CEHD-only, and both-IMIS-CEHD datasets.
To illustrate the potential implications of the “not present” vs. “not detected” issue mentioned above, we considered the IMIS-only dataset for lead (46% [46%] of non-detects). If the non-detects were primarily collected in locations where lead exposure was not present, excluding the non-detects would yield a GM of 0.042 [0.042] mg/m3 (GSD=12.6 [9.2]). If the non-detects were “present but not detected”, including the non-detects using an imputation based on regression on order statistics (Helsel, 2005) would yield a GM of 0.005 [0.007] mg/m3 (GSD=26.5 [18.5]), based on a limit of detection of 0.00284mg/m3 (OSHA method ID125) and the median sampling time in the CEHD lead data (222min.).
The updated results show that the additional records only impacted significantly the percentage of data common to IMIS and CEHD (from 39.2 to 49.5%). These results show that linkage between CEHD and IMIS was somewhat better for lead than we expected. They do not change the main conclusion of our study.
We end this corrigendum with a recommendation to potential users of the IMIS database to the effect that their Freedom of information act request be as much precise as possible. IMIS was not designed primarily as a measurement database, and, as mentioned earlier retrieving measurement data requires several linkage procedures. The numbers presented in this corrigendum can be used in communications with OSHA for data requests to make sure that data extraction is the most complete.
Reference
- Lavoué J., Burstyn I., Friesen M. (2012). Workplace Measurements by the US Occupational Safety and Health Administration since 1979: Descriptive Analysis and Potential Uses for Exposure Assessment. Annals of occupational hygiene 57(1):77–97 [DOI] [PMC free article] [PubMed] [Google Scholar]


