

Abstract
Effector memory T cells (TM) play a key role in the pathology of certain autoimmune disorders. The activity of effector TM cells is under the control of Kv1.3 ion channels, which facilitate the Ca2+ influx necessary for T cell activation and function, i.e. cytokine release and proliferation. Consequently, the knock-down of Kv1.3 expression in effector TM’s may be utilized as a therapy for the treatment of autoimmune diseases. In this study we synthesized lipid unilamellar nanoparticles (NPs) that can selectively deliver Kv1.3 siRNAs into TM cells in vitro. NPs made from a mixture of phosphatidylcholine, pegylated/biotinylated phosphoethanolamine and cholesterol were functionalized with biotinylated-CD45RO (cell surface marker of TM’s) antibodies via fluorophore-conjugated streptavidin (CD45RO-NPs). Incubation of T cells with CD45RO-NPs resulted into the selective attachment and endocytosis of the NPs into TM’s. Furthermore, the siRNA against Kv1.3, encapsulated into the CD45RO-NPs, was released into the cytosol. Consequently, the expression of Kv1.3 channels decreased significantly in TM’s, which led to a remarkable decrease in Ca2+ influx. Our results can form the basis of an innovative therapeutic approach in autoimmunity.
Keywords: autoimmunity, T cell, Kv1.3 ion channel, lipid nanoparticles, siRNA
1 Introduction
The appropriate function of the immune system is necessary to identify and eliminate pathogens and malfunctioning/cancerous cells. However, recognition of various proteins, small DNA-sequences or other molecules produced by the host body (termed self) as possible pathogenic agents leads to the onset of chronic diseases of the immune system named autoimmune diseases (for review on T cell related autoimmunity see [1]). The immune system is comprised of a variety of T cell subsets, which are responsible for the acquired immune defense. Naïve T cells are those that have never encountered an antigen, while central memory (TCM) and effector memory (TEM) cells were previously exposed to a specific antigen, and provide the memory response. TEM are capable of delivering immediate local tissue responses to antigens on the basis of their reduced activation requirements and increased frequency. In contrast, TCM cells (which constitute ca. 5% of the total memory pool) are capable of rapidly generating a large number of effector cells based on their high proliferative capacity and ability to differentiate into effectors [2].
The pathology of several autoimmune disorders (such as Multiple Sclerosis (MS), Type 1 Diabetes Mellitus (T1DM), Rheumatoid Arthritis (RA) and Systemic Lupus Erythematosus (SLE)) has been coupled to the presence of TEM cells which, in the case of MS and RA, have been reported to infiltrate the target tissues and contribute to local tissue damage [3, 4]. In SLE TEM’s are highly expressed and hyperactive, and they can contribute to the cardiovascular complications of the disease [5–8]. Consequently, a therapeutic intervention suppressing the function of TEM may be beneficial in autoimmunity.
The activation and the subsequent effector functions of T cells, such as proliferation and cytokine release, are firmly linked to the sustained elevation of intracellular Ca2+ concentration ([Ca2+]i) triggered by the encounter with an antigen. Ca2+ influx induced by antigen presentation occurs through CRAC (Calcium Release Activated Ca2+) channels that work in concert with other ion channels, transporters and pumps [9]. Particularly, to sustain the driving force for Ca2+ ions through CRAC, two potassium channels, the voltage-gated Kv1.3 and the intracellular Ca2+ activated KCa3.1, maintain the negative transmembrane potential [10]. It was reported that these two K+ channels are differentially expressed in T cell subsets. TEM’s from patients with autoimmune diseases (RA, T1DM, MS) are characterized by the high level of Kv1.3 as compared to KCa3.1 channels, hence, the former dominantly regulates the TEM cells’ membrane potential [4, 11]. Indeed, Ca2+-dependent activation in these cells can be prevented by application of specific Kv1.3 blockers [4, 11]. Previously we demonstrated that inhibition of Kv1.3 channels with a potent specific inhibitor (ShK from Stichodactyla helianthus, sea anemone) can hamper Ca2+-signaling in SLE T cells [12–14].
Although in vivo application of Kv1.3 blockers have been used effectively in animal models of autoimmunity, the expression of Kv1.3 channels in other cell types may reveal unexpected and undesirable side effects [4, 15, 16]. To tackle the possible limitations of the pharmacological therapy, we tested whether targeted silencing of the Kv1.3 gene in TM’s could be an alternative approach. Effective and selective in vivo delivery of siRNA is still a challenge, but the utilization of nanoparticles has been successfully implemented to handle this obstacle [17–20]. To design this type of therapy we took advantage of the fact that TEM’s are characterized by the presence of “O” or “0” isoform of CD45R (CD45RO phosphatase) and lack of CD45RA (isoform “A”) and CCR7− (chemokine receptor 7) in the cell membrane [2]. Also TCM are CD45RO+, however, they express CCR7 and they make up a small fraction of memory T cell population. Naïve T cells, instead, constitute a CD45RA+CCR7+ and CD45RO− subpopulation of the T cell pool.
In this study we investigated whether lipid, antibody-functionalized NPs can deliver siRNAs against Kv1.3 channels selectively to human CD45+, effector memory T cells and suppress their function. We utilized fluorescence confocal microscopy along with immucytochemistry to test if the binding and the internalization of CD45RO antibody labeled NPs, as well as the release of fluorophore-tagged siRNA into the cytosol, is specific to the TM cells. Furthermore, to monitor the effectiveness of gene-downregulation by siRNAs encapsulated into NPs single-cell electrophysiology (patch-clamp technique) was utilized to determine the expression/current of Kv1.3 ion channels in TM cells. To assess the functional impact of Kv1.3 gene knock-down on the Ca2+-response in TM cells, which may form the basis of a potential therapeutic approach, we performed Indo-1 ratiometric Ca2+ measurements using flow cytometer.
2 Material and methods
2.1 Cells
Human T lymphocytes were isolated from the blood of healthy consented donors and discarded blood units from Hoxworth Blood Center (UC, Cincinnati) using RosetteSep™ Human Total Lymphocyte Enrichment Cocktail (StemCell Technologies). The protocol was approved by University of Cincinnati IRB. T cells were maintained in RPMI-1640 medium supplemented with 10 % human serum, 200 U/ml penicillin, 200 μg/ml streptomycin and 10 mM HEPES (T cell medium). Cells were activated with 4–10 μg/ml PHA (phytohemaglutinnin-A, Sigma-Aldrich) in presence of peripheral blood mononuclear cells (PBMC) for 72 hrs.
2.2 NP preparation
Chloroform-dissolved lipids L-α-phosphatidylcholine (PC), 1,2-distearoyl-sn-glycero-3-phosphoethanolamine-N-[biotinyl(polyethylene glycol)-2000] (PE-PEG-biotin) and cholesterol (CH) (Avanti Polar Lipids Inc.) were mixed in a 3:1:1 mole ratio, dried with N2 gas, rehydrated with PBS (pH = 7.4), and shaken in an incubator at 37°C for 2 hours to make multilamellar vesicles (MLV). After sonication (Misonix, XL-2000 series), the sample was extruded with 100 nm filter to synthesize unilamellar vesicles (ULV) (LIPEX™ Thermobarrel Extruder, Northern Lipids Inc.). NPs with lipid dye CellVueRed (Molecular Targeting Technologies Inc.) were prepared as described above except the lipid dye was added to the lipid mixture before drying with N2.
2.3 Functionalization of ULVs
Biotynilated antibodies (mouse anti-human IgG and CD45RO, 10 μg/ml, BD Biosciences) were first incubated with 10 μg/ml Alexa-647 or Alexa-488 conjugated streptavidin (SAV, Life Technologies) in PBS. Then the antibody-SAV complex was added to the 100 nm ULV and incubated at room temperature. The unbound antibody and SAV was removed using CL-4B columns (GE Healthcare Life Sciences). NPs later used for siRNA encapsulation were frozen at −80 °C for 2–4 hrs, then lyophilized for 48 hrs (Labconco, FreeZone 6 Freeze Dryer).
2.4 siRNA encapsulation into NPs
Lyophilized CD45RO-NPs (app. 50 μg lipid) were reconstructed in 100 μl nuclease-free water containing 200–400 pmol of either Kv1.3-siRNA (Kv1.3-NPs; Santa- Cruz Biotechnology Inc.) or scramble Cy3-siRNA (Scramble-NPs Applied Biosystems) complexed with protamine-sulfate (1:5 molar ratio).
2.5 Size measurement of NPs
Dynamic Light Scattering (DLS) and intensity fluctuation correlation methods was used to determine NPs diameter with Zetasizer Nano ZS (Malvern Instrument). ULVs were visualized using scanning electron microscopy (SEM, Hitachi SU 8000), scanning transmission electron microscopy (STEM), and WETSEM for hydrated samples. Briefly, for TEM observation, lyophilized nanoparticles were first dispersed in Methanol and lipid solution (50 μL) was dropped and dried on Cu grid (TED PELLA, G200HS). The samples were inserted and visualized in the STEM microscope at 30 kV. Also, lipid NPs were visualized in hydrated state using WETSEM ™ technology (EI-Mul Technology, Israel). Liquid dish membrane (QX 102 capsule) was first coated by poly-L-lysine and suspended NPssolution (15 μL) were attached on the membrane and lipid vesicles were visualized using SEM at 25 kV.
2.6 Immunocytochemistry
T cells incubated with antibody-coated NPs were plated onto poly-L-lysine coated glass coverslips and fixed with 1 % formaldehyde. When cells were labeled with mouse anti-human CD45RA-Alexa488 antibody (Biolegend) to test CD45RO-NPs specificity, blocking with 10 % FCS in PBS (pH 7.4) preceded incubation with the CD45RA antibody. Coverslips were mounted onto glass slides using Fluoromount G (eBioScience).
2.7 Confocal microscopy
Zeiss LSM 510 META was used for confocal images of the cells. The He-Ne laser was selected to excite fluorophore Alexa647 (line 633 nm) and Cy3/CellVueRed (line 543 nm), and Argon laser (line 488nm) to visualize Alexa488. The thickness of the slices and z-stacks were set to 1 μm.
2.8 Electrophysiology
Kv1.3 currents were recorded using Axopatch 200B amplifier (Molecular Devices) in whole-cell voltage-clamp configuration. The bath solution was (in mM): 145 NaCl, 5 KCl, 1 MgCl2, 2.5 CaCl2, 5.5 glucose, 10 HEPES (pH 7.35). The pipette solution contained (in mM): 140 KF, 11 K2EGTA, 1 CaCl2, 2 MgCl2, and 10 HEPES (pH 7.22) [21]. Kv1.3 currents were evoked by 15-ms-long depolarizations to +50 mV from a holding potential (HP) of −120 mV. The amplitude of the peak current was determined at +50 mV, and the current density (CD) was given as the ratio of peak current at +50 mV and the whole-cell cell capacitance (which is a measurement of cell size/surface area). The CD is proportional to the number of Kv1.3 channels per unit area.
2.9 Cell transfection
T cells were transected by nucleofection with Kv1.3 specific and scramble Cy3-labeld siRNAs along with pmaxGFP using 4D-Nucleofector System according to the manufacturer’s protocol (Lonza Group Ltd.) [22]. The cells were studied 24 hours post transfection.
2.10 Treatment of T cells with siRNA-encapsulated NPs (siRNA-NPs)
3×10⁵ T cells (either activated, for electrophysiological experiments, or resting, for Ca2+ measurements) in T cell medium were mixed with 50 μl of siRNA-NPs, and incubated for 24 h in cell culture incubator (37°C, 5% CO2, humidified).
2.11 Ca2+ measurement
Ca2+ was measured using the Ca2+ add-back method as described by Baba et al. [23]. Briefly, 1×10⁶ CD3+ cells were loaded with 1:1000 fold of 2 mg/ml Indo-1/AM ratiometric dye and 0.015% Pluronic 127 (Life Technologies, Carlsbad, CA) in Hank’s balanced salt solution containing 1 mM CaCl2, 1 mM MgCl2 and 1% FCS for 30 min at 37 °C, then washed three times in Hank’s balanced salt solution supplemented with 10 mM HEPES (pH 7.0) and 1% FCS. Prior to measurements, cells were resuspended in a calcium-depleted solution prepared from the Hank’s balanced salt solution/HEPES solution mentioned above and supplemented with 0.5 mM EGTA (pH 7.4). Samples were kept at 37°C until analysis. Indo-1 fluorescence ratio (indicative of the [Ca2+]i) in T cells were measured by flow cytometry on an LSRII flow cytometer (Beckton Dickinson) using a 20mW UV (355 nm) laser and capturing fluorescence using 505 nm long pass and 530/30 band pass filters for unbound Indo-1 and a 405/20 band pass filter for Ca2+-bound Indo-1 [12]. Changes in Indo-1 fluorescence ratio were measured in TM cells by gating on CD45RO-NPs labeled with SAV-Alexa488. The following protocol was implemented. Cells were exposed to thapsigargin (TG, 1μM) in 0 mM Ca2+ solution followed by the 2 mM Ca2+-containing solution. This protocol allows measuring Ca2+ influx, which originates exclusively through CRAC channels. Exposure of the cells to TG leads to depletion of intracellular Ca2+ stores and activation of the signaling steps necessary for opening of CRAC channels [10]. Ca2+ influx through the opened CRAC channels is then induced by increasing the extracellular Ca2+ concentration ([Ca2+]). Samples were recorded at 300 events/second on a ‘low’ flow rate. Analysis of the kinetics was performed using Flow-Jo software (Tree Star Inc).
Area under the curve (AUC) was calculated for that part of Ca2+-response curve when cells were bathed in 2 mM Ca2+ solution after TG addition, and it estimates the average Ca2+ influx into the cell. Ca2+ amplitudes (ΔCa2+) was given as the peak intensity ratio of Indo-1 upon addition of 2 mM Ca2+ corrected with the mean Indo-1 ratio at 0 mM Ca2+ before TG addition (baseline was subtracted from the peak value).
2.12. Reagents
All reagents were purchased from Sigma-Aldrich Ltd., if not otherwise stated. ShK was bought from Bachem Holding AG.
2.13 Statistical analysis
Statistical comparison was performed using Student’s t-test; the significance level was set to 0.05. The values are given as mean ± SEM.
3 Results
3.1 Synthesis, functionalization and siRNA encapsulation of 100 nm size lipid nanoparticles
To obtain unilamellar lipid NPs first a mixture of PC, PE-PEG-biotin and CH was shaken in PBS to form MLVs (Supp. Fig. 1 shows the SEM images of MLVs). Then, by use of sonication, the large vesicles were broken into the smaller-size vesicles. Finally, extrusion was applied to achieve the required 100 nm diameter liposomes (Fig. 1A). Since the surface of NPs is crowded with biotin attached to PE-PEG, the benefit of the strongest non-covalent interaction between streptavidin and biotin was utilized to attach antibodies to NPs (Fig 1B) [24]. Fig 1B illustrates that the particles, decorated with streptavidin (SAV) conjugated with fluorophores (Alexa647 or Alexa488), provide an active fluorescent surface suitable for attachment of any biotin-labeled antibody and for visualization. Since the TEM’s and TCM’s are characterized by the expression of CD45RO, which is absent in naïve T cells, we “labeled” streptavidin-NPs with either biotinylated mouse anti-human CD45RO antibody (CD45RO-NPs) or IgG as isotype control (IgG-NPs) (Fig 1B). To verify the correct size of NPs, SEM and TEM images were taken and the NP size was routinely measured by dynamic light scattering method (Fig. 2 and Supp. Table 1). As shown in Fig. 2B, ULVs of 100 nm were spherical and non-porous, and they exhibited smooth surface properties and layered structure. To incorporate siRNAs into functionalized liposomes we lyophilized CD45RO-NPs and then reconstituted them in RNase free water containing protamine-complexed siRNAs (Fig. 1B).
Fig. 1. Synthesis and antibody-labeling of unilamellar lipid particles.

(A) Schematic representation of ULV synthesis. Lipids were combined into a round-bottomed glass vessel, and dried with N2 to form a lipid film. Rehydration of lipids in PBS (pH 7.4) was followed by two-hour-long shaking at 37 °C, then sonication and extrusion (100 nm filter discs) was applied to obtain 100 nm ULVs (unilamellar vesicle). (B) Functionalization of ULVs occurred via biotin attached to the surface of ULVs via PE-PEG. The lyophilized antibody-coated NPs were then reconstructed in siRNA solution to incorporate siRNAs. For detailed protocol see Material and Methods.
Fig. 2. Optical images of lipid particles.

(A) WETSEM images of a mixture of 500 nm and 200 nm lipid particles. Lipid particles were visualized in 15 μl DI water solution with a vacuum tight QX-capsule. (B) TEM images resulting from the described manufacturing process showed size of 100 nm ULVs (unilamellar vesicle).
3.2 CD45RO-NPs specifically bind to and are internalized by TM cells
In cell-targeted therapy it is critical to design NPs which can attach with their cargo only to the selected cells/tissues. Hence, we first tested whether CD45RO-NPs were able to bind selectively to TM cells. We exposed primary human T cells to fluorescent (SAV conjugated with Alexa647, blue) lyophilized/reconstructed CD45RO-NPs or IgG-NPs. After 24 hr incubation (at 37 °C in the presence of 10% human serum), the cells were fixed, and naïve T cells were labeled with Alexa488 conjugated CD45RA antibody (Fig. 3, green, panel b). The confocal micrographs in Fig. 3A show that CD45RO-NPs bound only to TM but not naïve T cells. The merged image of Fig 3A (panel d) clearly demonstrates that the cells, which are decorated with CD45RO-NPs, do not express CD45RA. To show the lack of CD45RO-NP non-specific binding, we incubated T cells with IgG-NPs. The images of Fig 3B (panel c and d) illustrate that IgG-NPs do not adhere to the membrane of T cells.
Fig. 3. CD45RO-NPs specifically bind to CD45RO+ TM cells.

Confocal images of 1 μm thickness were taken of CD3+ T cells incubated with lyophilized CD4RO-NPs (A) or IgG-NPs (B) and then labeled directly with CD45RA-Alexa488 antibody (green). Panels show: a: brightfield image of the cells, b: CD45RA+, naïve T cells (green), c: TM cells with CD45RO-NPs (blue), d: overlay of blue and green channels. Note that the blue and the green signals do not show “co-labeling”.
Further experiments show that bound CD45RO-NPs are internalized by TM cells (Fig. 4). We utilized CD45RO-NPs labeled with CellVueRed lipid dye (red, panel b of Fig. 4A) and SAV-Alexa647 (blue, panel c). After a 24-hour-incubation of T cells with these NPs, cells were plated and the CD45RO antibodies on the NPs, which had already interacted with the cells, were labeled with Alexa488 secondary antibody (green, IgG-Alexa488, panel d). Since this latter step occurs in non-permeabilized cells, this intervention allows exclusive staining of the CD45RO-NPs attached to the cell membrane. Therefore, the merge image (panel e) shows internalization of NPs (purple fluorescence) as well as their fusion to the plasma membrane (white and yellow fluorescence). Similar distribution was observed with CD45RO-NPs that underwent lyophilization indicating that this procedure did not compromise the antibody binding, i.e. the antibodies remained attached to the surface of the NPs (Fig. 4B). As shown before, the fluorescence signals of SAV-Alexa647 (blue, panel c) and CellVueRed (red, panel b) of the NPs (same NPs as those used for the experiment in Fig. 4A) are co-localized only in a subset of T cells. Overall these experimental results confirm that lyophilized CD45RO-NPs can selectively target and accumulate in/on TM cells. Hence, CD45RO-NPs represent a suitable carrier for siRNA delivery and gene knock-down in TM’s.
Fig. 4. TM cells endocytose CD45RO-NPs.
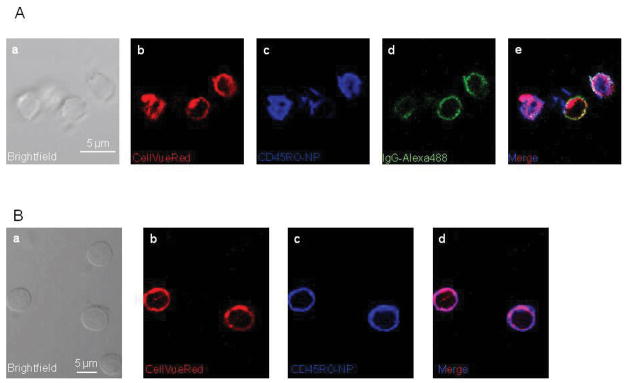
(A) Confocal images of T cells incubated with CellVueRed-containing CD45RO-NPs, and the CD45RO antibody on the NPs was labeled with Alexa488 secondary mouse antibody (ALexa488-IgG, green). Microscopic photos illustrate a: brightfield image of the cells, b: CellVueRed signal of NPs; c: Alexa647 fluorescence of SAV, (ULVs attached TM cells), d: Alexa-488 fluorescence of 2nd antibody, e: merge of the red, blue and green channels. (B) T cells treated with lyophilized (24 hr culturing), CellVueRed-labeled CD45RO-NPs are shown in the confocal pictures. They exhibit: a: brightfield image of the cells, b: CellVueRed signal of ULVs (red); c: Alexa-647 fluorescence of ULVs attached to/in the TM cells, d: merge of the red and blue channels.
3.3 Kv1.3 siRNA delivery to TM cells
Even though the CD45RO-NPs recognize, bind to and enter the TM’s, this does not automatically mean that the encapsulated cargo is released into the cytosol. Consequently, in the next step we utilized CD45RO-NPs loaded with a Cy3-labeled scramble siRNA to visualize whether these NPs are able to deliver siRNAs into TM cells. As detailed above and shown in Fig 1B, freeze-dried CD45RO-NPs were reconstructed in protamine-complexed control Cy3-siRNA containing water and added to primary T cell for 24 hrs. Fig. 5A demonstrates that CD45RO-NPs (SAV-Alexa647, blue, panel c) loaded with Cy3-siRNA (red, panel b) were capable of attaching to TM cells selectively, and the siRNAs were detected intracellularly in CD45RO+ cells that picked up the CD45RO-NPs (merge image, panel d). A further confirmation of specific NP-assisted siRNA delivery is shown in the confocal snapshots of T cells treated with naked Cy3-siRNA/protamine solution for 24 hr (Fig. 4B). No intracellular red fluorescence of Cy3-siRNA was detected. Overall, these findings show that CD45RO-NPs are able to serve as transporters of siRNAs into the TM’s.
Fig. 5. Cy3-siRNA uptake of TM cells.

Representative, confocal snapshots of T cells treated with Cy3-siRNA encapsulated CD45RO-NPs (A). Images from left to right, a: brightfield image of the cells, b: Cy3-siRNA signal, c: Alexa-647 (CD45RO-NPs), d: merge of blue (Alexa-647, CD45RO-NP-positive cells) and red (cells with Cy3-siRNA in the cytosol) channels. (B) Images of cells treated with protamine-complexed naked Cy3-siRNAs.
3.4 Kv1.3-NPs reduce expression of Kv1.3 channels
To measure the efficacy of Kv1.3 channels’ knock-down by Kv1.3-NPs, we applied a single cell technique – patch-clamping – to compare the currents through Kv1.3 channels in Kv1.3-NPs (Kv1.3 siRNA loaded CD45RO-NPs) and Scramble-NPs (control siRNA encapsulated CD45RO-NPs) treated cells. These measurements allow estimation of the expression of functional Kv1.3 channels in single TM cells. In these experiments, the Alexa488 fluorophore conjugated SAV moiety of the NPs was used to visualize the cells that have bound/incorporated the NPs. Only cells that displayed green fluorescence were selected for electrophysiological recording. The knock-down efficiency of Kv1.3-NPs was compared with that of naked (non NP encapsulated/transfected; see materials and methods) Kv1.3 siRNAs. These Kv1.3 siRNAs were shown to be effective inhibitors of Kv1.3 expression [25]. Activated T cells were co-transfected with naked Kv1.3 or scramble siRNAs and a GFP-encoding plasmid (moles of siRNA far exceeded that of the pMaxGFP vector). GFP-expressing cells were selected to undergo patch-clamping as they also contained siRNAs [22]. Whole-cell Kv1.3 current traces in T cells treated with Scramble-NPs and Kv1.3-NPs are shown in Fig. 6A. The Kv1.3 current was significantly lower in the cells treated with Kv1.3-NPs than in Scramble-NPs’ treated cells. Fig. 6B summarizes the results of these experiments. The extent of the decrease in Kv1.3 peak current and CD was app. 60 % (3 donors for each experiment, n≥15 cells) in Kv1.3-NP treated cells and Kv1.3-siRNA transfected cells. These data prove that Kv1.3 siRNAs delivered by CD45RO-NPs can effectively down-regulate the expression of Kv1.3 channels in TM cells.
Fig. 6. CD45RO-Kv1.3NPs down-regulate Kv1.3 expression in TM cells.
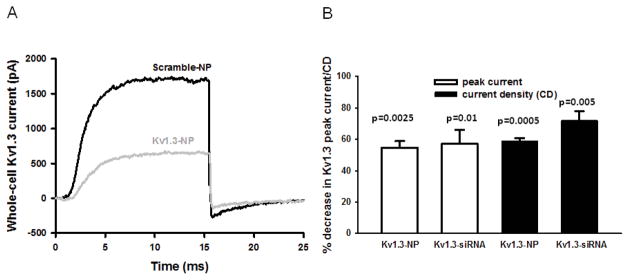
(A) Typical whole-cell current traces of Kv1.3 channels in an activated T cell treated with either Scramble-NPs or Kv1.3-NPs. Cells were held at −120 mV and depolarized to +50 mV for 15 ms; P/5 online leak subtraction was applied. (B) Reduction of Kv1.3 expression in percentages is shown in T cells treated with Kv1.3-NPs as compared to cells incubated with Scramble-NPs (3 donors, n=18). The reduction was determined for each donor and average percent decrease for three donors is indicated (mean ± SEM). The percent decrease in Kv1.3 current is also shown when T cells were transfected with specific Kv1.3 (Kv1.3-siRNA bars) and control siRNAs (3 donors, n=15).
3.5 Ca2+-signaling in memory T cells was reduced by Kv1.3-NP gene knock-down
Kv1.3 channels play an important role in the regulation of Ca2+ signaling in TM cells, and the inhibition of these channels reduces the influx of Ca2+ through the CRAC channels [9, 10]. Hence, the Ca2+-response of T cells treated with siRNA-loaded CD45RO-NPs was studied. In this set of experiments, resting T cells were incubated with either Kv1.3-NPs or Scramble-NPs (Fig. 7A–B). Cells treated with empty CD45RO-NPs or nothing served as further controls (Supp. Fig. 2). Twenty-four hour after treatment, Ca2+ measurements were performed. These were performed by flow cytometry, which allows gating on TM cells. A typical time-course of the Ca2+ experiments is shown in Fig. 7A. Indo1-loaded T cells were kept in Ca2+-free extracellular solution. Addition of TG (1 μM) induced a small increase in the [Ca2+]i (measured as an increase in the fluorescence ratio of Indo-1), which corresponds to the emptying of intracellular Ca2+ store (ER, endoplasmic reticulum). This intervention is used to artificially open the CRAC channels because it activates a Ca2+ sensor in the ER, which moves in proximity and opens the pore forming subunit of the CRAC channel in the plasma membrane [10]. Yet, no further [Ca2+]i increase is observed because the extracellular solution contains no Ca2+. At this point the external solution was changed to one containing 2 mM Ca2+. Immediately upon increasing the extracellular Ca2+, Ca2+ influx through CRAC channels can be detected. This is depicted by the robust increase in [Ca2+]i, which is monitored via the increase of the fluorescence ratio of Indo-1 at 400 and 475 nm. To validate flow-cytometric Ca2+ measurements and confirm the role of Kv1.3 in Ca2+-response we applied 10 nM ShK, a Kv1.3 antagonist (Supp. Fig 2A and B). Silencing the Kv1.3 gene by Kv1.3-NPs resulted in a remarkable decrease in Ca2+ influx as compared to Scramble-NPs’ treated cells (Fig. 7A). The effect of Kv1.3-NPs on Ca2+ uptake through CRAC channels was quantified by calculating the ratio of the area under curve (AUC) and Ca2+ peak amplitudes (ΔCa2+) for Kv1.3-silenced and control cells. Fig. 7B shows that both parameters of Ca2+ signaling decreased significantly upon Kv1.3-NP treatment of TM’s (3 donors). Comparable baseline and peak [Ca2+]i in untreated cells, and cells treated with empty CD45RO-NPs (Supp. Fig. 2A and B) and Scramble-NPs (Fig. 7A) are indicative of a lack of effect of CD45RO antibody on Ca2+ fluxes. These data indicate that Kv1.3-NPs could be an effective alternative to Kv1.3 pharmacological blockers.
Fig. 7. Kv1.3 silencing with Kv1.3-NPs impairs Ca2+ response in TM cells.

(A) Time-course of TG-induced Ca2+ influx through CRAC channels in resting T cells pre-incubated (24h) with Kv1.3-NPs (black line) or Scramble-NPs (gray line). Fluorescence intensity of Indo-1 loaded cells was detected with flow cytometer only in Alexa-488 gated subpopulation (NPs were functionalized with SAV-Alexa488). (B) Ratio of AUC (area under the curve) and Ca2+ amplitude (ΔCa2+) for Kv1.3-NP and Scramble-NP treated cells (n=3 donors, see also materials and methods).
4. Discussion
In this work we presented evidence, for the first time, that the gene expression of a T cell subpopulation can be manipulated by lipid-based unilamellar, antibody-functionalized NPs. Our data clearly verified that PEG-coated lipid NPs can be used as a substrate that can be rapidly functionalized with antibodies against specific T cell markers using streptavidin-biotin complex. The NPs functionalized with CD45RO antibodies can selectively bind to a subtype of T cells, the CD45RO+ TM’s that are key players in chronic immune disorders like autoimmunity. We provide evidence that TM cells bind and endocytose the NPs loaded with siRNAs. Ultimately, patch-clamp measurements demonstrated the efficient knock-down of Kv1.3, and flow cytometric Ca2+-flux experiments showed that downregulation of Kv1.3 channels by Kv1.3-NPs inhibits Ca2+ influx into TM cells. Since Ca2+ influx is one of the earliest events in T cell activation, these data indicate that Kv1.3-NPs could be used as immune suppressive agents to selectively reduce TM cell activation.
These NPs may be of particular interest in the treatment of autoimmune diseases. The treatment of autoimmune diseases requires a very careful strategy, as the systemic application of various drugs can inhibit the function of cells other than the targeted immune cells, which results in ensemble immunosuppression. Several studies reported that block of the Kv1.3 channel function by specific peptide toxins and small-molecules in animal models in vivo can be used to inhibit effector functions as well as migration of TEM cells in induced autoimmune deficiencies [4, 15, 16, 26]. However, other cell types express Kv1.3 channels (macrophages, dendritic cell, adipose cells, olfactory neurons), thus raising the possibility of undesirable side effects. Over the past few years more and more papers have been published reporting cell-specific approaches using NPs that had demonstrated fewer or no side-effects as compared to the systemic application of drugs. A study by Peers et al. described recently that the downregulation of cyclin D1 by β7 integrin antibody-coated lipid NPs loaded with siRNAs was effective in ameliorating induced colitis in an animal model [17]. It was shown that tumor-specific T cells can serve as a carrier and transport NPs attached to their surface via maleimide to the prostate tumor tissues in mice models [27]. It was also reported that lipid or non-lipid NPs with various surface coating can target other immune cells, thereby boosting immune responses against tumor cells or infectious agent [18, 19].
This manuscript reports the successful synthesis and specific targeting of CD45RO-NPs. A delicate step of this fabrication consists of the freeze-drying procedure, needed to include siRNA into the NPs, during which the detachment of functionalizing antibodies can occur due to the non-covalent, biotin-streptavidin linkage. This could give rise to the non-selective attachment of NPs to naïve T cells (bare NPs) or simply binding of CD45RO-fluorophore-conjugated-SAV complex to the TM’s. The data reported in Fig. 4 exclude these events: i) only SAV-fluorophore “positive” T cells are coated by CellVueRed-containing, CD45RO-NPs (Fig. 4B) ii) these lipid dye labeled CD45RO-NPs can be stained with secondary antibodies when they are linked to the cell surface of TM’s. Thus, we produced stable and effective NPs. The efficiency of the CD45RO-NPs was confirmed by confocal micrographs showing the cytosolic accumulation of Cy3-conjugated control siRNAs (Fig. 5) and functional studies (Figs 6 and 7). Patch-clamp experiments verified that Kv1.3-NPs were able to suppress Kv1.3 current/expression in TM cells. The 60 % knock-down efficiency probably can be owed to the efficacy of the siRNAs and not the amount of siRNAs in the NPs taken up by the cells: transfection of T cells with naked, specific siRNAs also had the same reduction in the Kv1.3 peak current. Further flow-cytometric Ca2+ measurements also underline that Kv1.3-siRNA was effectively delivered into the cells by CD45RO-NPs and could reduce the number of Kv1.3 channels in TM cells: the Kv1.3-regulated Ca2+ influx of T cells was significantly decreased (Fig. 7B).
Overall, all these results we have presented provide evidence that functionalized NPs can serve as new tools in siRNA-induced gene silencing therapy of T cell related autoimmune diseases. Yet, in vivo experiments similar to those conducted with pharmacological Kv1.3 blockers will have to be conducted using Kv1.3-NPs to established their therapeutic validity and efficacy.
5. Conclusions
Here we could show that memory T cells can be selectively targeted with unilamellar 100 nm liposomes by means of CD45RO-antibody functionalization. These engineered NPs are internalized into the cells, and their siRNA cargo is delivered into the cytosol. As a result of this, Kv1.3 channel expression is reduced, which in turn leads to decreased Ca2+ influx. This approach may offer a new modality in the treatment of autoimmune diseases which are associated to hyperactivity of T cells.
Supplementary Material
Supp. Table 1 Diameter of bare and functionalized NPs (in nm, mean ± SEM, n=4)
SEM images of multi-lamellar lipid particles. The images show aggregation of lipid particles with the size distribution of 0.5 micron to 1 micron.
Ca2+ response in TM/T cells with and without CD45RO-NPs. Time-course of thapsigargin-induced Ca2+ influx through CRAC channels in resting T cells pre-incubated (24h) with (A) or without (B) CD45RO-NPs. Indo-1 fluorescence in (A) was detected with flow cytometer only in the Alexa488 gated subpopulation (NPs were labeled with SAV-Alexa488). Ca2+ response was monitored in the absence (grey line) or presence (black line) of 10 nM ShK.
Acknowledgments
The authors are thankful to Dr. Giovanni Pauletti (University of Cincinnati) for help in the measurement with Zetasizer Nano ZS instrument. Authors are grateful to Dr. Paul R. Rosevear for the use of the lyophilizer. This project was funded in part by NIH grants R21AR060966 and R01CA095286. All flow cytometric data were acquired using equipment maintained by the Research Flow Cytometry Core in the Division of Rheumatology at Cincinnati Children’s Hospital Medical Center. The authors confirm that there are no known conflicts of interest associated with this publication and there has been no significant financial support for this work that could have influenced its outcome.
Footnotes
Publisher's Disclaimer: This is a PDF file of an unedited manuscript that has been accepted for publication. As a service to our customers we are providing this early version of the manuscript. The manuscript will undergo copyediting, typesetting, and review of the resulting proof before it is published in its final citable form. Please note that during the production process errors may be discovered which could affect the content, and all legal disclaimers that apply to the journal pertain.
References
- 1.Broux B, Markovic-Plese S, Stinissen P, Hellings N. Pathogenic features of CD4+CD28− T cells in immune disorders. Trends Mol Med. 2012;18:446–53. doi: 10.1016/j.molmed.2012.06.003. [DOI] [PubMed] [Google Scholar]
- 2.Sallusto F, Geginat J, Lanzavecchia A. Central memory and effector memory T cell subsets: function, generation, and maintenance. Annu Rev Immunol. 2004;22:745–63. doi: 10.1146/annurev.immunol.22.012703.104702. [DOI] [PubMed] [Google Scholar]
- 3.Rus H, Pardo CA, Hu L, Darrah E, Cudrici C, Niculescu T, et al. The voltage-gated potassium channel Kv1. 3 is highly expressed on inflammatory infiltrates in multiple sclerosis brain. Proc Natl Acad Sci U S A. 2005;102:11094–9. doi: 10.1073/pnas.0501770102. [DOI] [PMC free article] [PubMed] [Google Scholar]
- 4.Beeton C, Wulff H, Standifer NE, Azam P, Mullen KM, Pennington MW, et al. Kv1. 3 channels are a therapeutic target for T cell-mediated autoimmune diseases. Proc Natl Acad Sci U S A. 2006;103:17414–9. doi: 10.1073/pnas.0605136103. [DOI] [PMC free article] [PubMed] [Google Scholar]
- 5.Kyttaris VC, Wang Y, Juang YT, Weinstein A, Tsokos GC. Increased levels of NF-ATc2 differentially regulate CD154 and IL-2 genes in T cells from patients with systemic lupus erythematosus. J Immunol. 2007;178:1960–6. doi: 10.4049/jimmunol.178.3.1960. [DOI] [PubMed] [Google Scholar]
- 6.Andre P, Prasad KSS, Denis CV, He M, Papalia JM, Hynes RO, et al. CD40L stabilizes arterial thrombi by a β3 integrin-dependent mechanism. Nat Med. 2002;8:247–52. doi: 10.1038/nm0302-247. [DOI] [PubMed] [Google Scholar]
- 7.Chen Y, Chen J, Xiong Y, Da Q, Xu Y, Jiang X, et al. Internalization of CD40 regulates its signal transduction in vascular endothelial cells. Biochem Biophys Res Commun. 2006;345:106–17. doi: 10.1016/j.bbrc.2006.04.034. [DOI] [PubMed] [Google Scholar]
- 8.Nicolaou SA, Szigligeti P, Neumeier L, Lee SM, Duncan HJ, Kant SK, et al. Altered dynamics of Kv1. 3 channel compartmentalization in the immunological synapse in systemic lupus erythematosus. J Immunol. 2007;179:346–56. doi: 10.4049/jimmunol.179.1.346. [DOI] [PMC free article] [PubMed] [Google Scholar]
- 9.Lewis RS. Calcium signaling mechanisms in T lymphocytes. Annu Rev Immunol. 2001;19:497–521. doi: 10.1146/annurev.immunol.19.1.497. [DOI] [PubMed] [Google Scholar]
- 10.Cahalan MD, Chandy KG. The functional network of ion channels in T lymphocytes. Immunol Rev. 2009;231:59–87. doi: 10.1111/j.1600-065X.2009.00816.x. [DOI] [PMC free article] [PubMed] [Google Scholar]
- 11.Wulff H, Calabresi PA, Allie R, Yun S, Pennington M, Beeton C, et al. The voltage-gated Kv1. 3 K+ channel in effector memory T cells as new target for MS. J Clin Invest. 2003;111:1703–13. doi: 10.1172/JCI16921. [DOI] [PMC free article] [PubMed] [Google Scholar]
- 12.Nicolaou SA, Neumeier L, Takimoto K, Lee SM, Duncan HJ, Kant SK, et al. Differential calcium signaling and Kv1. 3 trafficking to the immunological synapse in systemic lupus erythematosus. Cell Calcium. 2010;47:19–28. doi: 10.1016/j.ceca.2009.11.001. [DOI] [PMC free article] [PubMed] [Google Scholar]
- 13.George Chandy K, Wulff H, Beeton C, Pennington M, Gutman GA, Cahalan MD. K+ channels as targets for specific immunomodulation. Trends in Pharmacol Sci. 2004;25:280–9. doi: 10.1016/j.tips.2004.03.010. [DOI] [PMC free article] [PubMed] [Google Scholar]
- 14.Kalman K, Pennington MW, Lanigan MD, Nguyen A, Rauer H, Mahnir V, et al. ShK-Dap22, a potent Kv1. 3-specific immunosuppressive polypeptide. J Biol Chem. 1998;273:32697–707. doi: 10.1074/jbc.273.49.32697. [DOI] [PubMed] [Google Scholar]
- 15.Matheu MP, Beeton C, Garcia A, Chi V, Rangaraju S, Safrina O, et al. Imaging of effector memory T cells during a delayed-type hypersensitivity reaction and suppression by Kv1. 3 channel block. Immunity. 2008;29:602–14. doi: 10.1016/j.immuni.2008.07.015. [DOI] [PMC free article] [PubMed] [Google Scholar]
- 16.Varga Z, Gurrola-Briones G, Papp F, Rodriguez de la Vega RC, Pedraza-Alva G, Tajhya RB, et al. Vm24, a natural immunosuppressive peptide, potently and selectively blocks Kv1. 3 potassium channels of human T cells. Mol Pharmacol. 2012;82:372–82. doi: 10.1124/mol.112.078006. [DOI] [PMC free article] [PubMed] [Google Scholar]
- 17.Peer D, Park EJ, Morishita Y, Carman CV, Shimaoka M. Systemic leukocyte-directed siRNA delivery revealing cyclin D1 as an anti-inflammatory target. Science. 2008;319:627–30. doi: 10.1126/science.1149859. [DOI] [PMC free article] [PubMed] [Google Scholar]
- 18.Hobo W, Novobrantseva T, Fredrix H, Wong J, Milstein S, Epstein-Barash H, et al. Improving dendritic cell vaccine immunogenicity by silencing PD-1 ligands using siRNA-lipid nanoparticles combined with antigen mRNA electroporation. Cancer Immunol Immunother. 2013;62:285–97. doi: 10.1007/s00262-012-1334-1. [DOI] [PMC free article] [PubMed] [Google Scholar]
- 19.Dolina JS, Sung S-SJ, Novobrantseva TI, Nguyen TM, Hahn YS. Lipidoid nanoparticles nontaining PD-L1 siRNA delivered in vivo enter Kupffer cells and enhance NK and CD8+ T cell-mediated hepatic antiviral immunity. Mol Ther Nucleic Acids. 2013;2:e72. doi: 10.1038/mtna.2012.63. [DOI] [PMC free article] [PubMed] [Google Scholar]
- 20.Schallon A, Synatschke CV, Jérôme V, Müller AHE, Freitag R. Nanoparticulate nonviral agent for the effective delivery of pDNA and siRNA to differentiated cells and primary human T lymphocytes. Biomacromolecules. 2012;13:3463–74. doi: 10.1021/bm3012055. [DOI] [PubMed] [Google Scholar]
- 21.Hajdu P, Varga Z, Pieri C, Panyi G, Gaspar R., Jr Cholesterol modifies the gating of Kv1. 3 in human T lymphocytes. Pflugers Arch. 2003;445:674–82. doi: 10.1007/s00424-002-0974-y. [DOI] [PubMed] [Google Scholar]
- 22.Kuras Z, Yun YH, Chimote AA, Neumeier L, Conforti L. KCa3. 1 and TRPM7 channels at the uropod regulate migration of activated human T cells. PLoS One. 2012;7:e43859. doi: 10.1371/journal.pone.0043859. [DOI] [PMC free article] [PubMed] [Google Scholar]
- 23.Baba Y, Hayashi K, Fujii Y, Mizushima A, Watarai H, Wakamori M, et al. Coupling of STIM1 to store-operated Ca2+ entry through its constitutive and inducible movement in the endoplasmic reticulum. Proc Natl Acad Sci U S A. 2006;103:16704–9. doi: 10.1073/pnas.0608358103. [DOI] [PMC free article] [PubMed] [Google Scholar]
- 24.Loughrey H, Bally MB, Cullis PR. A non-covalent method of attaching antibodies to liposomes. Biochim Biophys Acta. 1987;901:157–60. doi: 10.1016/0005-2736(87)90267-7. [DOI] [PubMed] [Google Scholar]
- 25.Chimote AA, Kuras Z, Conforti L. Disruption of kv1. 3 channel forward vesicular trafficking by hypoxia in human T lymphocytes. J Biol Chem. 2012;287:2055–67. doi: 10.1074/jbc.M111.274209. [DOI] [PMC free article] [PubMed] [Google Scholar]
- 26.Beeton C, Pennington MW, Wulff H, Singh S, Nugent D, Crossley G, et al. Targeting effector memory T cells with a selective peptide inhibitor of Kv1. 3 channels for therapy of autoimmune diseases. Mol Pharmacol. 2005;67:1369–81. doi: 10.1124/mol.104.008193. [DOI] [PMC free article] [PubMed] [Google Scholar]
- 27.Stephan MT, Stephan SB, Bak P, Chen J, Irvine DJ. Synapse-directed delivery of immunomodulators using T-cell-conjugated nanoparticles. Biomaterials. 2012;33:5776–87. doi: 10.1016/j.biomaterials.2012.04.029. [DOI] [PMC free article] [PubMed] [Google Scholar]
Associated Data
This section collects any data citations, data availability statements, or supplementary materials included in this article.
Supplementary Materials
Supp. Table 1 Diameter of bare and functionalized NPs (in nm, mean ± SEM, n=4)
SEM images of multi-lamellar lipid particles. The images show aggregation of lipid particles with the size distribution of 0.5 micron to 1 micron.
Ca2+ response in TM/T cells with and without CD45RO-NPs. Time-course of thapsigargin-induced Ca2+ influx through CRAC channels in resting T cells pre-incubated (24h) with (A) or without (B) CD45RO-NPs. Indo-1 fluorescence in (A) was detected with flow cytometer only in the Alexa488 gated subpopulation (NPs were labeled with SAV-Alexa488). Ca2+ response was monitored in the absence (grey line) or presence (black line) of 10 nM ShK.