

Abstract
Numerous recent studies have found that overweight adults experience lower overall mortality than those who are underweight, normal-weight, or obese. These highly publicized findings imply that overweight may be the optimal weight category for overall health via its association with longevity—a conclusion with important public health implications. In this study, the authors examined the association between body mass index (BMI; (weight (kg)/height (m)2)) and 3 markers of health risks using a nationally representative sample of US adults aged 20–80 years (n = 9,255) from the National Health and Nutrition Examination Survey (2005–2008). Generalized additive models, a type of semiparametric regression model, were used to examine the relations between BMI and biomarkers of inflammation, metabolic function, and cardiovascular function (C-reactive protein, hemoglobin A1c, and high density lipoprotein cholesterol, respectively). The association between BMI and each biomarker was monotonic, with higher BMI being consistently associated with worse health risk profiles at all ages, in contrast to the U-shaped relation between BMI and mortality. Prior results suggesting that the overweight BMI category corresponds to the lowest risk of mortality may not be generalizable to indicators of health risk.
Keywords: adult; biological markers; body mass index; health; overweight; models, statistical; mortality
More than 34% of US adults are overweight, and an additional 34% are obese (1, 2). Given these proportions, an accurate understanding of how body weight is associated with health risks is crucial to clinical and public health policy. Numerous recent studies have examined the association between body weight and mortality (3–6). These studies have consistently shown a U-shaped relation, with both obese (>30) and underweight (<18.5) body mass index (BMI) categories being associated with higher mortality relative to normal weight (BMI 18.5–25). Somewhat surprisingly, investigators have consistently reported that overweight adults (BMI 25–30) have mortality risks no higher or lower than those of normal-weight adults (3, 5–12).
In the popular press, the association between overweight and lower mortality risk has been generalized to health outcomes, with the implication that carrying extra body weight does not impair health. For instance, an article in the New York Times noted that “chubby… may be the new healthy” when reporting on a recent study of BMI and mortality (13). These mortality findings and their portrayal by the media have attracted wide attention because of their seeming contradiction with clinical and public health messages about the health risks associated with excess body weight.
Researchers have long suspected that the observed U-shaped relation between BMI and mortality risk is a result of confounding by preexisting disease (sometimes referred to as reverse causality) or by sarcopenia (loss of lean body mass), typical among the elderly (14–17). Low BMI then may not reflect a healthy body composition but instead may be a consequence of weight loss from disease processes leading to death. This confounding may create a spurious association between lower body weight and a higher risk of death (16, 18). To address the “reverse causality” problem, investigators have sometimes eliminated study subjects who died within the first several years after measurement of body weight (15, 19). These adjustments often shifted the nadir of the mortality curve so that the optimal BMI for longevity was in the normal range (12, 16, 18, 20–22). However, this solution has come at the expense of excluding a large portion of the study sample, limiting the generalizability of the findings.
Moreover, mortality studies focus attention on the upper tail of the age distribution and thus do not inform health processes across the full adult life span. If we are interested in understanding the effects of body weight on health, a better approach is to examine the association of excess body weight and health measures. The health consequences of obesity are known to include a range of negative outcomes, from potentially life-threatening conditions such as diabetes or cardiovascular disease (23–25) to nonfatal chronic illness such as osteoarthritis (26, 27) to physical limitations and poor general health (11, 28–33). The findings for overweight, relative to normal-weight adults, are mixed. Some investigators have reported a higher prevalence of chronic conditions among the overweight (34, 35), while others have found the health of overweight adults to be on par with that of their normal-weight counterparts (9, 31, 36).
Compared with the larger literature on health outcomes, relatively few studies have examined the relation between BMI and biologic indicators of health status. Biomarkers offer a powerful tool for investigating both clinical and subclinical health deficits, unbiased by reporting problems associated with specific health conditions. Many biomarkers are strong predictors of chronic diseases, which in turn are major causes of morbidity and mortality. For instance, C-reactive protein (CRP) is a marker of systemic inflammation associated with cardiovascular disease, a leading cause of death in the United States (6, 37). Several studies have shown that obese adults have higher CRP levels (38, 39) than adults in the normal weight range. There have been fewer studies on the nature of the association between BMI and other biomarkers, such as high density lipoprotein (HDL) cholesterol and hemoglobin A1c (HbA1c), a marker of long-term blood glucose regulation. Some studies have found that excess body weight is associated with lower HDL cholesterol (higher levels are considered healthier) (40), while others have found no association (41). The association between overweight and obesity and elevated HbA1c was found in some studies (42) but not in others (43). Importantly, none of these projects evaluated the shape of the association but only compared normal-weight subjects with overweight and/or obese subjects.
Additionally, existing literature has not adequately taken account of age. While all previous studies controlled for age, the investigators did not evaluate the possibility that age moderates the association between weight and health outcomes. Body weight changes systematically as people age (44, 45), and its effect on health may also change across the life course (20, 46). Understanding how age modifies the BMI-health association could help reconcile the late-in-life findings that higher body weights are optimal for longevity with the general perception that elevated body weight is associated with worse health outcomes during the majority of adulthood.
To further shed light on this issue, we analyzed the shape of the association between BMI and biomarkers, shifting the focus from mortality to objectively measured indicators of health risk. We present results for 3 biologic risk indicators (CRP, glycated hemoglobin or HbA1c, and HDL cholesterol) in a nationally representative sample of US adults aged 20–80 years. We employed semiparametric models to determine the shape of the BMI-biomarker associations without imposing any constraints on the form and also examined whether the association varied with age. We found that in all age and sex groups, a higher BMI was associated with a worse biologic risk profile. These findings will help inform clinical and public health discourse about the health risks associated with body weight throughout the life span.
MATERIALS AND METHODS
Data
Data source.
These analyses were based on the 2 most recent waves of the National Health and Nutrition Examination Survey (NHANES), NHANES 2005–2006 and NHANES 2007–2008 (47). These ongoing surveys collect an extensive range of demographic, socioeconomic, lifestyle, and health-related data, including biologic measures, through a combined household interview and separate medical examination. NHANES is representative of the noninstitutionalized civilian US population. The survey uses a stratified, multistage probability sampling design with an oversample of African Americans, Hispanics, low-income persons, and older adults. During the examination, blood and urine are collected for laboratory analysis. The response rate for the NHANES interview was approximately 80% in 2005–2006 and 78% in 2007–2008; approximately 96% of the persons interviewed also participated in the subsequent medical examination (48).
Analytic sample.
We defined the analytic sample as adults aged 20–80 years who were not pregnant at the time of the examination (n = 10,173). Of this group, 408 adults (4.0%) were missing the weight and height information necessary to calculate BMI, as well as data on all 3 biomarkers used in the study. An additional 119 (1.1%) were missing data for biomarkers only, and 144 (1.4%) were missing data for BMI only. We conducted bivariate and multivariate analyses to determine patterns of missingness, especially insofar as it could bias our findings. Persons missing BMI or biomarker data were significantly more likely to be older, non-Hispanic black, and in poor health and to have been interviewed by proxy. No significant differences in missingness were found by marital status, education, or income. These results suggested that most missingness occurred among the elderly and ill, perhaps because they were unable to undergo the examination or portions of it (such as standing up for height measurement or stepping on the scale for weight measurement). Finally, we restricted the BMI range to 15–45 because of the sparse data at the extremes of the BMI distribution, relative to the data needs of our semiparametric models. This restriction excluded 247 adults (2.6% of the sample) with extremely low or high BMIs, resulting in a final sample size of 9,255 observations. Results with the extreme BMI values included were virtually identical to those presented (with less precision in the tails) and are available upon request.
Measures
The key predictor, BMI, was calculated from height and weight using the formula BMI = (weight (kg)/height (m)2). Height and weight were measured by trained technicians during the medical examination.
Outcomes included 1) high-sensitivity CRP (mg/dL) as a marker of inflammation, 2) HbA1c (%) as a marker of metabolic risk, and 3) HDL cholesterol (mg/dL) as a marker of cardiovascular risk. CRP data were log-transformed to correct for their right-skewed distribution. Details of the laboratory procedures have been published elsewhere (49).
Control variables included age, sex, and smoking status. Age was modeled continuously in years; sex was dichotomous (female = 1). Smoking status was included as a key potential confounder of the BMI-biomarker relation: It is known to be significantly related to lower BMI, as well as elevated levels of CRP and HbA1c (50–52). Smoking status was trichotomized as current smoker, past smoker, or never smoker (reference).
Analysis
We employed generalized additive models (GAMs) to examine the shape of the association between BMI and the biomarkers (53). The GAM is an extension of the generalized linear model in that 1 or more predictors may be specified using a smooth function f(x). The general structure of the GAM is , where a smooth monotonic link function g(y) transforms the expected value of y, E(μ), to η. The variable y can follow any distribution from the exponential family—for instance, for sensitivity analyses with dichotomized biomarkers, y had a binomial distribution and the link function g(μ) was logit(μ), or log(μ/(1 − μ)).
The key advantage of GAMs over generalized linear models is the flexibility derived from the data-driven shape of the f(x) functions, which avoids the need for a priori assumptions about the shape of a predictor's effect (54, 55), such as the stepwise linear or quadratic functional form typically used to specify the effect of BMI on health outcomes. The functions f(x) can be constructed using various spline smoothing functions; the thin plate regression spline smoother was used here (56). Computation of this smoother is efficient, and the position of the knots is estimated directly from the data. The smoothness for the functions f(x) is calculated with the goal of optimal balance between the fit to the data and excessive “wiggliness” of the functions.
The GAM is estimated using a penalized maximum likelihood procedure—usually iteratively reweighted least squares (57), although alternative fitting approaches can be used (57, 58). After the basis for the function f(x) is chosen, the GAM reduces to a generalized linear model, which makes it possible to conduct standard model-building and diagnostic procedures. Model fit is estimated using generalized cross-validation based on the prediction mean square error, the unbiased risk estimator, and Akaike's Information Criterion. Confidence intervals for parameter estimates are calculated using the posterior distribution of the model coefficients. The P values associated with model coefficients are estimated from the covariance matrix of  , with the caveat that they are marginally smaller than expected under the null hypothesis (57). Models can be compared using an approximation to the likelihood ratio test for nested models.
GAMs can accommodate the “interaction” of 2 or more predictors, in a way that is conceptually comparable to interactions in generalized linear models. The joint smooth function can be specified in different ways; we used tensor product smooths, optimal for predictors measured on different scales—for instance, age and BMI. In this paper, results are presented graphically as line graphs showing the estimated function for BMI with 95% Bayesian credible (confidence) intervals. Web Figure 1, which is posted on the Journal’s Web site (http://aje.oxfordjournals.org/), presents the results in terms of 3-dimensional plots characterizing the effect of the interaction between BMI and age on each outcome. Results in all models were stratified by sex. The software package R 2.9.2 (R Foundation for Statistical Computing, Vienna, Austria) was used to fit the models. Descriptive data on the sample were adjusted for the sampling design.
We conducted numerous sensitivity analyses to assess the stability of our findings to alternative model specifications. We fitted logistic models of dichotomized biomarkers using standard cutpoints for elevated levels (59). The results were nearly identical to those shown here and are available upon request. We also fitted models controlling for key sociodemographic characteristics—race/ethnicity and education—as potential confounders of the BMI-biomarker relations, as well as models stratified by race/ethnicity, education, and smoking status. In all of these models, we found the same pattern of a monotonic relation between BMI and each biomarker. Additionally, we fitted models of biomarkers that controlled for self-reported physical activity level and use of cholesterol-lowering medication. Physical activity was significantly associated with all biomarkers in the expected direction for both men and women, but it did not affect the shape of the BMI-biomarker associations. Similarly, use of cholesterol-lowering medication, reported by 9% of the analysis sample, was significantly associated with HDL cholesterol but did not affect the BMI-HDL cholesterol relation. All results are available upon request.
RESULTS
Table 1 summarizes the characteristics of the analysis sample. Roughly half were women; the average age of respondents was 46 years. The average BMI was approximately 28. The mean CRP level was somewhat higher for women than for men (0.44 mg/dL vs. 0.34 mg/dL); the mean HbA1c level for both sexes was approximately 5.5%. The mean HDL cholesterol level was 48 mg/dL for men and 59 mg/dL for women.
Table 1.
Characteristics of the Analysis Sample (n = 9,255), National Health and Nutrition Examination Survey, 2005–2008a
| Men |
Women |
|||
| Mean (SE) | % | Mean (SE) | % | |
| Proportion of total | 49.5 | 50.5 | ||
| Age, years | 45.4 (0.44) | 47.1 (0.39) | ||
| Body mass indexb | 28.2 (0.12) | 27.9 (0.14) | ||
| Obese (body mass index ≥30) | 31.6 | 33.5 | ||
| Race/ethnicity | ||||
| Non-Hispanic white | 70.5 | 71.2 | ||
| Non-Hispanic black | 10.5 | 11.5 | ||
| Hispanic | 13.4 | 11.4 | ||
| Other | 5.7 | 5.9 | ||
| Education | ||||
| Less than high school | 19.7 | 17.5 | ||
| Completion of high school | 25.7 | 24.6 | ||
| More than high school | 54.6 | 57.9 | ||
| Current smoker | 35.6 | 22.9 | ||
| Biomarkers | ||||
| C-reactive protein, mg/dL | 0.34 (0.01) | 0.44 (0.01) | ||
| Hemoglobin A1c, % | 5.52 (0.02) | 5.49 (0.02) | ||
| High density lipoprotein cholesterol, mg/dL | 47.54 (0.29) | 58.62 (0.49) | ||
Abbreviation: SE, standard error.
Data were adjusted for the sampling design.
Calculated as 703 × (weight (pounds)/height (inches)2).
Figure 1 shows GAM results from models of the 3 biomarkers (CRP, HbA1c, and HDL cholesterol) as a function of BMI for men, adjusted for age (column 1) and age plus smoking status (column 2). Along the x-axis is a rug plot showing the density distribution of BMI in the sample; the line shows the estimated functional form for BMI, and the shaded area indicates the 95% confidence interval. Among men, the age-adjusted association between BMI and each biomarker was generally monotonic from the lowest BMIs through the highest BMIs, in the expected direction: positive for CRP and HbA1c and negative for HDL cholesterol. An exception to this pattern was found at the lowest BMIs for CRP, suggesting a slight increase in systemic inflammation among men with the lowest BMIs. This pattern was due to the higher proportion of smokers at the lowest body weights. Since smokers tend to have both lower BMIs and higher CRP levels, adjusting for smoking (column 2) resulted in a monotonic BMI-CRP association across the full range of body weights. Besides this change, controlling for smoking had little observable effect on the BMI-biomarker associations.
Figure 1.
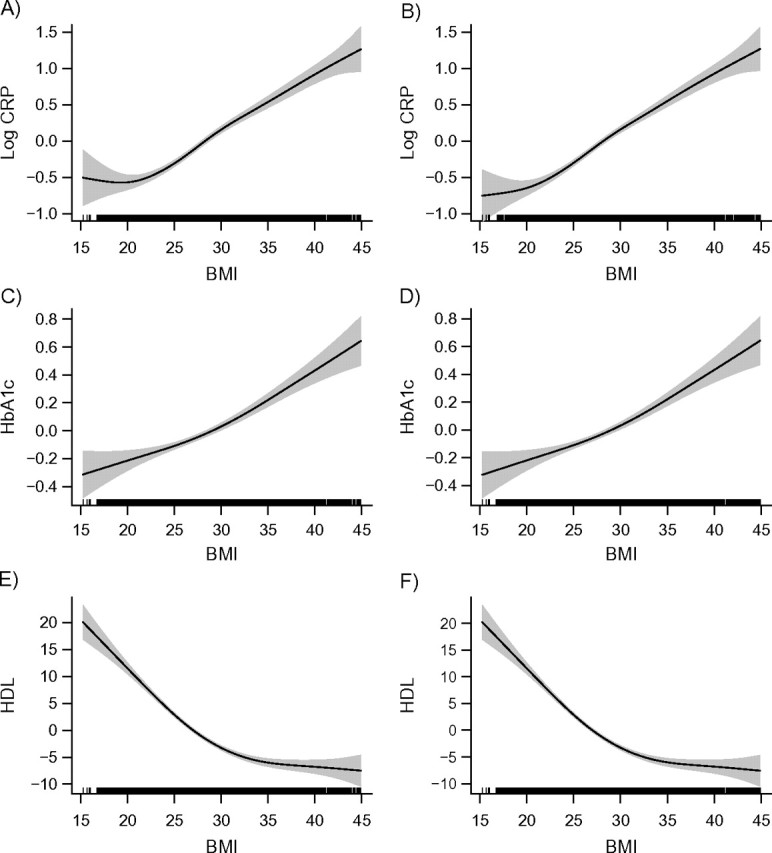
Relations between body mass index (BMI; weight (kg)/height (m)2) and selected biomarkers for men, National Health and Nutrition Examination Survey, 2005–2008. Results were adjusted for age only (left column) and for age plus smoking (right column). The first row (plots A and B) shows relations between BMI and C-reactive protein (CRP); the second row (plots C and D) shows relations between BMI and hemoglobin A1c (HbA1c); and the third row (plots E and F) show relations between BMI and high density lipoprotein cholesterol (HDL). The solid lines represent the estimated relation, and the shaded areas represent the 95% confidence interval.
Figure 2 presents GAM results from comparable models for women. The patterns were similar to those of men; the association between BMI and each biomarker was monotonic across the entire BMI range rather than U-shaped. Controlling for smoking, a potential confounder of the relation, had no effect on the BMI-biomarker associations.
Figure 2.
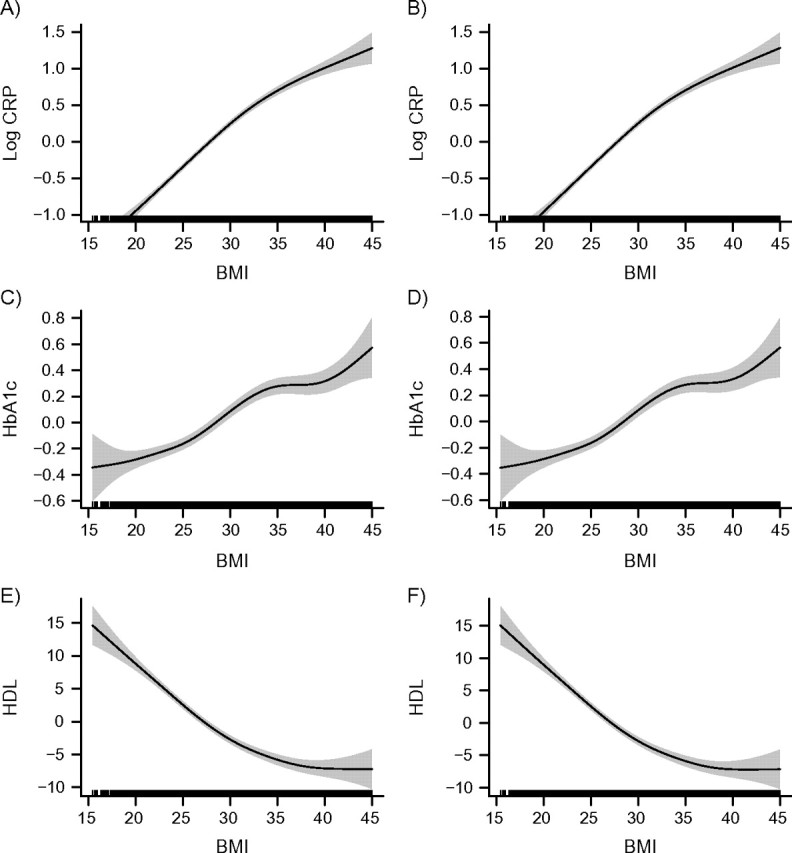
Relations between body mass index (BMI; weight (kg)/height (m)2) and selected biomarkers for women, National Health and Nutrition Examination Survey, 2005–2008. Results were adjusted for age only (left column) and for age plus smoking (right column). The first row (plots A and B) shows relations between BMI and C-reactive protein (CRP); the second row (plots C and D) shows relations between BMI and hemoglobin A1c (HbA1c); and the third row (plots E and F) show relations between BMI and high density lipoprotein cholesterol (HDL). The solid lines represent the estimated relation, and the shaded areas represent the 95% confidence interval.
Web Figure 1 shows models of the 3 biomarkers with an “interaction” between BMI and age. These models are important for attempting to reconcile the monotonic biomarker results with the U-shaped association in prior mortality studies: They allow us to see whether the monotonic association observed in Figures 1 and 2 persists through the full life span. The plots show BMI on the x-axis, age on the y-axis, and each individual biomarker on the vertical z-axis. The height of the surface indicates the relative level of a biomarker for each BMI-age combination. The plots show that age modified the association between BMI and biomarkers to some degree. The effect of BMI on HbA1c became stronger with age among both sexes, while the effect on log CRP became somewhat less pronounced at older ages. However, we found no evidence of a U-shaped association between BMI and any biomarker at any age—the association was attenuated or became stronger but remained monotonic in the expected direction across all ages, both sexes, and all examined biomarkers.
DISCUSSION
In this study, we employed a semiparametric modeling approach to examine the shape of the association between BMI and adult health as measured by 3 biologic risk indicators: CRP, HbA1c, and HDL cholesterol. The question was motivated in part by the methodological debate over the U-shaped pattern observed between BMI and mortality. Our results showed that the mortality findings do not generalize to biologic markers of health risk. Each biomarker exhibited a clear, strong, monotonic relation with body weight from the lowest BMIs to the highest BMIs, such that higher weight was associated with a worse risk profile across the full adult life span.
The monotonic relation between BMI, a proxy for the amount of body fat, and different indicators of biologic risk is consistent with known causal mechanisms for relations between adipose tissue and physiologic processes. Excess body weight influences the onset and progression of chronic illness through multiple pathways. Adipose tissue is an active organ, releasing nonesterified fatty acids, hormones (including leptin), glycerol, proinflammatory cytokines (such as tumor necrosis factor-α), interleukin-6, and other bioactive mediators (60, 61). Among overweight persons, the increased number of adipocytes results in higher levels of these factors, which change the regulation of basic physiologic processes. For instance, obese persons tend to be insulin-resistant, which leads to higher levels of circulating glucose. Among nondiabetic persons, pancreatic β cells release an increased amount of insulin to overcome the insulin resistance. Diabetes develops when the pancreas is unable to release enough insulin to compensate for the resistance (62). Paradoxically, the nonesterified fatty acids released by the adipose tissue impair the functioning of the pancreatic β cells, creating a negative feedback loop leading to diabetes. Obesity and insulin resistance are further related to alterations in plasma lipids such as HDL cholesterol (63). An additional pathway between BMI and cardiovascular disease involves the proinflammatory cytokines tumor necrosis factor-α and interleukin-6, whose expression is up-regulated by adipose tissue (63).
Several factors might explain the different association between BMI and biomarkers versus BMI and mortality. First, while the measured biomarkers are predictive of many diseases that can result in death, the associations may be stronger for morbidity and mortality that occurs in middle age and early old age (64). Previous work has shown that high BMI is more strongly associated with mortality under age 75 years (65), while the majority of deaths in the United States occur at ages over 75 years (66). With increasing age, the associations of biomarkers such as higher cholesterol, glucose, and blood pressure with mortality weaken (67). Thus, our findings capture the monotonic relation between adiposity and biomarkers that persists through the adult life course, but the biomarkers are poor predictors of mortality at older ages.
Additionally, while biomarkers are predictive of chronic diseases that may lead to death, the links among the 3 factors are probably complicated by numerous effects like genetic predisposition toward specific conditions, medical interventions, or comorbid conditions. The complex associations may lead to a differently shaped population-level association between BMI and biomarkers as compared with BMI and all-cause mortality. The complex links among BMI, health risks, health outcomes, and mortality are consistent with evidence that while obesity-related mortality has decreased over time, obesity-related disability due to various chronic conditions has increased (32).
It is also possible that the association between BMI and overall health is indeed monotonic at all ages, while the U-shaped relation observed with mortality risk is an artifact of confounding (reverse causality), as suggested by previous investigators (15, 16). Thus, in addition to better understanding the relation between BMI and health risks and conditions, researchers should address the reverse causality problem by analyzing long-term changes in body weight and their effect on mortality. A recent study of weight trajectories among older men (68) is a good step in this direction.
The main strength of this study was its semiparametric analytic approach, which allowed the data to fully inform the shape of the BMI-biomarker association. Additionally, all outcome variables, as well as BMI, were objectively measured, eliminating the threat of bias caused by systematic differences in health assessment that are inherent in self-reported data. The use of biomarkers allowed us to detect health differences in all age groups, including younger adults, for whom clinical symptoms of diseases are relatively rare. Finally, the nationally representative data permit generalizing the findings to the general US adult population from early adulthood to old age.
The use of BMI as a proxy for adiposity is an important limitation of the study. BMI cannot distinguish between fat and lean tissue, introducing measurement error. BMI also does not distinguish between types of adipose tissue; compared with subcutaneous fat, visceral body fat within the abdominal cavity is more metabolically active (69) and may be more closely related to the analyzed biomarkers.
These findings imply that obesity researchers should exercise caution when interpreting mortality findings in broader health terms. From a public health perspective, the findings suggest that even moderate levels of overweight may indicate worse health risk profiles than lower body weights, with potentially important implications for chronic disease and health-related quality of life. More research is needed to reconcile the contradictory findings of BMI's U-shaped relation with mortality versus its monotonic relation with biomarkers. Two promising avenues include examination of the shape of the association between BMI and major health conditions and longitudinal studies of BMI trajectories among older adults and mortality.
Supplementary Material
Acknowledgments
Author affiliations: Department of Sociology, College of Arts and Sciences, University of Wyoming, Laramie, Wyoming (Anna Zajacova); Department of Epidemiology and Biostatistics, The City University Institute for Demographic Research, Hunter College, City University of New York, New York, New York (Jennifer Beam Dowd); Department of Sociology, College of Arts and Sciences, University of Michigan, Ann Arbor, Michigan (Sarah A. Burgard); Department of Epidemiology, School of Public Health, University of Michigan, Ann Arbor, Michigan (Sarah A. Burgard); and Population Studies Center, Institute for Social Research, University of Michigan, Ann Arbor, Michigan (Sarah A. Burgard).
This work was supported by a Faculty Grant-in-Aid from the University of Wyoming to Dr. Anna Zajacova.
The authors thank Dr. Christine Himes for helpful comments on an earlier version of the manuscript.
Conflict of interest: none declared.
Glossary
Abbreviations
- BMI
body mass index
- CRP
C-reactive protein
- GAM
generalized additive model
- HbA1c
hemoglobin A1c
- HDL
high density lipoprotein
- NHANES
National Health and Nutrition Examination Survey
References
- 1.Hedley AA, Ogden CL, Johnson CL, et al. Prevalence of overweight and obesity among US children, adolescents, and adults, 1999–2002. JAMA. 2004;291(23):2847–2850. doi: 10.1001/jama.291.23.2847. [DOI] [PubMed] [Google Scholar]
- 2.Flegal KM, Carroll MD, Ogden CL, et al. Prevalence and trends in obesity among US adults, 1999–2008. JAMA. 2010;303(3):235–241. doi: 10.1001/jama.2009.2014. [DOI] [PubMed] [Google Scholar]
- 3.Berraho M, Nejjari C, Raherison C, et al. Body mass index, disability, and 13-year mortality in older French adults. J Aging Health. 2010;22(1):68–83. doi: 10.1177/0898264309349422. [DOI] [PubMed] [Google Scholar]
- 4.Whitlock G, Lewington S, Sherliker P, et al. Body-mass index and cause-specific mortality in 900 000 adults: collaborative analyses of 57 prospective studies. Prospective Studies Collaboration. Lancet. 2009;373(9669):1083–1096. doi: 10.1016/S0140-6736(09)60318-4. [DOI] [PMC free article] [PubMed] [Google Scholar]
- 5.Mehta NK, Chang VW. Mortality attributable to obesity among middle-aged adults in the United States. Demography. 2009;46(4):851–872. doi: 10.1353/dem.0.0077. [DOI] [PMC free article] [PubMed] [Google Scholar]
- 6.Flegal KM, Graubard BI, Williamson DF, et al. Cause-specific excess deaths associated with underweight, overweight, and obesity. JAMA. 2007;298(17):2028–2037. doi: 10.1001/jama.298.17.2028. [DOI] [PubMed] [Google Scholar]
- 7.Flicker L, McCaul KA, Hankey GJ, et al. Body mass index and survival in men and women aged 70 to 75. J Am Geriatr Soc. 2010;58(2):234–241. doi: 10.1111/j.1532-5415.2009.02677.x. [DOI] [PubMed] [Google Scholar]
- 8.Flegal KM, Graubard BI, Williamson DF, et al. Excess deaths associated with underweight, overweight, and obesity. JAMA. 2005;293(15):1861–1867. doi: 10.1001/jama.293.15.1861. [DOI] [PubMed] [Google Scholar]
- 9.Janssen I. Morbidity and mortality risk associated with an overweight BMI in older men and women. Obesity (Silver Spring) 2007;15(7):1827–1840. doi: 10.1038/oby.2007.217. [DOI] [PubMed] [Google Scholar]
- 10.The Diverse Populations Collaboration. Body mass index and mortality. A meta-analysis based on person-level data from twenty-six observational studies. Ann Epidemiol. 2005;15(2):87–97. doi: 10.1016/j.annepidem.2004.05.012. [DOI] [PubMed] [Google Scholar]
- 11.Troiano RP, Frongillo EA, Jr, Sobal J, et al. The relationship between body weight and mortality: a quantitative analysis of combined information from existing studies. Int J Obes Relat Metab Disord. 1996;20(1):63–75. [PubMed] [Google Scholar]
- 12.Adams KF, Schatzkin A, Harris TB, et al. Overweight, obesity, and mortality in a large prospective cohort of persons 50 to 71 years old. N Engl J Med. 2006;355(8):763–778. doi: 10.1056/NEJMoa055643. [DOI] [PubMed] [Google Scholar]
- 13.Kolata G. Chubby gets a second look. New York Times. 2007;Nov 11:D4. [Google Scholar]
- 14.Allison DB, Heo M, Flanders DW, et al. Examination of “early mortality exclusion” as an approach to control for confounding by occult disease in epidemiologic studies of mortality risk factors. Am J Epidemiol. 1997;146(8):672–680. doi: 10.1093/oxfordjournals.aje.a009334. [DOI] [PubMed] [Google Scholar]
- 15.Greenberg JA. Biases in the mortality risk versus body mass index relationship in the NHANES-1 Epidemiologic Follow-Up Study. Int J Obes Relat Metab Disord. 2001;25(7):1071–1078. doi: 10.1038/sj.ijo.0801648. [DOI] [PubMed] [Google Scholar]
- 16.Greenberg JA. Correcting biases in estimates of mortality attributable to obesity. Obesity (Silver Spring) 2006;14(11):2071–2079. doi: 10.1038/oby.2006.242. [DOI] [PubMed] [Google Scholar]
- 17.Bales CW, Ritchie CS. Sarcopenia, weight loss, and nutritional frailty in the elderly. Annu Rev Nutr. 2002;22:309–323. doi: 10.1146/annurev.nutr.22.010402.102715. [DOI] [PubMed] [Google Scholar]
- 18.Greenberg JA, Fontaine K, Allison DB. Putative biases in estimating mortality attributable to obesity in the US population. Int J Obes (Lond) 2007;31(9):1449–1455. doi: 10.1038/sj.ijo.0803615. [DOI] [PubMed] [Google Scholar]
- 19.Zhang X, Shu XO, Chow WH, et al. Body mass index at various ages and mortality in Chinese women: impact of potential methodological biases. Int J Obes (Lond) 2008;32(7):1130–1136. doi: 10.1038/ijo.2008.63. [DOI] [PMC free article] [PubMed] [Google Scholar]
- 20.Freedman DM, Ron E, Ballard-Barbash R, et al. Body mass index and all-cause mortality in a nationwide US cohort. Int J Obes (Lond) 2006;30(5):822–829. doi: 10.1038/sj.ijo.0803193. [DOI] [PubMed] [Google Scholar]
- 21.Zamboni M, Mazzali G, Zoico E, et al. Health consequences of obesity in the elderly: a review of four unresolved questions. Int J Obes (Lond) 2005;29(9):1011–1029. doi: 10.1038/sj.ijo.0803005. [DOI] [PubMed] [Google Scholar]
- 22.Gronniger JT. A semiparametric analysis of the relationship of body mass index to mortality. Am J Public Health. 2006;96(1):173–178. doi: 10.2105/AJPH.2004.045823. [DOI] [PMC free article] [PubMed] [Google Scholar]
- 23.Wannamethee SG, Shaper AG, Walker M. Overweight and obesity and weight change in middle aged men: impact on cardiovascular disease and diabetes. J Epidemiol Community Health. 2005;59(2):134–139. doi: 10.1136/jech.2003.015651. [DOI] [PMC free article] [PubMed] [Google Scholar]
- 24.Gregg EW, Cheng YJ, Cadwell BL, et al. Secular trends in cardiovascular disease risk factors according to body mass index in US adults. JAMA. 2005;293(15):1868–1874. doi: 10.1001/jama.293.15.1868. [DOI] [PubMed] [Google Scholar]
- 25.Mokdad AH, Ford ES, Bowman BA, et al. Prevalence of obesity, diabetes, and obesity-related health risk factors, 2001. JAMA. 2003;289(1):76–79. doi: 10.1001/jama.289.1.76. [DOI] [PubMed] [Google Scholar]
- 26.Himes CL. Obesity, disease, and functional limitation in later life. Demography. 2000;37(1):73–82. [PubMed] [Google Scholar]
- 27.Felson DT, Anderson JJ, Naimark A, et al. Obesity and knee osteoarthritis. The Framingham Study. Ann Intern Med. 1988;109(1):18–24. doi: 10.7326/0003-4819-109-1-18. [DOI] [PubMed] [Google Scholar]
- 28.Bender R, Trautner C, Spraul M, et al. Assessment of excess mortality in obesity. Am J Epidemiol. 1998;147(1):42–48. doi: 10.1093/oxfordjournals.aje.a009365. [DOI] [PubMed] [Google Scholar]
- 29.Durazo-Arvizu R, McGee D, Li Z, et al. Establishing the nadir of the body mass index-mortality relationship: a case study. J Am Stat Assoc. 1997;92(440):312–319. [PubMed] [Google Scholar]
- 30.Ferraro KF, Booth TL. Age, body mass index, and functional illness. J Gerontol B Psychol Sci Soc Sci. 1999;54(6):S339–S348. doi: 10.1093/geronb/54b.6.s339. [DOI] [PubMed] [Google Scholar]
- 31.Ferraro KF, Su YP, Gretebeck RJ, et al. Body mass index and disability in adulthood: a 20-year panel study. Am J Public Health. 2002;92(5):834–840. doi: 10.2105/ajph.92.5.834. [DOI] [PMC free article] [PubMed] [Google Scholar]
- 32.Alley DE, Chang VW. The changing relationship of obesity and disability, 1988–2004. JAMA. 2007;298(17):2020–2027. doi: 10.1001/jama.298.17.2020. [DOI] [PubMed] [Google Scholar]
- 33.Vincent HK, Vincent KR, Lamb KM. Obesity and mobility disability in the older adult. Obes Rev. 2010;11(8):568–579. doi: 10.1111/j.1467-789X.2009.00703.x. [DOI] [PubMed] [Google Scholar]
- 34.Must A, Spadano J, Coakley EH, et al. The disease burden associated with overweight and obesity. JAMA. 1999;282(16):1523–1529. doi: 10.1001/jama.282.16.1523. [DOI] [PubMed] [Google Scholar]
- 35.Katz DA, McHorney CA, Atkinson RL. Impact of obesity on health-related quality of life in patients with chronic illness. J Gen Intern Med. 2000;15(11):789–796. doi: 10.1046/j.1525-1497.2000.90906.x. [DOI] [PMC free article] [PubMed] [Google Scholar]
- 36.Diehr P, O'Meara ES, Fitzpatrick A, et al. Weight, mortality, years of healthy life, and active life expectancy in older adults. J Am Geriatr Soc. 2008;56(1):76–83. doi: 10.1111/j.1532-5415.2007.01500.x. [DOI] [PMC free article] [PubMed] [Google Scholar]
- 37.Ridker PM, Hennekens CH, Buring JE, et al. C-reactive protein and other markers of inflammation in the prediction of cardiovascular disease in women. N Engl J Med. 2000;342(12):836–843. doi: 10.1056/NEJM200003233421202. [DOI] [PubMed] [Google Scholar]
- 38.Visser M, Bouter LM, McQuillan GM, et al. Elevated C-reactive protein levels in overweight and obese adults. JAMA. 1999;282(22):2131–2135. doi: 10.1001/jama.282.22.2131. [DOI] [PubMed] [Google Scholar]
- 39.Ford ES. Body mass index, diabetes, and C-reactive protein among U.S. adults. Diabetes Care. 1999;22(12):1971–1977. doi: 10.2337/diacare.22.12.1971. [DOI] [PubMed] [Google Scholar]
- 40.Mora S, Lee IM, Buring JE, et al. Association of physical activity and body mass index with novel and traditional cardiovascular biomarkers in women. JAMA. 2006;295(12):1412–1419. doi: 10.1001/jama.295.12.1412. [DOI] [PubMed] [Google Scholar]
- 41.Alexander CM, Landsman PB, Grundy SM. The influence of age and body mass index on the metabolic syndrome and its components. Diabetes Obes Metab. 2008;10(3):246–250. doi: 10.1111/j.1463-1326.2006.00695.x. [DOI] [PubMed] [Google Scholar]
- 42.Boeing H, Weisgerber UM, Jeckel A, et al. Association between glycated hemoglobin and diet and other lifestyle factors in a nondiabetic population: cross-sectional evaluation of data from the Potsdam cohort of the European Prospective Investigation into Cancer and Nutrition Study. Am J Clin Nutr. 2000;71(5):1115–1122. doi: 10.1093/ajcn/71.5.1115. [DOI] [PubMed] [Google Scholar]
- 43.Koga M, Matsumoto S, Saito H, et al. Body mass index negatively influences glycated albumin, but not glycated hemoglobin, in diabetic patients. Endocr J. 2006;53(3):387–391. doi: 10.1507/endocrj.k05-137. [DOI] [PubMed] [Google Scholar]
- 44.Muñoz AM, Falque-Madrid L, Zambrano RC, et al. Basic anthropometry and health status of elderly: findings of the Maracaibo Aging Study. J Aging Health. 2010;22(2):242–261. doi: 10.1177/0898264309357444. [DOI] [PubMed] [Google Scholar]
- 45.Heo M, Faith MS, Mott JW, et al. Hierarchical linear models for the development of growth curves: an example with body mass index in overweight/obese adults. Stat Med. 2003;22(11):1911–1942. doi: 10.1002/sim.1218. [DOI] [PubMed] [Google Scholar]
- 46.Kulminski AM, Arbeev KG, Kulminskaya IV, et al. Body mass index and nine-year mortality in disabled and nondisabled older U.S. individuals. J Am Geriatr Soc. 2008;56(1):105–110. doi: 10.1111/j.1532-5415.2007.01494.x. [DOI] [PubMed] [Google Scholar]
- 47.National Center for Health Statistics. National Health and Nutrition Examination Survey Data 2007–2008. Hyattsville, MD: National Center for Health Statistics; 2010. [Google Scholar]
- 48.National Center for Health Statistics. Unweighted Response Rates for NHANES 2005–2006 by Age and Gender. Hyattsville, MD: National Center for Health Statistics; 2006. ( http://www.cdc.gov/nchs/data/nhanes/response_rates_cps/RRT0506MF.pdf). (Accessed May 20, 2010) [Google Scholar]
- 49.National Center for Health Statistics. National Health and Nutrition Examination Survey. NHANES 2007–2008 Laboratory Files. Hyattsville, MD: National Center for Health Statistics; 2010. ( http://www.cdc.gov/nchs/nhanes/nhanes2007-2008/lab07_08.htm). (Accessed May 20, 2010) [Google Scholar]
- 50.Bermudez EA, Rifai N, Buring JE, et al. Relation between markers of systemic vascular inflammation and smoking in women. Am J Cardiol. 2002;89(9):1117–1119. doi: 10.1016/s0002-9149(02)02284-1. [DOI] [PubMed] [Google Scholar]
- 51.Albanes D, Jones DY, Micozzi MS, et al. Associations between smoking and body weight in the US population: analysis of NHANES II. Am J Public Health. 1987;77(4):439–444. doi: 10.2105/ajph.77.4.439. [DOI] [PMC free article] [PubMed] [Google Scholar]
- 52.Gulliford MC, Ukoumunne OC. Determinants of glycated haemoglobin in the general population: associations with diet, alcohol and cigarette smoking. Eur J Clin Nutr. 2001;55(7):615–623. doi: 10.1038/sj.ejcn.1601233. [DOI] [PubMed] [Google Scholar]
- 53.Hastie T, Tibshirani R. Generalized additive models (with discussion) Stat Sci. 1986;1(3):297–318. [Google Scholar]
- 54.Stone CJ. Additive regression and other nonparametric models. Ann Stat. 1985;13(2):689–705. [Google Scholar]
- 55.Hastie T, Tibshirani R. Generalized Additive Models. London, United Kingdom: Chapman & Hall Ltd; 1990. [Google Scholar]
- 56.Wood SN. Thin plate regression splines. J R Stat Soc Series B. 2003;65(1):95–114. [Google Scholar]
- 57.Wood SN. Generalized Additive Models: An Introduction with R. Boca Raton, FL: Chapman & Hall, Inc; 2006. [Google Scholar]
- 58.Andersen R. Nonparametric methods for modeling nonlinearity in regression analysis. Annu Rev Sociol. 2009;35(1):67–85. [Google Scholar]
- 59.Seeman T, Merkin SS, Crimmins E, et al. Education, income and ethnic differences in cumulative biological risk profiles in a national sample of US adults: NHANES III (1988–1994) Soc Sci Med. 2008;66(1):72–87. doi: 10.1016/j.socscimed.2007.08.027. [DOI] [PMC free article] [PubMed] [Google Scholar]
- 60.Calle EE, Kaaks R. Overweight, obesity and cancer: epidemiological evidence and proposed mechanisms. Nat Rev Cancer. 2004;4(8):579–591. doi: 10.1038/nrc1408. [DOI] [PubMed] [Google Scholar]
- 61.Vincent HK, Taylor AG. Biomarkers and potential mechanisms of obesity-induced oxidant stress in humans. Int J Obes (Lond) 2006;30(3):400–418. doi: 10.1038/sj.ijo.0803177. [DOI] [PubMed] [Google Scholar]
- 62.Kahn SE, Hull RL, Utzschneider KM. Mechanisms linking obesity to insulin resistance and type 2 diabetes. Nature. 2006;444(7121):840–846. doi: 10.1038/nature05482. [DOI] [PubMed] [Google Scholar]
- 63.Marinou K, Tousoulis D, Antonopoulos AS, et al. Obesity and cardiovascular disease: from pathophysiology to risk stratification. Int J Cardiol. 2010;138(1):3–8. doi: 10.1016/j.ijcard.2009.03.135. [DOI] [PubMed] [Google Scholar]
- 64.Peeters A, Barendregt JJ, Willekens F, et al. Obesity in adulthood and its consequences for life expectancy: a life-table analysis. Ann Intern Med. 2003;138(1):24–32. doi: 10.7326/0003-4819-138-1-200301070-00008. [DOI] [PubMed] [Google Scholar]
- 65.Stevens J, Cai J, Pamuk ER, et al. The effect of age on the association between body-mass index and mortality. N Engl J Med. 1998;338(1):1–7. doi: 10.1056/NEJM199801013380101. [DOI] [PubMed] [Google Scholar]
- 66.Arias E. United States Life Tables, 2006. Hyattsville, MD: National Center for Health Statistics; 2010. [PubMed] [Google Scholar]
- 67.van Vliet P, Oleksik AM, van Heemst D, et al. Dynamics of traditional metabolic risk factors associate with specific causes of death in old age. J Gerontol A Biol Sci Med Sci. 2010;65(5):488–494. doi: 10.1093/gerona/glq014. [DOI] [PubMed] [Google Scholar]
- 68.Alley DE, Metter EJ, Griswold ME, et al. Changes in weight at the end of life: characterizing weight loss by time to death in a cohort study of older men. Am J Epidemiol. 2010;172(5):558–565. doi: 10.1093/aje/kwq168. [DOI] [PMC free article] [PubMed] [Google Scholar]
- 69.Wajchenberg BL. Subcutaneous and visceral adipose tissue: their relation to the metabolic syndrome. Endocr Rev. 2000;21(6):697–738. doi: 10.1210/edrv.21.6.0415. [DOI] [PubMed] [Google Scholar]
Associated Data
This section collects any data citations, data availability statements, or supplementary materials included in this article.