Background: G0S2 has been shown in vitro to be a selective inhibitor of ATGL.
Results: Adipose overexpression of G0S2 leads to decreased adipose lipolysis, impeded fatty acid utilization upon fasting, and impaired cold-induced thermogenesis.
Conclusion: G0S2 plays a major role in regulating global lipid and energy metabolism.
Significance: Adipose lipolysis and fatty acid liberation is crucial for energy homeostasis.
Keywords: Adipose Tissue, Adipose Tissue Metabolism, Adipose Triglyceride Lipase, Energy Metabolism, Fatty Acid, Fatty Acid Metabolism, Fatty Acid Oxidation, Lipolysis, Metabolism, G0S2
Abstract
Biochemical and cell-based studies have identified the G0S2 (G0/G1 switch gene 2) as a selective inhibitor of the key intracellular triacylglycerol hydrolase, adipose triglyceride lipase. To better understand the physiological role of G0S2, we constructed an adipose tissue-specific G0S2 transgenic mouse model. In comparison with wild type animals, the transgenic mice exhibited a significant increase in overall fat mass and a decrease in peripheral triglyceride accumulation. Basal and adrenergically stimulated lipolysis was attenuated in adipose explants isolated from the transgenic mice. Following fasting or injection of a β3-adrenergic agonist, in vivo lipolysis and ketogenesis were decreased in G0S2 transgenic mice when compared with wild type animals. Consequently, adipose overexpression of G0S2 prevented the “switch” of energy substrate from carbohydrates to fatty acids during fasting. Moreover, G0S2 overexpression promoted accumulation of more and larger lipid droplets in brown adipocytes without impacting either mitochondrial morphology or expression of oxidative genes. This phenotypic change was accompanied by defective cold adaptation. Furthermore, feeding with a high fat diet caused a greater gain of both body weight and adiposity in the transgenic mice. The transgenic mice also displayed a decrease in fasting plasma levels of free fatty acid, triglyceride, and insulin as well as improved glucose and insulin tolerance. Cumulatively, these results indicate that fat-specific G0S2 overexpression uncouples adiposity from insulin sensitivity and overall metabolic health through inhibiting adipose lipolysis and decreasing circulating fatty acids.
Introduction
Regulation of adipose tissue mass is a dynamic relationship between the processes of lipid synthesis and lipid catabolism. It has been well demonstrated through previous studies that disruptions in these mechanisms contribute to a variety of health disparities, including diabetes and obesity, in addition to other metabolically linked conditions (1–4). Alterations in lipid metabolism not only impact adiposity but have been shown to have a profound effect on peripheral lipid accumulation and global energy homeostasis. The recent identification of the rate-limiting enzyme involved in triglyceride (TG)3 hydrolysis, adipose triglyceride lipase (ATGL), has added an important mechanistic step with regards to adipose lipolysis and substrate release from lipid droplets in adipose tissue for energy metabolism (4–9). Loss of ATGL through knock-out mouse models has demonstrated the essential functions of ATGL in adipose tissue lipolysis and whole body lipid and energy metabolism (4, 10–16). These efforts have established a vital role for ATGL and, more importantly, adipose tissue in general for modulating energy metabolism and homeostasis on a global scale.
The mechanisms governing ATGL-mediated lipolysis remain to be fully elucidated. Existing evidence suggests that protein-protein interactions with comparative gene identification 58, also known as ABHD5 (α/β hydrolase domain-containing protein 5), can stimulate ATGL at the post-translational level (17). Previous reports have attributed the activation of ATGL in adipocytes to the dissociation of comparative gene identification 58 from the lipid droplet coat protein perilipin (18–21). Recently, our laboratory identified a protein encoded by G0S2 (G0/G1 switch gene 2) as a selective inhibitor of ATGL. The G0S2 was originally identified in blood mononuclear cells during pharmaceutical stimulation of the G0 to G1 transition of the cell cycle (22, 23). Its cellular function remained unclear until Bachner and colleagues (24) identified G0S2 as an adipocyte-specific factor. These early discoveries led to the characterization of G0S2 as a lipolytic inhibitor in adipocytes by Yang et al. (25–27) and confirmed by later studies. Further investigation has revealed that G0S2 blocks lipolysis through direct interaction and inhibition of the TG hydrolase activity of ATGL. Binding between the hydrophobic domain of G0S2 and the patatin-like domain of ATGL results in lipolytic inhibition in 3T3-L1 adipocytes (25).
To better understand and characterize the impact of G0S2 in vivo, we have designed transgenic mice that overexpress G0S2 specifically in adipose tissue. Utilizing this model, we were able to evaluate the significance of adipose G0S2 on global energy and lipid metabolism in both chow and high fat diet (HFD) fed states. Moreover, this model provides a novel system to compare similarities and differences between loss of ATGL and gain of G0S2 in adipose tissue.
EXPERIMENTAL PROCEDURES
Generation of aP2-G0S2 Transgenic Mice
To generate transgenic mice with tissue-specific overexpression of G0S2 in adipose tissue, the murine G0S2 cDNA sequence (GenBankTM accession no. NM_008059) was subcloned into a pBluescript II SK(+) vector containing a 5.4-kB adipocyte fatty acid (FA) binding protein (aP2) promoter and a poly(A) tail (Addgene). G0S2 was PCR-amplified to add a 5′-Kozak sequence along with SmaI and NotI restriction enzyme sites on the 5′ and 3′ ends, respectively. The Kozak-G0S2 sequence was inserted downstream of the aP2 promoter and upstream of the poly(A) tail using the NotI and SmaI restriction sites. The completed aP2-G0S2-poly(A) construct was confirmed by sequencing. Through the University of Michigan Transgenic Animal Model Core, the transgene fragment was released by SalI digestion, purified, and microinjected into fertilized eggs of C57BL/6J mice. Tail DNA genotyping revealed that seven independent transgenic founder lines were obtained, of which five lines underwent successful germ-line transmission.
Animal Experiments
aP2-G0S2 transgenic mice and wild type C57BL/6J littermates were maintained in the animal facility at Mayo Clinic Arizona. All mice were given free access to water and were fed a standard chow diet (test diet no. 5001, 10% calories as fat). For experiments, female and male mice at 12 weeks of age were used unless otherwise indicated. For HFD treatment, male wild type and aP2-G0S2 mice were started on a 60% HFD (Research Diets, D12492, 60% calories as fat) at 4 weeks of age. Experiments were conducted following 8 weeks of HFD feeding, mice were 12 weeks of age unless otherwise noted at the time of experiments.
Body Composition Analysis
Body composition data for 12-week-old female and male wild type and aP2-G0S2 mice was acquired by whole body metabolic profiling using a Bruker minispec Body Composition Analyzer (Brunker Corp.) through the Mayo Clinic Mouse Metabolic Phenotyping Laboratory.
Whole Body Metabolic Phenotyping
Wild type and aP2-G0S2 female mice, 14 weeks old, were individually placed in a PhenoMaster metabolic cage unit (TSE Systems) for a multi-day (5 days) study starting at 7 AM on day 1. Standard 12-h light (7 AM to 7 PM) and dark cycles (7 PM to 7 AM) were maintained throughout the experiment. Mice were allowed an environmental acclamation period of 24 h prior to starting the experiment at 7 AM on day 2. Mice were fasted for a period of 16 h starting at 5 PM on day 2 before food was reintroduced. With the exception of the fasting period, mice were allowed to eat and drink ad libitum. Fat and carbohydrate oxidation were calculated as reported previously (28).
Cold Exposure
Wild type and aP2-G0S2 male mice, 12 weeks old, were individually housed for ∼3 days prior to cold exposure. On the morning of the cold exposure, mice were fasted for 2 h. Following this brief fasting, mice were placed at 4° C, and body temperature was recorded rectally at the indicated time points. After completion of the experiment, mice were sacrificed, and tissue was collected for further evaluation. During the experiment, mice were fasted but had ad libitum access to water. All aspects of this experiment were thoroughly reviewed and approved by the Mayo Clinic Institutional Care and Use Committee.
Glucose and Insulin Tolerance Tests
For the glucose and insulin tolerance tests, mice were fasted overnight and 6 h, respectively. Glucose (2 g/kg body weight) or insulin (1 unit/kg body weight) was injected intraperitoneally into the mice. Blood glucose levels were monitored at indicated times from the tail vein using a glucometer (Freestyle; Abbott Diabetes Care).
In Vivo and ex Vivo Lipolysis Measurement
For in vivo lipolysis, 12-week-old female wild type and aP2-G0S2 mice were injected with 0.1 mg/kg CL316243 (Tocris Bioscience), a β3-adrenergic receptor agonist or saline as a vehicle control. Plasma was collected at 1 h post-injection. As a measure of lipolysis, free FAs (FFAs) (Wako) and glycerol (ZenBio) levels were quantified using enzyme colorimetric assays according to the manufacturer's instructions. For ex vivo lipolysis, gonadal fat pads isolated from 6-h-fasted mice were cut into 50-mg pieces and incubated at 37 °C in 1.0 ml of phenol red-free DMEM containing 2% FA-free BSA with or without 1 μm isoproterenol for 2 h. FA and glycerol release was measured in aliquots from incubation media, and tissue weight was used to normalize the lipolytic signals.
Plasma Parameter Analysis
Plasma glucose (Wako), total TG (Thermo Fisher Scientific), total cholesterol (Wako), FFAs (Wako), adiponectin (Invitrogen), leptin (Invitrogen), insulin (Invitrogen), and 3-hydroxybutyrate (Stanbio Laboratory) were measured using enzyme colorimetric assays according to the manufacturers' instructions. Organ TG content was assayed using total TG assay kit (Thermo) following extraction and purification by thin-layer chromatography.
Immunoblotting
White and brown adipose tissue samples were homogenized in a buffer containing 50 mm Tris-HCl (pH 8.0), 135 mm NaCl, 10 mm NaF, 1% Nonidet P-40, 0.1% SDS, 0.5% sodium deoxycholate, 1.0 mm EDTA, 5% glycerol, and 1× Complete protease inhibitor mixture (Roche Applied Science). The lysates were clarified by centrifugation at 20,000 × g for 10 min and then mixed with equal volume of 2× SDS sample buffer. Equivalent amounts of protein were resolved using one-dimensional SDS-PAGE, followed by transfer to nitrocellulose membranes. Individual proteins were blotted with primary antibodies against G0S2 (generated against the residues 43–103 of murine G0S2) (25) and β-actin (Sigma-Aldrich) at appropriate dilutions. Peroxide-conjugated secondary antibodies (Jackson ImmunoResearch Laboratories) were incubated with the membrane at a dilution of (1:5000). The signals were then visualized by chemiluminescence (Supersignal ECL, Pierce) using an ImageQuant LAS4000 imaging system (GE Healthcare Life Sciences).
Histology and Electron Microscopy
White (WAT) and brown adipose tissue (BAT) was isolated as indicated and subsequently fixed in 4% microscopy grade paraformaldehyde (Bio-Rad) for 20 min. Fixed tissues were then given to the Mayo Clinic Arizona Histology Core for paraffin embedding, sectioning, and hemotoxylin & eosin staining. Stained tissues were then evaluated and imaged on an Olympus light microscope. Image analysis and quantification was performed using ImageJ software (NIH Open Source) measuring a minimum of 400 cells per sample. For electron microscopy, isolated BAT and WAT were fixed in 2% glutaraldehyde in 0.1 m PB (phosphate buffer) (pH 7.2) at 4 °C overnight and then postfixed in 1% OsO4, dehydrated through a graded series of ethanols, and embedded in Spurr resin. Ultrathin sections (100 nm or 0.1 μm) mounted on 200-mesh copper grids were stained with lead citrate and observed under a JEOL JEM-1400 transmission electron microscope.
RNA Extraction and Real-time PCR
Total RNA was isolated from mouse adipose tissue samples using the RNeasy Plus Mini Kit (Qiagen) according to the manufacturer's instructions. cDNA was synthesized from total RNA by LongRange reverse transcriptase (Qiagen) with oligo d(T). The resulting cDNA was subjected to real-time PCR analysis with SYBGreen PCR Master Mix (Invitrogen) on an Applied Biosystems 7900 HT Real-time PCR System. Specific primers for the genes for interest were acquired through GeneBank. Data were analyzed using the comparative cycle threshold (ΔΔCt) method. The mRNA levels of genes normalized to β-actin were presented as relative to the wild type control. PCR product specificity was verified by postamplification melting curve analysis and by running products on an agarose gel.
Insulin Signaling
Mice at 12 weeks of age were intraperitoneally injected with 1 uni/kg insulin after 8 weeks of HFD feeding. Mice were then sacrificed 5 min post injection and liver, and gonadal WAT were collected and immediately frozen. Tissue samples were homogenized as described above and resolved on one-dimensional SDS-PAGE. Membranes were probed as mentioned using antibodies against β-actin (Sigma-Aldrich), Akt, phospho-Akt serine 473 and phospho-Gsk3 α/β (all from Cell Signaling). Band intensity/densitometric measurement was accomplished using ImageJ software (NIH Open Source). A total of five mice per group were used for quantification.
Statistical Analysis
Values are expressed as mean ± S.E. Statistical significance was evaluated by two-tailed unpaired Student's t test. Differences were considered significant at p < 0.05.
RESULTS
Characterization of G0S2 Overexpression in Adipose Tissue
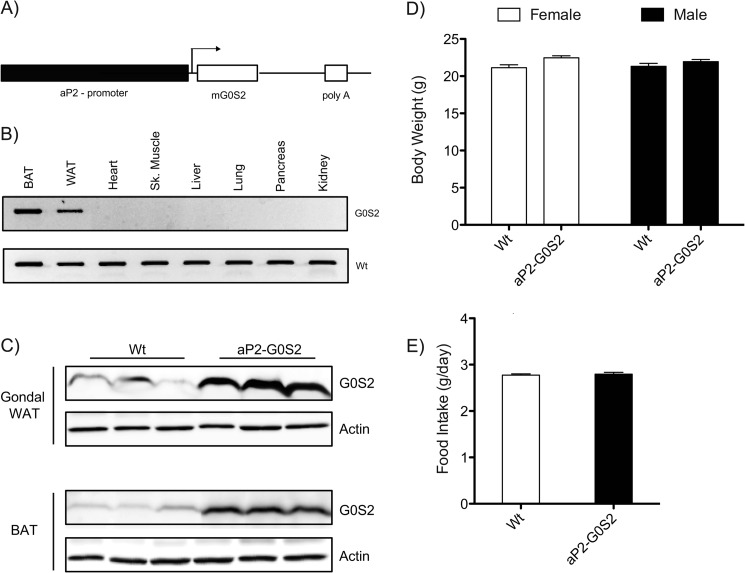
To elucidate the in vivo function of G0S2 in adipose tissue and its impact on global energy metabolism, we generated adipose tissue-specific G0S2 transgenic mice utilizing the aP2 promoter (Fig. 1A). Following germ-line transmission and subsequent breeding, adipose expression of the aP2-G0S2 transgene was verified by reverse transcriptase PCR and direct amplification from various tissues using specific primers (Fig. 1B). Additionally, immunoblotting analysis of isolated gonadal WAT showed a >5-fold increase in G0S2 protein expression in aP2-G0S2 transgenic mice over endogenous levels in wild type animals (Fig. 1C). There was also a marked increase in G0S2 expression in interscapular BAT from transgenic mice (Fig. 1C). These results demonstrate successful adipose-specific overexpression of G0S2.
FIGURE 1.
Transgenic overexpression of G0S2 in adipose tissue. A, targeting scheme for tissue-specific G0S2 overexpression. B, cDNA synthesized from various tissues in aP2-G0S2 mice was subjected to PCR using aP2-G0S2 primers. PCR products were resolved on a 1.5% agarose gel by electrophoresis. C, immunoblotting analysis of G0S2 expression in gonadal WAT and BAT. β-Actin was used as a loading control. D, body weight measurement on 12-week-old male and female mice (n = 8 per group). E, food intake as measured by g/day (n = 12 per group) from 12-week-old female mice.
Adipose Overexpression of G0S2 Alters the Whole Body Metabolic Profile
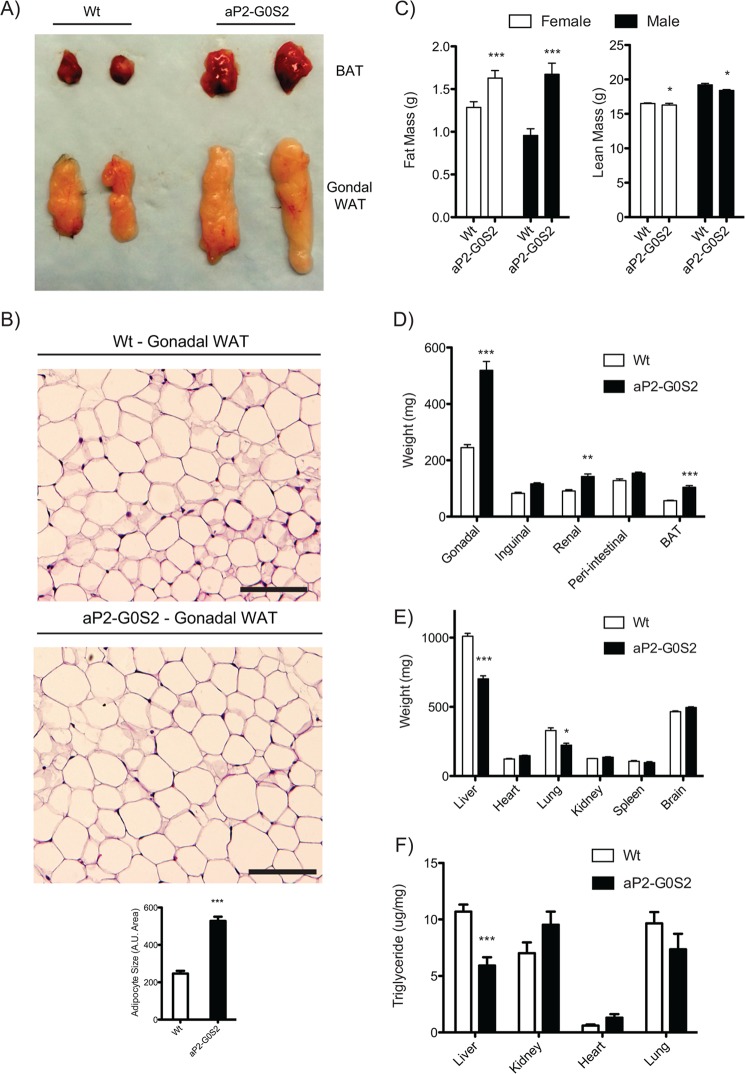
Phenotypically, transgenic expression of G0S2 elicited no changes in body weight or food intake (Fig. 1, D and E). aP2-G0S2 mice showed significant increases in both WAT and BAT size as demonstrated by gross dissection (Fig. 2A). Histological evaluation of gonadal WAT isolated from aP2-G0S2 mice showed an over 2-fold increase in adipocyte size (Fig. 2B). Furthermore, adipose overexpression of G0S2 significantly augmented whole body fat mass (Fig. 2C) and increased weight of gonadal, perirenal, peri-intestinal, and interscapular by 53, 36, 18, and 46%, respectively (Fig. 2D). In addition, gene expression analysis of oxidative and proinflammatory genes in WAT from transgenic mice showed no significant alterations when compared with wild type animals (Table 1). Because adipose tissue functions as a buffer for whole-body lipid flux, we also evaluated the weight and TG content of other organs/tissues. As shown in Fig. 2E, adipose overexpression of G0S2 decreased liver and lung weight by ∼30%. Likewise, there was a significant 45% reduction in liver TG content following a 6-h fasting period (Fig. 2F). These findings suggest that overexpression of G0S2 in adipose tissue caused an increase in cumulative fat mass and a concomitant reduction in liver TG levels.
FIGURE 2.
Metabolic characterization of aP2-G0S2 transgenic mice. A, gross dissection and imaging of gonadal WAT and BAT isolated from wild type and aP2-G0S2 mice (12 weeks of age). B, H&E staining of gonadal WAT from wild type and aP2-G0S2 mice and adipocyte size quantification (n = 400 cells). A.U., arbitrary units. Scale bar, 100 μm. C, non-fasting fat and lean mass as measured by NMR (n = 8 per group). 12-Week-old male mice were fasted for 6 h following NMR analysis and subjected to gross fat pad (D), organ weight (E), and organ TG content (F) measurements (n = 8 per group). *, p < 0.05; ***, p < 0.001.
TABLE 1.
Gene expression in BAT and WAT from aP2-G0S2 mice
qPCR results are from aP2-G0S2 mice and represented as relative expression compared with wild type. All tissues were normalized to β-actin expression as described under “Experimental Procedures” (n = 7 per gene/per group).
| Gene ID | Gene function | Fed | 6-h fast |
|---|---|---|---|
| White adipose tissue | |||
| IL-6 | Proinflammatory | 1.016 ± 0.36 | 1.024 ± 0.50 |
| TNF-α | Proinflammatory | 1.003 ± 0.76 | 1.029 ± 0.26 |
| CCL2 | Proinflammatory | 1.028 ± 0.42 | 1.034 ± 0.81 |
| CCL3 | Proinflammatory | 0.980 ± 0.71 | 0.961 ± 0.30 |
| CCL7 | Proinflammatory | 1.043 ± 0.15 | 1.016 ± 0.37 |
| CXCL1 | Proinflammatory | 1.033 ± 0.38 | 1.072 ± 0.39 |
| Socs3 | Proinflammatory | 1.008 ± 0.28 | 1.005 ± 0.31 |
| Socs5 | Proinflammatory | 0.994 ± 0.08 | 0.996 ± 0.20 |
| CD68 | Macrophage marker | 1.017 ± 0.09 | 1.051 ± 0.31 |
| CD116 | Macrophage marker | 1.017 ± 0.32 | 0.991 ± 0.36 |
| CoxIV | Metabolic/oxidative | 1.046 ± 0.28 | 1.009 ± 0.28 |
| PGC-1α | Metabolic/oxidative | 0.940 ± 0.24 | 0.982 ± 0.31 |
| CPT1β | Metabolic/oxidative | 0.982 ± 0.34 | 0.933 ± 0.12 |
| PPAR-α | Metabolic/oxidative | 1.040 ± 0.47 | 0.999 ± 0.23 |
| UCP-1 | Metabolic/oxidative | 1.173 ± 0.10 | 0.886 ± 0.27 |
| Brown adipose tissue | |||
| IL-6 | Proinflammatory | 1.059 ± 0.27 | 1.054 ± 0.32 |
| TNF-α | Proinflammatory | 1.073 ± 0.71 | 1.028 ± 0.37 |
| CCL2 | Proinflammatory | 1.049 ± 0.15 | 1.075 ± 0.33 |
| CCL3 | Proinflammatory | 1.014 ± 0.29 | 0.988 ± 0.17 |
| CCL7 | Proinflammatory | 1.021 ± 0.27 | 1.053 ± 0.13 |
| CXCL1 | Proinflammatory | 1.045 ± 0.06 | 1.023 ± 0.29 |
| Socs3 | Proinflammatory | 1.045 ± 0.17 | 1.052 ± 0.32 |
| Socs5 | Proinflammatory | 1.042 ± 0.34 | 1.021 ± 0.10 |
| CD68 | Macrophage marker | 1.056 ± 0.53 | 0.994 ± 0.15 |
| CD116 | Macrophage marker | 1.039 ± 0.23 | 0.971 ± 0.22 |
| CoxIV | Metabolic/oxidative | 1.019 ± 0.20 | 1.000 ± 0.03 |
| PGC-1α | Metabolic/oxidative | 0.973 ± 0.18 | 0.967 ± 0.15 |
| CPT1β | Metabolic/oxidative | 0.985 ± 0.29 | 0.988 ± 0.07 |
| PPAR-α | Metabolic/oxidative | 0.986 ± 0.11 | 1.006 ± 0.04 |
| UCP-1 | Metabolic/oxidative | 0.985 ± 0.08 | 0.954 ± 0.24 |
aP2-G0S2 Transgenic Mice Have Altered Adipose Lipolysis and FA Flux to Liver
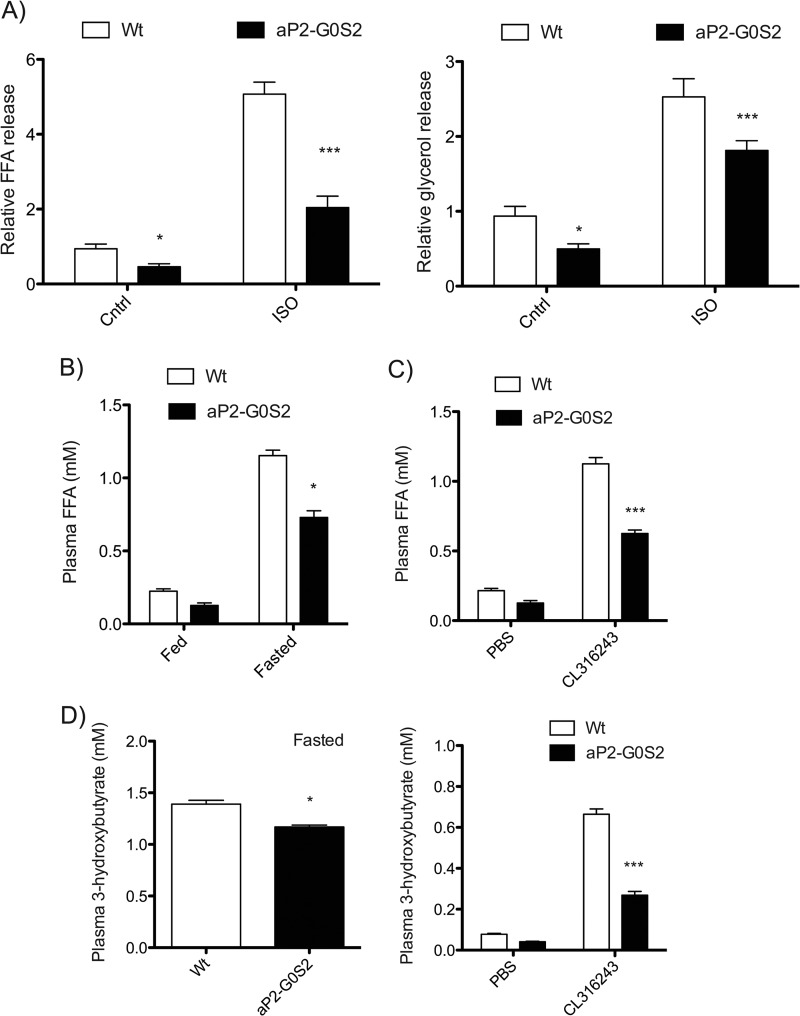
Because the gross phenotype associated with the aP2-G0S2 transgenic mice was consistent with aberrant lipolysis, we decided to directly assay lipolytic activity in WAT. Isolated fat pads were cultured in the presence or absence of the β-adrenergic agonist isoproterenol to induce lipolysis. Fat pads from aP2-G0S2 mice showed a 51 and 61% decrease in basal and stimulated FA release, respectively (Fig. 3A). Similar decreases in glycerol release were also observed. In accordance, the plasma FFA levels were reduced by 44 and 40%, respectively, in the transgenic mice when compared with those in wild type animals (Fig. 3B). In response to the injection of CL316243 compound, an agonist for β3-adrenergic receptor that is predominantly expressed in adipose tissue, there was a near 5-fold increase in plasma FFA level in wild type mice (Fig. 3C). However, the plasma FFA concentration was reduced by 45% in the transgenic mice injected with CL316243. These findings demonstrate that adipose overexpression of G0S2 results in reduced lipolytic capacity and subsequent FA release.
FIGURE 3.
Lipolytic characterization of aP2-G0S2 transgenic mice. A, FFA and glycerol release from gonadal WAT isolated from 14-week-old female mice and cultured ex vivo in the presence or absence of isoproterenol (ISO). The data are representative of three independent experiments. B, plasma FFA levels from 12-week-old male mice at the basal state and following a 6-h fast. C, plasma FFA levels 1-h post CL316243 injection (n = 8 per group). D, plasma 3-hydroxybutyrate levels in 12-week-old male mice after 6-h fasting (left) and 1-h post CL316243 injection (right) (n = 8 per group). *, p < 0.05; ***, p < 0.001. Cntrl, control.
During fasting, increased adipose lipolysis and hepatic FA uptake results in increased FA oxidation and ketone body production in liver. To this end, we found that the plasma levels of a major ketone body 3-hydroxybutyrate were lower in aP2-G0S2 mice by 11% under fasting and by 60% upon CL-316246 injection in the fed state (Fig. 3D). Therefore, by quenching adipose lipolysis during fasting, adipose-specific overexpression of G0S2 was able to diminish the FA flux from adipose tissue to liver, thereby inhibiting subsequent hepatic FA oxidation and ketogenesis.
Transgenic Expression of G0S2 Prevents a Metabolic Switch during Fasting
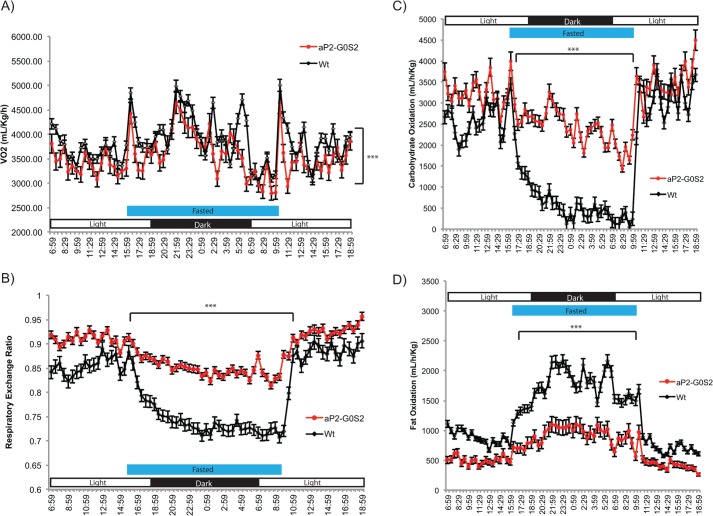
Because aP2-G0S2 mice displayed a significant reduction in the lipolytic rate in adipose tissue, we subjected wild type and aP2-G0S2 mice to a multi-day metabolic cage study to further examine the role of adipose G0S2 on a global scale with respect to energy homeostasis. When compared with wild type mice, aP2-G0S2 mice consumed less oxygen (Fig. 4A) and exhibited a marked change in their respiratory exchange ratio (RER) (Fig. 4B). During the cage study, mice were subjected to a 16-h period of fasting in which alterations in RER and oxidative substrate preference were monitored. Whereas wild type mice experienced a dramatic decrease in RER and carbohydrate oxidation in response to fasting, aP2-G0S2 mice only showed a slight reduction in RER and the rate to oxidize carbohydrates (Fig. 4, B and C). As a result of decreased lipolysis during fasting, aP2-G0S2 mice were unable to considerably up-regulate fat oxidation like the wild type animals (Fig. 4D). These results suggest that adipose G0S2 overexpression prevents a metabolic substrate “switch” from carbohydrates to FAs during the instances of heightened metabolic demand such as fasting.
FIGURE 4.
Global energy metabolism and substrate utilization in aP2-G0S mice. 14-Week-old female wild type and aP2-G0S mice were subjected to a multi-day metabolic cage study with a 16-h fasting period. A, oxygen consumption. B, respiratory exchange ratio. C, calculated carbohydrate oxidation. D, calculated fat oxidation. (n = 8 per group). ***, p < 0.001.
G0S2 Overexpression Leads to Defective Thermogenesis
Induced lipolysis in adipocytes of BAT provides FA substrates to mitochondria for heat production. BAT from aP2-G0S2 mice also overexpressed G0S2 when compared with BAT from wild type animals (Fig. 1C). Histological evaluation of BAT showed a significant increase in TG content in BAT isolated from aP2-G0S2 mice (Fig. 5A). Transmission electron microscopy of BAT confirmed an increase in lipid droplet size and lipid content in the aP2-G0S2 mice (Fig. 5B). Despite the alterations in lipid droplets, there appeared to be no visible changes in mitochondrial structure and morphology in BAT from aP2-G0S2 mice (Fig. 5B). Moreover, gene expression analysis of oxidative genes including PPARα, PGC-1α, and UCP-1 in BAT from aP2-G0S2 mice showed no significant changes when compared with that in BAT from wild type animals (Table 1). These findings are suggestive of intact and functional mitochondria. In an attempt to evaluate BAT function, we subjected aP2-G0S2 mice to a cold exposure at 4 °C. Following a brief 2-h fast, aP2-G0S2 mice were unable to maintain core body temperature when placed in a cold environment (Fig. 5C). Cumulatively, these data indicate that overexpression of G0S2 promotes TG accumulation in BAT and renders the mice incapable of maintaining temperature homeostasis in response to a cold challenge.
FIGURE 5.
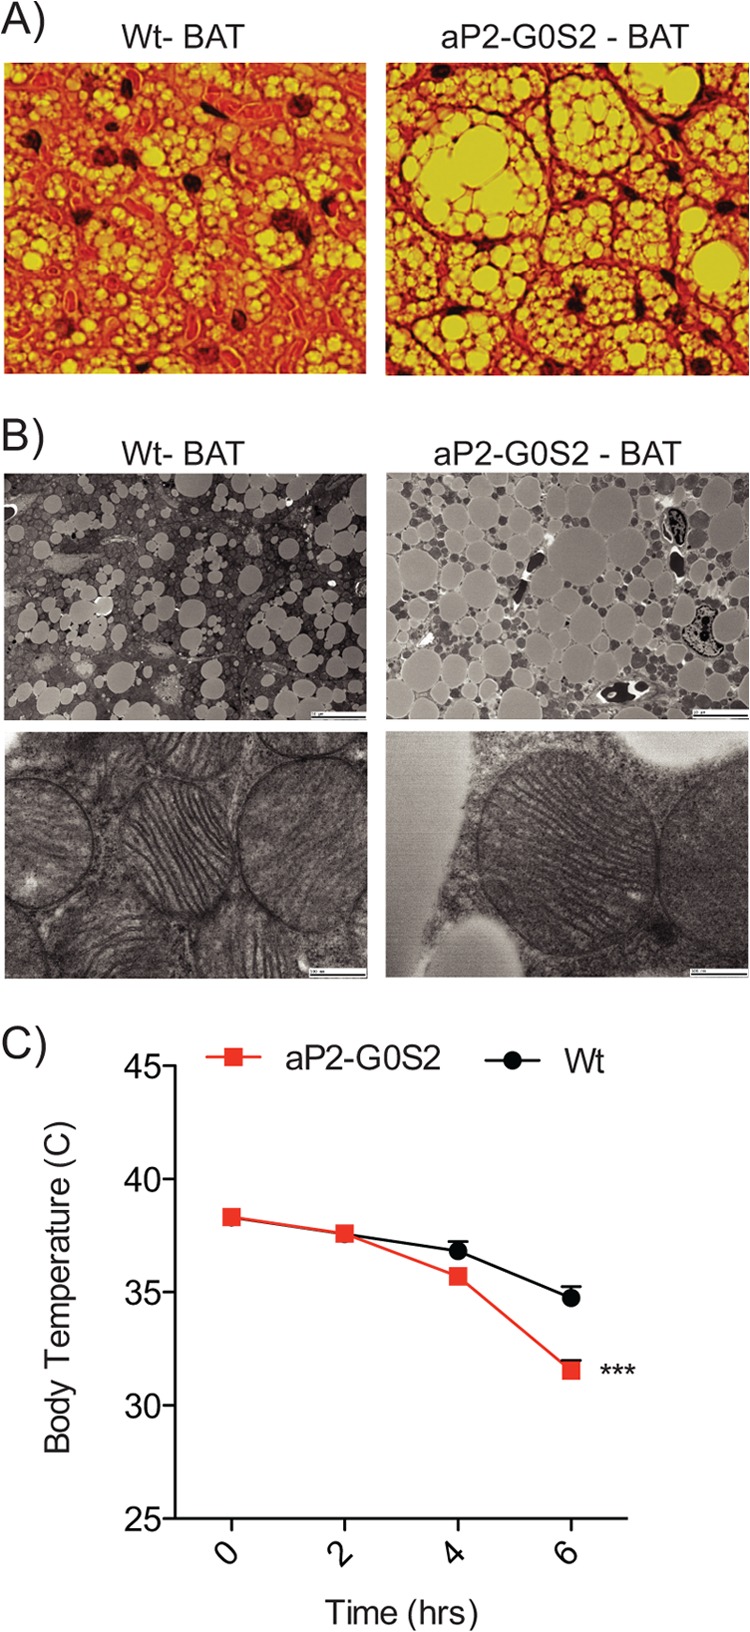
Brown adipose tissue metabolism and cold exposure tolerance. A, H&E staining on BAT isolated from 12-week-old male wild type and aP2-G0S2 mice (10×). B, transmission electron microscopy on BAT isolated from 12-week-old male wild type and aP2-G0S2 mice (Scale bar, top = 10 μm; bottom = 500 nm). C, 12-week-old mice were fasted and placed in a 4 °C environment. Body temperature was measured as indicated over 6 h (n = 8 per group). ***, p < 0.0001.
HFD Feeding Promotes Increased Adiposity in aP2-G0S2 Mice
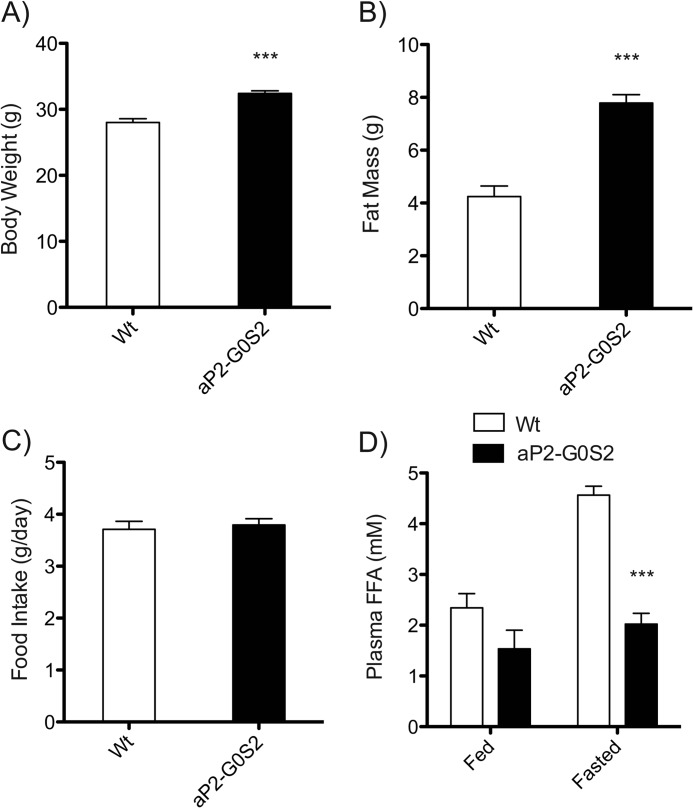
Although aP2-G0S2 mice on chow diet showed increased adiposity, no measurable changes in body weight were observed. To further investigate the impact of transgenic expression of G0S2 in adipose tissue, we decided to challenge aP2-G0S2 mice with a 60% HFD to ascertain the effect of HFD on body weight and overall adiposity. Following 8 weeks of HFD treatment, a significant 16% increase in body weight along with a 46% increase in fat mass were seen in aP2-G0S2 mice when compared with wild type animals (Fig. 6, A and B). There was no difference with respect to food intake (Fig. 6C). Following a similar trend to those in animals on chow diet, the plasma FFA levels were profoundly decreased in the transgenic animals on HFD (Fig. 6D).
FIGURE 6.
Effects of HFD feeding on aP2-G0S2 mice. 4-Week-old male wild type and aP2-G0S2 mice were fed a 60% HFD for 8 weeks. A, body weight (n = 10 per group). B, non-fasting fat mass as measured by NMR (n = 10 per group). C, food intake as measured as g/day (n = 10 per group). D, fed and fasting plasma FFA levels (n = 10 per group). ***, p < 0.001.
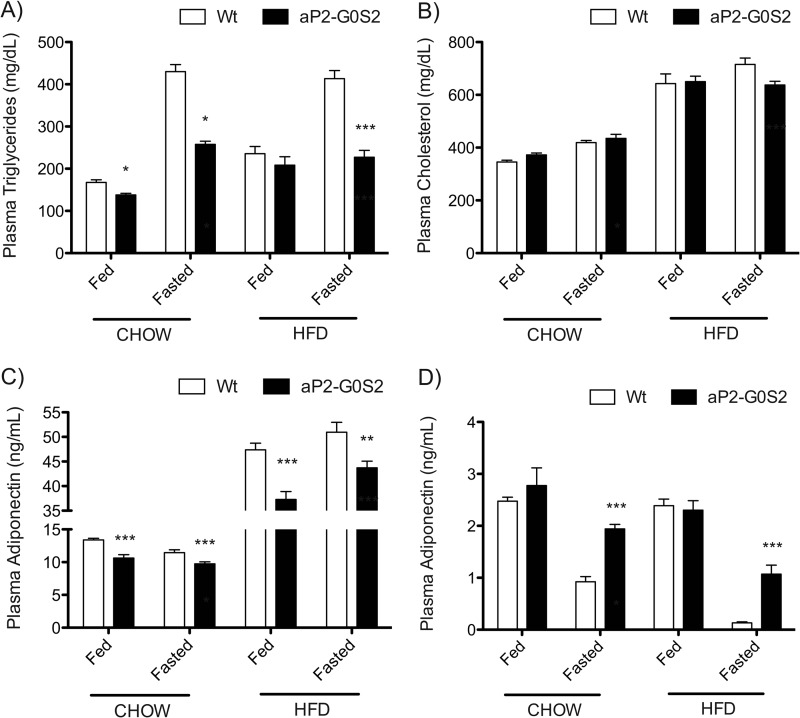
Under both diet conditions, there was a significant decrease in plasma TG levels in aP2-G0S2 mice especially in the fasted state (Fig. 7A). Total cholesterol levels in the plasma were increased upon HFD feeding and remained unchanged between aP2-G0S2 and wild type animals (Fig. 7B). Moreover, aP2-G0S2 expression led to a decrease in plasma adiponectin concentrations (Fig. 7C) and an increase in plasma levels of leptin (Fig. 7D) under both diet conditions. These findings demonstrate an increase in HFD-induced adiposity and are consistent with decreased lipolysis in response to transgenic expression of G0S2.
FIGURE 7.
Plasma parameters from chow and HFD fed mice. Blood was collected from 12-week-old male wild type and aP2-G0S2 mice on chow or HFD in both the fed and fasted states and subsequently used for plasma isolation. A, plasma TG. B, plasma cholesterol. C, plasma adiponectin. D, plasma leptin (n = 10 per group). *, p < 0.05; **, p < 0.008; ***, p < 0.001.
Reduced Adipose Lipolysis Leads to Increased Insulin Sensitivity in aP2-G0S2 Mice
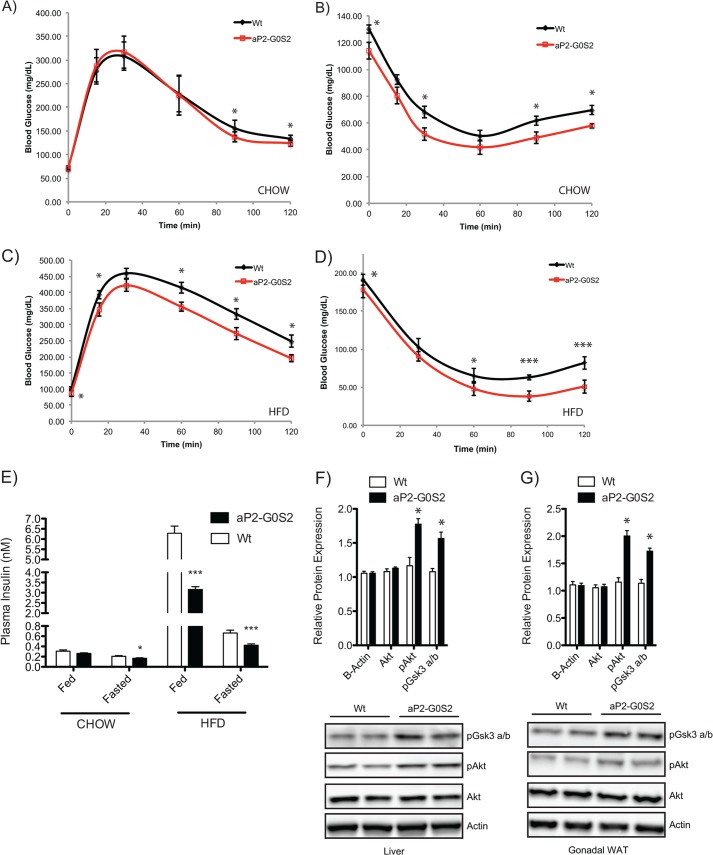
To assess the effect of adipose overexpression of G0S2 on whole-body glucose homeostasis and insulin sensitivity, we subjected wild type and aP2-G0S2 mice to glucose and insulin tolerance tests. When fed with chow diet, glucose tolerance was slightly increased in aP2-G0S2 mice in comparison with wild type animals; especially at the 90- and 120-min time points post glucose injection (Fig. 8A). Insulin tolerance, however, was significantly improved in the transgenic mice at all time points of measurement (Fig. 8B). In response to HFD feeding, both glucose and insulin tolerance was significantly improved in aP2-G0S2 mice at the 60-, 90- and 120-min time points (Fig. 8, C and D). Moreover, plasma insulin concentrations at both basal and 6-h fasted states were considerably reduced in aP2-G0S2 mice (Fig. 8E). Furthermore, insulin signaling was up-regulated in aP2-G0S2 animals as revealed by increased phosphorylation of Akt and GSK3 α/β detected in liver (Fig. 8F) and WAT (Fig. 8G). Together, these results suggest that inhibition of adipose lipolysis through transgenic expression of G0S2 leads to enhanced whole-body glucose utilization and insulin sensitivity.
FIGURE 8.
Insulin sensitivity in aP2-G0S2 mice. A, intraperitoneal glucose tolerance test from 12-week-old male chow fed wild type and aP2-G0S2 mice (n = 12 per group). B, intraperitoneal insulin tolerance test from 12-week-old male chow fed wild type and aP2-G0S2 mice (n = 12 per group). C, intraperitoneal glucose tolerance test from 12-week-old male HFD fed wild type and aP2-G0S2 mice (n = 10 per group). D, intraperitoneal insulin tolerance test from 12-week-old male HFD fed wild type and aP2-G0S2 mice (n = 10 per group). E, fed and 6-h fasting plasma insulin levels detected in blood collected from 12-week-old male chow and HFD fed wild type and aP2-G0S2 mice (n = 10 per group). Insulin signaling immunoblot analysis from liver (F) and gonadal (G) WAT collected 5-min following acute insulin challenge on 12-week-old male HFD fed wild type and aP2-G0S2 mice (n = 5 per group). *, p < 0.05; ***, p < 0.001.
DISCUSSION
In the current study, we demonstrate that G0S2 has an important and dynamic role in regulating adipose-specific lipid metabolism, as well as peripheral lipid accumulation and whole body energy homeostasis. Through adipose specific overexpression of G0S2, we have shown an increase in adiposity, a reduction in lipolytic activity and a global alteration in energy substrate utilization. The mechanism by which G0S2 increases lipid content in adipocytes and promotes adipocyte hypertrophy is presumably through the restriction of TG turnover. Although G0S2 expression has been shown previously to increase during both TG accumulation and adipogenesis (29, 30), changes in fat mass seen in aP2-G0S2 mice are more characteristic of increased adipocyte size.
In agreement with the previous studies demonstrating G0S2 as a specific inhibitor of ATGL (25–27), transgenic expression of G0S2 was able to inhibit adipose lipolysis under both basal and stimulated conditions. The supporting evidence include the following: (i) circulating FFA levels in aP-G0S2 mice on both chow and HFD were lower than those in the wild type mice during the fed state; (ii) an overnight fast or acute treatment with a β3-adrenergic agonist decreased plasma FFA concentration to a greater extent in aP2-G0S2 mice than in wild type mice; and (iii) basal and stimulated release of FFA and glycerol was significantly decreased from ex vivo cultured fat pads isolated from aP2-G0S2 mice. Another interesting finding is that despite a considerable increase in overall fat mass, the chow fed aP2-G0S2 mice displayed a very limited change in overall body weight when compared with the wild type animals. Although one fat specific ATGL knock-out mouse (ATGL-ASKO) shows significant decrease in weight gain (10), a separate model has later displayed no difference in body weight caused by ablation of adipose ATGL (11). HFD feeding, however, increased body weight as well as overall adiposity in aP2-G0S2 mice. This was also observed in ATGL-ASKO mice when challenged with HFD feeding (10). Between aP2-G0S2 and adipose-specific ATGL knock-out models there are also consistencies with regard to increased fat pad weight, WAT morphology, unchanged food intake, and reduction in liver weight.
In the fasted state, a set of metabolic changes occurs in WAT and liver to spare carbohydrate and increase dependence on fat as a substrate for energy production. Given G0S2 expression decreases in adipose tissue in response to fasting, we speculated that the reduction of G0S2 expression in WAT might serve to facilitate the fasting-induced lipolysis and FA flux to other tissues/organs. In support of this hypothesis, the present study has provided data to show that constitutive expression of G0S2 in adipose tissue attenuates FFA flow to other peripheral tissues during fasting. A critical reduction in the FA outflux from adipose tissue provides a unifying framework for the changes observed in the aP2-G0S2 mice, explaining the preservation of fat mass, low fasting plasma levels of FFA and TG, reduced TG accumulation in liver, and decreased hepatic FA oxidation and ketogenesis.
On a global level, the energy balance was significantly altered in response to adipose overexpression of G0S2. We have observed a significant decrease in oxygen consumption and an increase of RER in aP2-G0S2 mice, suggesting an increase in carbohydrate oxidation (28, 31). In response to fasting, the aP2-G0S2 mice continued to oxidize carbohydrate and experienced difficulty in switching to fat/lipid as an energy substrate. The deficiency in this metabolic substrate switch is most likely due to decreased FA availability and FA shuttling from adipose stores during fasting. Moreover, reduced plasma and peripheral FFAs and increased glucose utilization are most likely responsible for the increased insulin sensitivity observed in aP2-G0S2 mice under both chow and HFD feeding conditions. Fasting plasma insulin was also decreased in aP2-G0S2 mice, which is further suggestive of a more insulin responsive animal. Furthermore, changes in plasma adipokines including an increase in leptin and an accompanying decrease in adiponectin are consistent with elevated adiposity (32, 33). Even with the reduction in plasma adiponectin levels, however, we have found no significant up-regulation of proinflammatory genes (Table 1) or morphological indications of increased inflammation in WAT (data not shown) in the chow fed animals. These results lead to the conclusion that despite the gain in WAT mass, aP2-G0S2 mice are metabolically healthy.
aP2-G0S2 mice exhibited an inability to maintain body temperature during a cold exposure. These findings are similar with those observed in global ATGL knock-out and ATGL-ASKO mice subjected to a cold challenge (4, 10). At the morphological level, massive lipid accumulation was observed in the BAT of aP2-G0S2 BAT, similar to ATGL-ASKO mice. One contrasting aspect between BAT from our aP2-G0S2 mice and ATGL-ASKO mice is the differences in oxidative and thermogenic gene expression and mitochondrial function. With regards to gene expression and unlike ATGL-ASKO mice, our aP2-G0S2 mice showed no significant changes in expression patterns of PPARα, PGC-1α, and UCP-1 when compared with wild type animals. More importantly, BAT mitochondria from ATGL-ASKO mice have randomly oriented cristae, whereas BAT from aP2-G0S2 mice exhibited unchanged laminar cristae consistent with mitochondria in the BAT from wild type animals (34, 35). Thus, thermogenic impairment in the ATGL knock-out mice is most likely due to a combination of reduced lipolytic capacity and mitochondrial function in BAT. In this regard, ATGL-mediated lipolysis has been postulated to provide ligands for binding/activation of PPARα and thus contribute to the “browning” of adipocytes. However, our evidence suggests that G0S2 is capable of blunting lipolysis and thermogenic response in BAT without inducing its transdifferentiation to WAT. In mice with adipose overexpression of perilipin-1, decreased basal and catecholamine-stimulated lipolysis was observed along with a brown fat-like phenotype in WAT (36, 37). Therefore, additional factors/mechanisms may be involved in the regulation of adipocyte plasticity in response to lipolytic alterations.
In summary, our studies suggest that G0S2 overexpression in adipose tissue leads to aberrant lipolysis, altered energy homeostasis, and improvements in fasting-induced ectopic lipid accumulation. The association of G0S2 overexpression and subsequent lipolytic reduction with increases in glucose utilization and insulin sensitivity in chow fed mice and reduced insulin resistance following HFD feeding suggest that decreased FFA availability promotes the reliance on carbohydrates as energy substrate even in the presence of increased adiposity. The inability to utilize lipid stores upon adipose overexpression of G0S2 leads to a change in energy homeostasis and an ultimate energy deficit that is clearly visible during cold exposure and fasting. Although aP2-G0S2 mice are more energy instable, limited mobilization of fat stores promotes an overall increase in metabolic health, as demonstrated by increase insulin response, decreased ectopic lipid accumulation, and no observable increase in global cholesterol. The majority of alterations exhibited by adipose overexpression of G0S2 are presumably due to reduction of lipolytic capacity through inhibition of ATGL. It is plausible that ATGL independent effects of G0S2 are also present and warrant further investigation. When taken together, our findings demonstrate the significance of adipose tissue and adipose lipolysis on global energy homeostasis. More importantly they illustrate the role of G0S2 in adipose tissue and the phenotypic impact of G0S2-mediated lipolytic inhibition on overall metabolic health under different dietary scenarios.
This work was supported by research grants from the National Institutes of Health (DK089178) and The American Diabetes Association (1-10-JF-30) (to J. L.).
- TG
- triglyceride
- ATGL
- adipose triglyceride lipase
- WAT
- white adipose tissue(s)
- BAT
- brown adipose tissue(s)
- RER
- respiratory exchange ratio
- FA
- fatty acid
- FFA
- free FA.
REFERENCES
- 1. Kahn B. B., Flier J. S. (2000) Obesity and insulin resistance. J. Clin. Invest. 106, 473–481 [DOI] [PMC free article] [PubMed] [Google Scholar]
- 2. Spiegelman B. M., Flier J. S. (2001) Obesity and the regulation of energy balance. Cell 104, 531–543 [DOI] [PubMed] [Google Scholar]
- 3. Shulman G. I. (2000) Cellular mechanisms of insulin resistance. J. Clin. Invest. 106, 171–176 [DOI] [PMC free article] [PubMed] [Google Scholar]
- 4. Haemmerle G., Lass A., Zimmermann R., Gorkiewicz G., Meyer C., Rozman J., Heldmaier G., Maier R., Theussl C., Eder S., Kratky D., Wagner E. F., Klingenspor M., Hoefler G., Zechner R. (2006) Defective lipolysis and altered energy metabolism in mice lacking adipose triglyceride lipase. Science 312, 734–737 [DOI] [PubMed] [Google Scholar]
- 5. Zimmermann R., Strauss J. G., Haemmerle G., Schoiswohl G., Birner-Gruenberger R., Riederer M., Lass A., Neuberger G., Eisenhaber F., Hermetter A., Zechner R. (2004) Fat mobilization in adipose tissue is promoted by adipose triglyceride lipase. Science 306, 1383–1386 [DOI] [PubMed] [Google Scholar]
- 6. Schweiger M., Schreiber R., Haemmerle G., Lass A., Fledelius C., Jacobsen P., Tornqvist H., Zechner R., Zimmermann R. (2006) Adipose triglyceride lipase and hormone-sensitive lipase are the major enzymes in adipose tissue triacylglycerol catabolism. J. Biol. Chem. 281, 40236–40241 [DOI] [PubMed] [Google Scholar]
- 7. Bezaire V., Mairal A., Ribet C., Lefort C., Girousse A., Jocken J., Laurencikiene J., Anesia R., Rodriguez A. M., Ryden M., Stenson B. M., Dani C., Ailhaud G., Arner P., Langin D. (2009) Contribution of adipose triglyceride lipase and hormone-sensitive lipase to lipolysis in hMADS adipocytes. J. Biol. Chem. 284, 18282–18291 [DOI] [PMC free article] [PubMed] [Google Scholar]
- 8. Langin D., Dicker A., Tavernier G., Hoffstedt J., Mairal A., Rydén M., Arner E., Sicard A., Jenkins C. M., Viguerie N., van Harmelen V., Gross R. W., Holm C., Arner P. (2005) Adipocyte lipases and defect of lipolysis in human obesity. Diabetes 54, 3190–3197 [DOI] [PubMed] [Google Scholar]
- 9. Villena J. A., Roy S., Sarkadi-Nagy E., Kim K. H., Sul H. S. (2004) Desnutrin, an adipocyte gene encoding a novel patatin domain-containing protein, is induced by fasting and glucocorticoids: ectopic expression of desnutrin increases triglyceride hydrolysis. J. Biol. Chem. 279, 47066–47075 [DOI] [PubMed] [Google Scholar]
- 10. Ahmadian M., Abbott M. J., Tang T., Hudak C. S., Kim Y., Bruss M., Hellerstein M. K., Lee H. Y., Samuel V. T., Shulman G. I., Wang Y., Duncan R. E., Kang C., Sul H. S. (2011) Desnutrin/ATGL is regulated by AMPK and is required for a brown adipose phenotype. Cell Metab. 13, 739–748 [DOI] [PMC free article] [PubMed] [Google Scholar]
- 11. Wu J. W., Wang S. P., Casavant S., Moreau A., Yang G. S., Mitchell G. A. (2012) Fasting energy homeostasis in mice with adipose deficiency of desnutrin/adipose triglyceride lipase. Endocrinology 153, 2198–2207 [DOI] [PubMed] [Google Scholar]
- 12. Schrammel A., Mussbacher M., Winkler S., Haemmerle G., Stessel H., Wölkart G., Zechner R., Mayer B. (2013) Cardiac oxidative stress in a mouse model of neutral lipid storage disease. Biochim. Biophys. Acta 1831, 1600–1608 [DOI] [PMC free article] [PubMed] [Google Scholar]
- 13. Morak M., Schmidinger H., Riesenhuber G., Rechberger G. N., Kollroser M., Haemmerle G., Zechner R., Kronenberg F., Hermetter A. (2012) Adipose triglyceride lipase (ATGL) and hormone-sensitive lipase (HSL) deficiencies affect expression of lipolytic activities in mouse adipose tissues. Mol. Cell. Proteomics 11, 1777–1789 [DOI] [PMC free article] [PubMed] [Google Scholar]
- 14. Hoy A. J., Bruce C. R., Turpin S. M., Morris A. J., Febbraio M. A., Watt M. J. (2011) Adipose triglyceride lipase-null mice are resistant to high-fat diet-induced insulin resistance despite reduced energy expenditure and ectopic lipid accumulation. Endocrinology 152, 48–58 [DOI] [PubMed] [Google Scholar]
- 15. Kienesberger P. C., Lee D., Pulinilkunnil T., Brenner D. S., Cai L., Magnes C., Koefeler H. C., Streith I. E., Rechberger G. N., Haemmerle G., Flier J. S., Zechner R., Kim Y. B., Kershaw E. E. (2009) Adipose triglyceride lipase deficiency causes tissue-specific changes in insulin signaling. J. Biol. Chem. 284, 30218–30229 [DOI] [PMC free article] [PubMed] [Google Scholar]
- 16. Huijsman E., van de Par C., Economou C., van der Poel C., Lynch G. S., Schoiswohl G., Haemmerle G., Zechner R., Watt M. J. (2009) Adipose triacylglycerol lipase deletion alters whole body energy metabolism and impairs exercise performance in mice. Am. J. Physiol. Endocrinol. Metab. 297, E505–E513 [DOI] [PubMed] [Google Scholar]
- 17. Lass A., Zimmermann R., Haemmerle G., Riederer M., Schoiswohl G., Schweiger M., Kienesberger P., Strauss J. G., Gorkiewicz G., Zechner R. (2006) Adipose triglyceride lipase-mediated lipolysis of cellular fat stores is activated by CGI-58 and defective in Chanarin-Dorfman Syndrome. Cell Metab. 3, 309–319 [DOI] [PubMed] [Google Scholar]
- 18. Subramanian V., Rothenberg A., Gomez C., Cohen A. W., Garcia A., Bhattacharyya S., Shapiro L., Dolios G., Wang R., Lisanti M. P., Brasaemle D. L. (2004) Perilipin A mediates the reversible binding of CGI-58 to lipid droplets in 3T3-L1 adipocytes. J. Biol. Chem. 279, 42062–42071 [DOI] [PubMed] [Google Scholar]
- 19. Granneman J. G., Moore H. P., Krishnamoorthy R., Rathod M. (2009) Perilipin controls lipolysis by regulating the interactions of AB-hydrolase containing 5 (Abhd5) and adipose triglyceride lipase (Atgl). J. Biol. Chem. 284, 34538–34544 [DOI] [PMC free article] [PubMed] [Google Scholar]
- 20. Granneman J. G., Moore H. P., Granneman R. L., Greenberg A. S., Obin M. S., Zhu Z. (2007) Analysis of lipolytic protein trafficking and interactions in adipocytes. J. Biol. Chem. 282, 5726–5735 [DOI] [PubMed] [Google Scholar]
- 21. Miyoshi H., Perfield J. W., 2nd, Souza S. C., Shen W. J., Zhang H. H., Stancheva Z. S., Kraemer F. B., Obin M. S., Greenberg A. S. (2007) Control of adipose triglyceride lipase action by serine 517 of perilipin A globally regulates protein kinase A-stimulated lipolysis in adipocytes. J. Biol. Chem. 282, 996–1002 [DOI] [PubMed] [Google Scholar]
- 22. Russell L., Forsdyke D. R. (1991) A human putative lymphocyte G0/G1 switch gene containing a CpG-rich island encodes a small basic protein with the potential to be phosphorylated. DNA Cell Biol. 10, 581–591 [DOI] [PubMed] [Google Scholar]
- 23. Siderovski D. P., Blum S., Forsdyke R. E., Forsdyke D. R. (1990) A set of human putative lymphocyte G0/G1 switch genes includes genes homologous to rodent cytokine and zinc finger protein-encoding genes. DNA Cell Biol. 9, 579–587 [DOI] [PubMed] [Google Scholar]
- 24. Bächner D., Ahrens M., Schröder D., Hoffmann A., Lauber J., Betat N., Steinert P., Flohé L., Gross G. (1998) Bmp-2 downstream targets in mesenchymal development identified by subtractive cloning from recombinant mesenchymal progenitors (C3H10T1/2). Dev. Dyn. 213, 398–411 [DOI] [PubMed] [Google Scholar]
- 25. Yang X., Lu X., Lombès M., Rha G. B., Chi Y. I., Guerin T. M., Smart E. J., Liu J. (2010) The G(0)/G(1) switch gene 2 regulates adipose lipolysis through association with adipose triglyceride lipase. Cell Metab. 11, 194–205 [DOI] [PMC free article] [PubMed] [Google Scholar]
- 26. Schweiger M., Paar M., Eder C., Brandis J., Moser E., Gorkiewicz G., Grond S., Radner F. P., Cerk I., Cornaciu I., Oberer M., Kersten S., Zechner R., Zimmermann R., Lass A. (2012) G0/G1 switch gene-2 regulates human adipocyte lipolysis by affecting activity and localization of adipose triglyceride lipase. J. Lipid Res. 53, 2307–2317 [DOI] [PMC free article] [PubMed] [Google Scholar]
- 27. Cornaciu I., Boeszoermenyi A., Lindermuth H., Nagy H. M., Cerk I. K., Ebner C., Salzburger B., Gruber A., Schweiger M., Zechner R., Lass A., Zimmermann R., Oberer M. (2011) The minimal domain of adipose triglyceride lipase (ATGL) ranges until leucine 254 and can be activated and inhibited by CGI-58 and G0S2, respectively. PLoS One 6, e26349. [DOI] [PMC free article] [PubMed] [Google Scholar]
- 28. Frayn K. N. (1983) Calculation of substrate oxidation rates in vivo from gaseous exchange. J. Appl. Physiol. 55, 628–634 [DOI] [PubMed] [Google Scholar]
- 29. Jo J., Gavrilova O., Pack S., Jou W., Mullen S., Sumner A. E., Cushman S. W., Periwal V. (2009) Hypertrophy and/or Hyperplasia: Dynamics of Adipose Tissue Growth. PLoS Comput. Biol. 5, e1000324. [DOI] [PMC free article] [PubMed] [Google Scholar]
- 30. Ahn J., Oh S. A., Suh Y., Moeller S. J., Lee K. (2013) Porcine G(0)/G(1) switch gene 2 (G0S2) expression is regulated during adipogenesis and short-term in-vivo nutritional interventions. Lipids 48, 209–218 [DOI] [PubMed] [Google Scholar]
- 31. Ramos-Jimenez A., Hernandez-Torres R. P., Torres-Duran P. V., Romero-Gonzalez J., Mascher D., Posadas-Romero C., Juarez-Oropeza M. A. (2008) The Respiratory Exchange Ratio is Associated with Fitness Indicators Both in Trained and Untrained Men: A Possible Application for People with Reduced Exercise Tolerance. Clin. Med. Circ. Resp. Pulmonary Med. 2, 1–9 [DOI] [PMC free article] [PubMed] [Google Scholar]
- 32. Moran O., Phillip M. (2003) Leptin: obesity, diabetes and other peripheral effects–a review. Pediatr. Diabetes 4, 101–109 [DOI] [PubMed] [Google Scholar]
- 33. Mi J., Munkonda M. N., Li M., Zhang M. X., Zhao X. Y., Fouejeu P. C., Cianflone K. (2010) Adiponectin and leptin metabolic biomarkers in chinese children and adolescents. J. Obes. 2010, 892081. [DOI] [PMC free article] [PubMed] [Google Scholar]
- 34. Perkins G. A., Song J. Y., Tarsa L., Deerinck T. J., Ellisman M. H., Frey T. G. (1998) Electron tomography of mitochondria from brown adipocytes reveals crista junctions. J. Bioenerg. Biomembr. 30, 431–442 [DOI] [PubMed] [Google Scholar]
- 35. Vatnick I., Tyzbir R. S., Welch J. G., Hooper A. P. (1987) Regression of brown adipose tissue mitochondrial function and structure in neonatal goats. Am. J. Physiol. 252, E391–E395 [DOI] [PubMed] [Google Scholar]
- 36. Sawada T., Miyoshi H., Shimada K., Suzuki A., Okamatsu-Ogura Y., Perfield J. W., 2nd, Kondo T., Nagai S., Shimizu C., Yoshioka N., Greenberg A. S., Kimura K., Koike T. (2010) Perilipin overexpression in white adipose tissue induces a brown fat-like phenotype. PLoS One 5, e14006. [DOI] [PMC free article] [PubMed] [Google Scholar]
- 37. Miyoshi H., Souza S. C., Endo M., Sawada T., Perfield J. W., 2nd, Shimizu C., Stancheva Z., Nagai S., Strissel K. J., Yoshioka N., Obin M. S., Koike T., Greenberg A. S. (2010) Perilipin overexpression in mice protects against diet-induced obesity. J. Lipid Res. 51, 975–982 [DOI] [PMC free article] [PubMed] [Google Scholar]


