

Background: TcdA and TcdB are the main virulence factors for Clostridium difficile infections.
Results: X-ray crystallography, mass spectrometry, and size exclusion chromatography reveal the molecular basis of antibody recognition.
Conclusion: Neutralizing antibodies do not directly block binding to known receptors, suggesting new mechanisms of neutralization.
Significance: The molecular details of antibody recognition will assist with the development of novel therapeutics and diagnostics.
Keywords: Antibodies, Bacterial Toxins, Mass Spectrometry (MS), Protein-Protein Interactions, X-ray Crystallography
Abstract
Clostridium difficile infection is a serious and highly prevalent nosocomial disease in which the two large, Rho-glucosylating toxins TcdA and TcdB are the main virulence factors. We report for the first time crystal structures revealing how neutralizing and non-neutralizing single-domain antibodies (sdAbs) recognize the receptor-binding domains (RBDs) of TcdA and TcdB. Surprisingly, the complexes formed by two neutralizing antibodies recognizing TcdA do not show direct interference with the previously identified carbohydrate-binding sites, suggesting that neutralization of toxin activity may be mediated by mechanisms distinct from steric blockage of receptor binding. A camelid sdAb complex also reveals the molecular structure of the TcdB RBD for the first time, facilitating the crystallization of a strongly negatively charged protein fragment that has resisted previous attempts at crystallization and structure determination. Electrospray ionization mass spectrometry measurements confirm the stoichiometries of sdAbs observed in the crystal structures. These studies indicate how key epitopes in the RBDs from TcdA and TcdB are recognized by sdAbs, providing molecular insights into toxin structure and function and providing for the first time a basis for the design of highly specific toxin-specific therapeutic and diagnostic agents.
Introduction
Infection of the large intestine by the obligate anaerobic bacterium Clostridium difficile is one of the most common and costly hospital-acquired diseases worldwide (1, 2). Although CDI2 is often effectively treated with specific antibiotics, 15–20% of patients suffer recurrent forms of the disease that lack effective treatments. The high economic cost (more than $8 billion/year in the United States alone) and morbidity associated with CDI, as well as the increased prevalence of hypervirulent strains in recent years, underline the urgent need for the development of novel and more effective therapeutics (3, 4).
Our approach to develop novel therapeutics has focused on understanding and limiting the pathogenic effects of the two main virulence factors, toxins A and B (TcdA and TcdB) (5, 6). The sequence and three-dimensional structure of TcdA and TcdB reveal a complex, multidomain architecture in which separate domains are primarily responsible for distinct activities, each of which are essential to the overall pathogenic effects of the toxins (7–9). The three-dimensional arrangement of domains within the toxins has been explored using electron microscopy (10) and small angle x-ray scattering (11), and crystal structures have been determined for several of the domains in isolation (9). The N-terminal glucosyltransferase domain transfers glucose or N-acetylglucosamine residues to host cell Ras and Rho GTPases that help to regulate the dynamics of cytoskeletal interactions. Monoglucosylation of a threonine residue stabilizes the effector loop in the inactive GDP-bound form of the protein to prevent the activation of downstream activators, which ultimately leads to the disruption of actin filaments essential for the integrity of the cytoskeleton. An adjacent cysteine proteinase domain is responsible for self-cleavage, and a central, hydrophobic region of the protein is proposed to assist with toxin internalization. The C-terminal RBD of both toxins contains a highly repetitive, elongated β-solenoid structure that contains binding sites for cell surface receptor carbohydrates.
Crystal structures of fragments of the RBD from TcdA reveal an elongated structure built from the highly regular packing of adjacent β-hairpins (Fig. 1) (11, 12). Individual hairpins and the following loop structure can be classified as either 15–21-residue short repeats (SR) or 30-residue long repeats (LR). The seven LRs in TcdA are flanked by between three to five SRs, giving rise to a segmented, elongated structure in which the SRs form regular, straight sections that are kinked by the introduction of LRs. Each LR forms the central portion of an individual carbohydrate-binding site with specificity for structures containing a lactose or lactosamine disaccharide at the reducing end (13). In TcdB, the SRs are 20–23 residues, and the LRs are exactly 30 residues. In addition to the longer SRs in TcdB versus TcdA, the conserved residues mediating packing interactions between adjacent β-hairpins differ significantly. Also, the sequences of the LRs in TcdA differ substantially from the LRs in TcdB, even though the sequences of the LRs within each protein are very highly conserved. The effects of these differences on the three-dimensional structure and function of the two toxins have remained poorly understood until the structure below was determined. Some of these structural differences help to explain some of the dramatic functional differences previously reported for the two toxins.
FIGURE 1.

Schematic diagram showing the arrangement of SRs (smaller, light-colored rectangles) and LRs (larger, dark-colored rectangles) in the RBDs of TcdA (A) and TcdB (B). The locations of TcdA-A1, TcdA-A2, and TcdB-B1 are also marked, as are the sequence numbering for each fragment. The locations of β-strands in the SRs and LRs are also denoted by the arrows.
The extended structure, location on the surface of the toxin, and functional significance of the RBD help explain why many neutralizing antibodies appear to target epitopes in the RBD when full-length TcdA and TcdB are used as immunogens (14–18). Neutralizing antibodies targeting this domain and others in the toxins also appear to play a critical role in host defense, and the development of more effective vaccines based on the toxins, as well as the therapeutic administration of antibodies including sdAbs, are currently being pursued as novel approaches for the treatment of recurrent CDI (16, 19–23). To better understand the nature of antibody neutralization and the structural basis of antibody recognition as a rational basis for the development of novel therapeutics, we have determined for the first time crystal structures of complexes formed between camelid sdAbs bound to fragments from the RBDs of TcdA and TcdB.
EXPERIMENTAL PROCEDURES
Generation and Analysis of TcdA/B-specific VHHs
VHHs were isolated from immune llama VHH phage display libraries. The isolation, expression, binding characterization, and toxin neutralization analyses of TcdA RBD-specific VHHs were described previously (24). A shortened version of A26.8 (named A26.8H6) in which all linker residues between the C-terminal His6 tag and the VHH were removed was also used to form the A26b and A20.A26a crystal forms. Briefly, A26.8H6 was generated by PCR amplification with primers introducing a 5′ BbsI restriction site and a 3′ HindIII restriction site and His6 tag, followed by digestion with BbsI/HindIII and ligation into a similarly digested pSJF2H expression vector (24) before transformation into electrocompetent TG1 Escherichia coli. Expression and purification of the shortened A26.8H6 variant was the same as described for VHHs above. The TcdB-specific VHH B39 was isolated from a VHH phage display library constructed from the B cells of a llama immunized with full-length TcdB RBD. The construction and screening of the library for TcdB RBD binders and the expression and binding analysis of B39 by surface plasmon resonance (SPR) will be described in a separate publication.
Crystallization and Structure Determination
A20.1, A26.8, A26.8H6, B39, TcdA-A1, TcdA-A2, TcdB-B1, and TcdB-B3C were expressed in E. coli and purified as described previously (12, 13, 24–27). An additional cation exchange chromatography purification step (HiTrap-SP HP column equilibrated in 20 mm Na-HEPES, pH 7.0, 20 mm NaCl, 50 g/liter glycerol and eluted with a 0.02–1 m NaCl gradient in the same buffer) was added to improve the purity of all VHHs. For B39 VHH, 20 mm Na-MOPS, pH 6.5, was used in place of Na-HEPES. Protein concentrations were determined by measuring absorbance at 280 nm, and extinction coefficients were calculated based on amino acid composition using the ExPASy webserver (28). Prior to concentrating protein for crystallization, TcdA-A1 was dialyzed overnight at 4 °C against 20 mm Tris-Cl, pH 7.5, 0.15 m NaCl, 0.5 mm EDTA, 30 g/liter glycerol; TcdA-A2 was dialyzed overnight at 4 °C against 20 mm Bis-Tris-Cl, pH 6.5, 0.15 m NaCl, 0.5 mm EDTA, 30 g/liter glycerol, 15 g/liter sodium benzenesulfonate; and TcdB-B1 was dialyzed overnight at 4 °C against 20 mm Bis-Tris-Cl, pH 6.5, 0.1 m NaCl, 0.5 mm EDTA, 30 g/liter glycerol. Prior to crystallization, VHHs and toxin RBD fragments were mixed in specific molar ratios and diluted into the Tris buffer for the TcdA-A1 complex, the Bis-Tris buffer for TcdA-A2 complexes, and the Bis-Tris buffer without benzenesulfonate for the TcdB-B1 complex. Each mixture was then concentrated using centrifugal filters (10,000 molecular weight cutoff; Millipore) to achieve a final total protein concentration of ∼5 mg/ml. Protein mixtures were subjected to sparse matrix crystallization screens to identify conditions for crystal growth (see Table 1). Conditions from the initial hits from the sparse matrix screens were optimized to yield diffraction quality crystals suitable for structure determination. Diffraction data were measured at the Stanford Synchrotron Radiation Laboratory Beamline 9-2 and Canadian Light Source CMCF-2 Beamline 08-B1–1, and either the HKL suite (29) or XDS (30) was used for indexing, integration, and scaling. Molecular replacement calculations were carried out using Phaser with either 2F6E or 2G7C as the search model for TcdA and TcdB fragments (31) and 1U0Q as the initial search model for A20.1 VHH. After the A20a complex was fully refined, the model of A20.1 VHH was used as the search model for solving the structures of the other complexes reported here. Refmac and Coot were used for refinement and model building (32, 33). Molprobity was used to evaluate the geometric quality of the model during refinement (34). Surface Racer was used to calculate accessible surface area (35), and SC was used to calculate surface complementarity for VHH-toxin interfaces (36). PyMOL was used for the graphical analysis and illustration of structures (37).
TABLE 1.
Crystallographic data and refinement statistics
| Protein Data Bank code | 4NBX | 4NBY | 4NBZ | 4NC0 | 4NC1 | 4NC2 |
|---|---|---|---|---|---|---|
| Name of complex | A20a | A20b | A26a | A26b | A20.A26 | B39 |
| Toxin fragment | TcdA-A1 | TcdA-A2 | TcdA-A1 | TcdA-A2 | TcdA-A2 | TcdB-B1 |
| VHH | A20.1 | A20.1 | A26.8 | A26.8H6 | A26.8H6, A20.1 | B39 |
| Crystallization | ||||||
| Molar ratio (VHH:Toxin fragment) | 1 | 1 | 1 | 2 | 2/2 | 1 |
| Conditions | 0.6 m potassium/sodium tartrate, 0.1 m Tris-Cl, pH 7.5, 0.4 m TMAOa | 1.1 m ammonium sulfate, 0.1 m Tris-Cl, pH 7.5, 0.1 m TMAO | 1.5 m lithium chloride, 12% (w/v) PEG 6000, 0.1 m citric acid, pH 4.0 | 1.65 m ammonium sulfate, 0.25 m sodium chloride, 6% (w/v) glycerol, 0.1 m sodium cacodylate, pH 6.5 | 20% (w/v) PEG 4000, 0.1 m citric acid, pH 4.0 | 0.86 m sodium citrate, pH 6.7, 0.6 m TMAO |
| Data collection | ||||||
| Space group | P65 | P6522 | P32 | P2221 | C2221 | P3221 |
| Unit cell a, b, c (Å) | 97.0, 97.0, 61.1 | 80.4, 80.4, 410.7 | 60.0, 60.0, 133.9 | 56.7, 117.8, 102.8 | 103.0, 122.3, 247.6 | 101.3, 101.3, 59.5 |
| Molecules/AUb (VHH:toxin fragment) | 1:1 | 2:1 | 2:2 | 1:1 | 2:2:2 | 1:1 |
| Resolution (Å)c | 40-1.75 (1.81-1.75) | 40-2.08 (2.13-2.08) | 40-1.75 (1.81-1.75) | 40-2.30 (2.36-2.30) | 40-2.61 (2.68-2.61) | 40-2.50 (2.64-2.50) |
| Rsymd | 0.033 (0.176) | 0.085 (0.692) | 0.092 (0.569) | 0.061 (0.467) | 0.054 (0.719) | 0.058 (0.784) |
| I/σI | 30.9 (8.9) | 23.4 (5.2) | 11.0 (1.5) | 23.1 (5.2) | 24.5 (2.2) | 18.0 (1.9) |
| Completeness (%) | 96.7 (87.7) | 99.9 (99.9) | 99.0 (91.9) | 99.9 (100) | 99.9 (99.9) | 99.9 (99.9) |
| Redundancy | 4.3 (4.2) | 14.1 (14.5) | 4.4 (3.1) | 8.0 (7.9) | 5.3 (5.4) | 4.7 (4.7) |
| Refinement | ||||||
| Resolution (Å) | 40-1.75 | 40-2.08 | 40-1.75 | 40-2.30 | 40-2.61 | 40-2.50 |
| Unique reflections | 30,256 | 46,281 | 51,088 | 29,831 | 45,369 | 11,831 |
| Rworke/Rfreef | 0.196/0.229 | 0.209/0.255 | 0.199/0.246 | 0.199/0.223 | 0.202/0.252 | 0.192/0.230 |
| No. of atoms | 2339 | 4280 | 4647 | 3132 | 7636 | 1956 |
| Protein atoms | 2092 | 3872 | 4167 | 2922 | 7505 | 1945 |
| Water | 247 | 408 | 480 | 210 | 131 | 11 |
| B-factors | ||||||
| Protein | 26.9 | 24.3 | 41.1 | 45.4 | 61.3 | 35.0 |
| Water | 32.8 | 34.6 | 45.4 | 56.2 | 51.2 | 46.0 |
| RMSD valuesg | ||||||
| Bond lengths (Å) | 0.006 | 0.007 | 0.007 | 0.009 | 0.007 | 0.008 |
| Bond angles (°) | 0.97 | 0.97 | 0.98 | 1.10 | 1.06 | 1.24 |
| Ramachandran plot (%)h | ||||||
| Favored | 98.5 | 97.8 | 96.4 | 95.6 | 94.3 | 97.1 |
| Disallowed | 0 | 0 | 1.1 | 0 | 0.11 | 0 |
a TMAO, trimethylamine N-oxide.
b AU, asymmetric unit.
c Values from the outermost resolution shell are given in parentheses.
d Rsym = Σi|Ii − <I>|/ΣiIi, where Ii is the ith integrated intensity of a given reflection, and <I> is the weighted mean of all measurements of I.
e Rwork = Σ||Fo| − |Fc||/Σ|Fo| for 95% of reflection data used in refinement.
f Rfree = Σ||Fo| − |Fc||/Σ|Fo| for 5% of reflection data excluded from refinement.
g Root mean square deviations from ideal geometry calculated by Refmac (32).
h Ramachandran plot analysis carried out using Molprobity (34).
Electrospray Ionization Mass Spectrometry
All experiments were carried out using a Synapt G2 ESI quadrupole/ion mobility separation/time of flight mass spectrometer (Waters, Manchester, UK), equipped with a nanoflow ESI (nanoESI) source. Mass spectra were obtained in positive ion mode using cesium iodide (concentration 30 ng μl−1) for calibration. To perform nanoESI, tips were produced from borosilicate capillaries (1.0-mm outer diameter and 0.68-mm inner diameter), which were pulled to ∼5 μm using a P-1000 micropipette puller (Sutter Instruments, Novato, CA). A platinum wire was inserted into the nanoESI tip, and a capillary voltage of ∼1 kV was applied. A cone voltage of 30 V was used, and the source block temperature was maintained at 70 °C. The injection voltages into the Trap and Transfer ion guides were maintained at 5 and 2 V, respectively. Data acquisition and processing were carried out using MassLynx (version 4.1).
Size Exclusion Chromatography
A SuperdexTM 75 PC 3.2/30 column and a SuperdexTM 200 PC 3.2/30 column (GE Healthcare; 3.2 × 300 mm, 2.4-ml bed volume) were equilibrated with buffer A (40 mm sodium phosphate, pH 7.5, 150 mm NaCl, 0.25 mm EDTA, 50 g/liter glycerol) prior to the injection of samples. Samples of toxin fragments and VHHs were diluted into buffer A and filtered through a centrifugal filter (Millipore; Ultrafree-MC, hydrophilic polytetrafluoroethylene, 0.5 ml, 0.2 μm) before being mixed in different ratios and incubated for 30 min. Samples (12 μl) were injected onto each column using a Shimadzu Prominence HPLC with Rheodyne injector, LC-20AD pump, and SP-20A UV detector (typically set for 214 and 280 nm). All chromatographic runs were performed in duplicate at a constant flow rate of 0.1 ml/min.
RESULTS
Complexes of A20.1 VHH and Fragments of the TcdA RBD
Several highly neutralizing toxin A-specific camelid sdAbs with low nanomolar equilibrium dissociation constants were previously isolated and characterized (24). These sdAbs are VHH in nature and derived from the variable domains of llama heavy chain IgG antibodies (38). Two of these VHHs were co-crystallized with fragments of the TcdA RBD, yielding several views of antibody recognition. Crystals were grown by mixing VHHs and RBD fragments in various ratios, and the ratios were optimized to yield well diffracting crystals (Table 1). Complexes of varying stoichiometry were characterized by gel filtration and mass spectrometry, but specific types of complexes were not purified prior to crystallization. Structures were determined by molecular replacement using the structures of TcdA fragments and sdAbs as search models. Details relating to crystallization, as well as statistics on data collection and refinement, are given in Table 1.
A20.1 VHH was previously shown to bind to TcdA (from C. difficile strain 10463, which we denote as TcdA10463) with KD = 2 nm using SPR and also neutralizes the cytotoxic activity of TcdA, albeit to a modest extent (24). This antibody was co-crystallized with two previously described TcdA RBD fragments, TcdA-A1 (residues 2583–2710 of TcdA10463) and TcdA-A2 (residues 2456–2710 of TcdA10463), both of which contain the native C terminus of TcdA. The complex formed with TcdA-A1 contains a single molecule of A20.1 and a single molecule of TcdA-A1 in the asymmetric unit (crystal form A20a). The complex formed with TcdA-A2 contains two molecules of A20.1 and a single molecule of TcdA-A2 (crystal form A20b).
ESI-MS was used to evaluate the stoichiometry of antibody binding (Fig. 2). Complexes with 1:1 and 2:1 stoichiometry were detected by ESI-MS with A20.1 VHH in excess. These results suggest that the binding of a single molecule of A20.1 is tighter than the binding of a second molecule, but an estimate of the difference in binding affinity cannot be clearly determined from these data, in part because the ionization efficiency of the 2:1 complex is likely less than that of the 1:1 complex.
FIGURE 2.

ESI mass spectra acquired for aqueous ammonium acetate (50 mm) solutions of TcdA-A2·A20.1 VHH and TcdA-A2·A26.8 VHH at 1:2 and 1:4 stoichiometric ratios. A, TcdA-A2 (1 μm) and A20.1 VHH (2 μm). B, TcdA-A2 (1 μm) and A20.1 VHH (4 μm). C, TcdA-A2 (1 μm) and A26.8 VHH (2 μm). D, TcdA-A2 (1 μm) and A26.8 VHH (4 μm). Asterisks indicate minor protein contaminants found in the A20.1 VHH sample. The annotations are colored according to the type of complex: VHH monomers (black), VHH dimers (purple), 1:1 VHH·TcdA-A2 complexes (red), and 2:1 VHH·TcdA-A2 complexes (blue).
Size exclusion chromatography (SEC) was also used to evaluate the types of complexes present in solution (Fig. 3). When A20.1 was added to TcdA-A2, a new species with a shorter elution time appeared, indicating the formation of a fairly stable complex with a slow rate of dissociation. The molecular masses of TcdA-A2 and the complex were estimated to be 23.4 and 45.5 kDa, respectively, by comparison with the elution volumes of calibration standards. Given that the actual molecular mass of A20.1 VHH is 16.8 kDa, the size of the complex is most consistent with a 1:1 molar ratio VHH:TcdA-A2, although the elongated shapes of TcdA-A2 and the complex likely introduce errors in absolute mass determination. When A20.1 VHH was mixed with TcdA-A2 at stoichiometric ratios higher than 1, the elution volume of the complex did not change significantly using either the SuperdexTM 75 or SuperdexTM 200 columns. The peak height for this complex did increase slightly as the stoichiometric ratio of A20.1 was increased. These observations suggest that either the highest concentrations of A20.1 VHH tested were not sufficient to drive most of the TcdA-A2 into a (VHH)2·(TcdA-A2) complex or that the binding of VHH to one of the two binding sites dissociates appreciably during the time scale of the chromatographic separation (∼15 min). Altogether, these observations support the notion that one of the two binding sites for A20.1 in TcdA-A2 is weaker and likely dissociates during the time course of the chromatographic separation.
FIGURE 3.

SEC chromatograms showing the elution profiles of VHHs and fragments of TcdA and TcdB RBDs analyzed on a SuperdexTM 200 PC 3. 2/30 column. When present, the amount of each Tcd fragment injected onto the column was 80 pmol; when injected alone, 80 pmol of each VHH was injected. VHHs were mixed with each Tcd fragment at different molar ratios, and mixtures were incubated for 30 min prior to injecting samples (12 μl) on the column. A, TcdA-A2 (gray solid line), A20.1 VHH (gray dashed line), and A26.8 VHH (gray dotted line) were injected separately, in pairwise combinations (black dashed and dotted lines) and in a 1:1:1 combination (black solid line). B, TcdA-A2 (gray dashed line) and A20.1 VHH (gray dotted line) were injected separately, as well as in combinations of 1:0.5 (thin black solid line), 1:1 (thick black dotted line), 1:2 (thick black solid line), and 1:3 (thick black dashed line) molar ratios (TcdA-A2·A20.1 VHH). C, TcdA-A2 (gray dashed line) and A26.8 VHH (gray dotted line) were injected separately, as well as in combinations of 1:0.5 (thin black solid line), 1:1 (thick black dotted line), 1:2 (thick black solid line), and 1:3 (thick black dashed line) molar ratios (TcdA-A2·A26.8 VHH). D, TcdB-B3C (gray dashed line) and B39 VHH (gray dotted line) were injected separately, as well as in combinations of 1:0.5 (thin black solid line), 1:1 (black dotted line), 1:2 (thick black solid line), and 1:3 (black dashed line).
Because TcdA-A1 is simply the C-terminal half of TcdA-A2, it is not surprising that the same epitope (epitope 1) that is recognized by A20.1 in TcdA-A1 is also bound by A20.1 in TcdA-A2 (Fig. 4). In addition, a second molecule of A20.1 binds to an epitope (epitope 2) of TcdA-A2 that corresponds to a portion of the repeat sequence and structure nearer to the N-terminal end of TcdA-A2 that appears to be nearly identical to epitope 1. Most of the residues in A20.1 that are involved in binding to TcdA are found in the three CDRs, with the exception of two residues near the N terminus (Fig. 5 and Table 2). CDR1 and CDR3 form the bulk of the direct interactions with TcdA, whereas CDR2 acts primarily to stabilize these two CDRs by forming an intermediary brace. The complementarity-determining regions (CDRs) present a fairly flat and shallow antigen-binding surface characteristic of the “plane” or “plain” topography seen for most protein-specific antibodies (39). In the various A20.1 complexes with TcdA fragments, between 730 and 790 Å2 or 11–12% of the total accessible surface area of A20.1 VHH is buried upon complex formation, an area similar to many other antibody-protein interactions (Table 3). The shape complementarity index is also calculated to be between 0.67 and 0.70 for the various A20.1 complexes with TcdA fragments, a value comparable to other antibody-antigen complexes (36).
FIGURE 4.

A and B, complexes of A20.1 VHH bound to TcdA-A1 (crystal form A20a) (A) and TcdA-A2 (crystal form A20b) (B). C, complex of A26.8 VHH bound to TcdA-A2 (crystal form A26b). D, complex of A20.1 and A26.8 VHHs bound to TcdA-A2 (crystal form A20.A26). E, a trisaccharide carbohydrate ligand bound to the cognate carbohydrate-binding site of TcdA-A1 is drawn in space-filling representation, superimposed onto the TcdA-A1 complex with the A20.1 VHH as drawn in A. In A–E, the TcdA RBD fragments are drawn with the common C-terminal 120 residues in the same orientation, with the N terminus drawn near the top of each panel and the C terminus drawn near the bottom. Each RBD fragment is colored black, and each antibody is colored according to a gradient whereby the N terminus is colored blue, progressing through the colors of the rainbow until the C terminus, which is red. The solvent-accessible surface of each RBD fragment is drawn, in addition to ribbon diagrams for all VHHs and RBD fragments. F, TcdA-A2 is drawn in an orientation rotated 180° from the view used in A–E to show the locations of epitopes 1 (magenta), 2 (green) and 3 (red). C-term, C-terminal; N-term, N-terminal.
FIGURE 5.

A and B, detailed views of interactions between A20.1 VHH (A) interacting with epitope 1 (B). The solvent-accessible surface of TcdA-A2 and the main chain trace and side chains of the portions of the VHH CDRs in contact with TcdA are drawn. Residues in epitope 1 of TcdA-A2 that are interacting with A20.1 are drawn beneath a semitransparent representation of the solvent-accessible surface of TcdA-A2. The main chain trace and side chains for regions in contact with the VHHs are drawn. C, superposition of the CDRs for A20.1 binding to epitope 1 (colors same as A) and the CDRs for A20.1 binding to epitope 2 (yellow). Residues in CDR2 that form hydrogen bonds only when A20.1 binds to epitope 2 are labeled. D, superposition of epitope 2 (yellow) onto epitope 1 (cyan). E and F, view of the interactions between A26.8 VHH (E) and epitope 3 of TcdA-A2 (F). The solvent-accessible surface of TcdA-A2 is drawn in both E and F, and both panels are drawn from the same point of view. Solvent residues interacting with protein atoms in the interface region are drawn as small red spheres. Residues forming interactions are labeled.
TABLE 2.
Interactions between VHHs and Tcd fragments
Contacting residues were identified by manually inspecting the potential bonding interactions of all pairs of residues containing at least one pair of atoms within 4 Å of each other. If the residues form either hydrogen-bonding or electrostatic interactions, the residues are printed in bold, italic font. Residue numbering follows the amino acid sequence of each protein and not Kabat numbering.
| A20.1 | TcdA-A1 | A26.8 | TcdA-A2 | B39 | TcdB-B1 | |
|---|---|---|---|---|---|---|
| FR1 | Gln-8 | Asn-63 | ||||
| Val-9 | Asn-63 | |||||
| CDR1 | Gly-33 | Asn-63 | Pro-33 | Glu-242 | Leu-27 | Glu-73 |
| Arg-34 | Tyr-58, Pro-61, Asn-63, Thr-64 | Thr-28 | Glu-73 | |||
| Met-38 | Ile-47, His-82, Leu-83, Leu-84 | Arg-31 | Asp-72 | |||
| Pro-40 | His-82 | Tyr-32 | Glu-73 | |||
| Val-33 | Phe-75 | |||||
| CDR2 | Ser-60 | Leu-84 | Ser-52 | Glu-242, Gly-245, Ile-247 | Thr-52 | Glu-39 |
| Tyr-66 | Val-134 | Thr-54 | Gly-245 | Trp-53 | Ile-38, Glu-39, KLys-1, Phe-75 | |
| Ser-57 | Gly-245, Val-246, Ile-247 | Gly-54 | Glu-39 | |||
| Tyr-59 | Leu-240, Phe-249 | Gly-55 | Glu-39 | |||
| Thr-56 | Glu-39 | |||||
| CDR3 | Pro-107 | His-82 | Arg-102 | Glu-242 | Leu-99 | Gln-68, Glu-73, Asn-74, Phe-75, Gly-76 |
| Tyr-108 | Arg-79, Phe-80 | Thr-103 | Leu-240, Phe-241 | Gly-100 | Gln-68, Phe-75 | |
| Gly-109 | Phe-80, His-82 | Arg-104 | Gly-238, Leu-240, Phe-241 | Trp-101 | Leu-15, Ile-16, Ser-17, Asn-22, Tyr-23, Phe-43, Phe-45, Met-51, Glu-76 | |
| Ala-110 | Gly-80, His-82, Tyr-108 | Leu-105 | Leu-240, Phe-241, Glu-242, Ile-247 | Asp-102 | Leu-15, Ile-16, Ser-17 | |
| Trp-112 | His-82 | Gln-106 | Gly-238, Gly-239, Leu-240 | Arg-104 | Ile-16, Ser-17 | |
| Ala-118 | Arg-79 | Asn-110 | Gln-68 | |||
| Tyr-119 | Asn-63, Thr-64 |
TABLE 3.
Interfacial surface areas and complementarity
Buried surface area values were calculated using Surface Racer (35), and surface complementarity values were calculated using SC (36).
| VHH A20.1 |
VHH A26.8 |
VHH B39 |
||||
|---|---|---|---|---|---|---|
| TcdA-A1 |
TcdA-A2 |
TcdA-A1 |
TcdA-A2 |
TcdB-B1 |
||
| Epitope 1 | Epitope 1 | Epitope 2 | Epitope 3 | Epitope 3 | Epitope 4 | |
| Surface area (Å2) | 732 | 739 | 789 | 530 | 578 | 809 |
| Surface complementarity | 0.68 | 0.67 | 0.70 | 0.78 | 0.79 | 0.79 |
A difference in the repeat sequences of TcdA may account for a difference in binding affinity for the two epitopes. For epitope 2, His-111 and Asp-112 in the β-hairpin turn at the end of an LR in TcdA-A2 forms a network of hydrogen bond interactions with Ser-52, Ser-53, Thr-54, and Thr-57 in CDR2 of A20.1 (Fig. 5). None of these interactions are formed for epitope 1, because the polar His-111 and Asp-112 residues at the end of the LR in epitope 2 are replaced by the nonpolar Leu-202 and Gly-203 residues in epitope 1; these residues are equivalent to Leu-84 and Gly-85 in TcdA-A1. Although it is difficult to quantify the effects of this difference on binding affinity, the higher number of favorable contacts and slightly better complementarity of A20.1 to epitope 2 suggests that epitope 2 is likely bound more strongly than epitope 1. This is consistent with the structure of the A20.A26 crystal structure described below, in which A20.1 is bound to epitope 2, whereas epitope 1 is left unbound even though the binding site is unobstructed.
Most of the residues from TcdA that are involved with binding to A20.1 are contributed by the central portion of an LR and portions of the two following SRs. The epitopes recognized in TcdA are adjacent to the previously identified carbohydrate-binding sites (13), but the two antibody-binding sites do not appear to overlap with the carbohydrate-binding sites (Fig. 4). This is consistent with a previously reported observation that the binding of soluble trisaccharides does not directly compete with antibody binding when SPR was used to detect binding (24). The lack of direct competition between carbohydrate binding and antibody binding may help to explain why A20.1 only shows a modest degree of toxin neutralization, even though the antibody binding is quite tight. If the binding of A20.1 does not appear to directly block the binding of trisaccharide carbohydrate ligands, however, what is the mechanism for the modest neutralization of TcdA activity? The proximity of the binding site of A20.1 to the carbohydrate-binding site suggests that antibody binding may sterically interfere with the binding of TcdA to larger oligosaccharide structures presented in a natural cell surface context if these larger structures extend into the space occupied by the bound antibody near the nonreducing end of minimal trisaccharide and tetrasaccharide ligands. If only a subset of natural receptors are blocked by the binding of A20.1 VHH, for example, this would explain why the activity of TcdA is only partially neutralized by the binding of this antibody.
Complexes of A26.8 VHH and Fragments of the TcdA RBD
A26.8 VHH binds to TcdA10463 with KD = 12 nm and shows potent TcdA neutralization activity (24). A complex of A26.8 bound to TcdA-A1 could be crystallized at pH 4 (crystal form A26a), and a complex of A26.8H6 (a construct with a shorter linker between the VHH sequence and the His6 purification tag) bound to TcdA-A2 was crystallized at pH 6.5 (crystal form A26b). In both of these complexes, A26.8 only binds to a single epitope (epitope 3) formed primarily by the SR at the extreme C terminus of TcdA (Fig. 4 and Table 2). The sequence and structure of this final SR is distinct from the other 31 SRs in the RBD, presumably because it forms a “capping” structure that is unique in the entire RBD. This helps explain why A26.8 does not bind to any other epitopes in TcdA-A2 and also only binds with 1:1 stoichiometry to a fragment containing multiple SRs, LRs, and the native C terminus of TcdA, as confirmed by ESI-MS (Fig. 2) and SEC (Fig. 3). The epitope is more limited than the one recognized by A20.1, resulting in the burial of 530–580 Å2 or 6–9% of the accessible surface area of A26.8 upon complex formation (Table 3). Unlike the mode of recognition seen in A20.1, CDR2 and CDR3 form the walls of a shallow, canyon-like antibody-combining site that shows strong complementarity to the C-terminal SR hairpin. The shape complementarity index (0.78) for this smaller binding interface is actually higher than for the tighter binding A20.1 interface (36).
A mixed complex (crystal form A20.A26) containing a single molecule of A20.1, a single molecule of A26.8, and a single molecule of TcdA-A2 was also crystallized to gain insights into why toxin neutralization was previously observed to be synergistically greater when pairs of neutralizing VHHs (including A20.1 and A26.8) were added together (24) (Fig. 4). This complex shows A20.1 binding to epitope 2 but not epitope 1 and A26.8 binding to the same epitope 3 recognized in the complexes of A26.8 bound to TcdA-A1 and TcdA-A2. It is not clear why A20.1 fails to bind epitope 1 in this mixed complex, because the binding of A26.8 to epitope 3 does not appear to sterically interfere with the binding of A20.1. As discussed above, the structure of this complex supports the idea that A20.1 binds to epitope 2 with a higher affinity than epitope 1. It is notable that this structure shows that there are no direct interactions between A20.1 and A26.8 VHHs when both antibodies are bound to epitopes 2 and 3. If A20.1 were also bound to epitope 1 as seen in the A20a and A20b crystal structures, no direct interactions would also be predicted between A20.1 and A26.8 VHHs. The spatial separation between bound antibodies rules out the possibility that direct interactions between VHHs are responsible for the synergistic increase in toxin neutralization. An alternative mechanism for the observed synergy in antibody neutralization is that the functions of TcdA that are dependent on both classes of epitopes (i.e., the A20.1-specific epitopes 1 and 2, as well as A26.8-specific epitope 3) differ and may be cooperative for normal TcdA function. If this is true, then the binding of a single epitope by a single type of antibody would only neutralize part of the activity of TcdA. However, binding to both epitopes simultaneously would disrupt separate functions more completely. As a result, TcdA activity would then be disrupted to a greater extent than expected by separately neutralizing individual activities by administering each antibody in isolation.
Complex of B39 VHH and Fragments of the TcdB RBD
Even though TcdB shares roughly 40–50% sequence identity with TcdA over the entire holotoxin sequence or in individual domains such as the RBD, the structure and function of the two toxins differ substantially (5–7, 9, 10). A dramatic example of a global difference in structure between the two toxins is seen in the isoelectric points of the toxin RBDs. Whereas the calculated isoelectric point of the RBD from TcdA is near neutral (∼7.5), the isoelectric point of the RBD from TcdB is extremely acidic (∼4.0). Although the biological implications of this difference are not clear, the low isoelectric point and abundance of negatively charged amino acid residues in TcdB likely contribute to the extreme recalcitrance of this protein to crystallization, as well as other biophysical and biological properties (27).
The structure of the TcdB-B1 fragment reveals fundamental differences in the overall structure of TcdB caused by differences in the sequential and spatial arrangement of SRs and LRs (Fig. 6). The part of TcdB-B1 that is most similar to TcdA is the region extending from residues 34 to 115, which can be superimposed onto residues 147–228 of TcdA-A2 (root mean square deviation = 1.25 Å, 82 Cα atoms) (Fig. 6B). This region contains a central LR that is preceded by two SRs and followed by two SRs. Despite differences in consensus residues for repeats in TcdA versus TcdB, as well as differences in the lengths of SRs and LRs, the packing arrangements of adjacent SRs and LRs in TcdB appear quite similar to those seen previously in TcdA.
FIGURE 6.
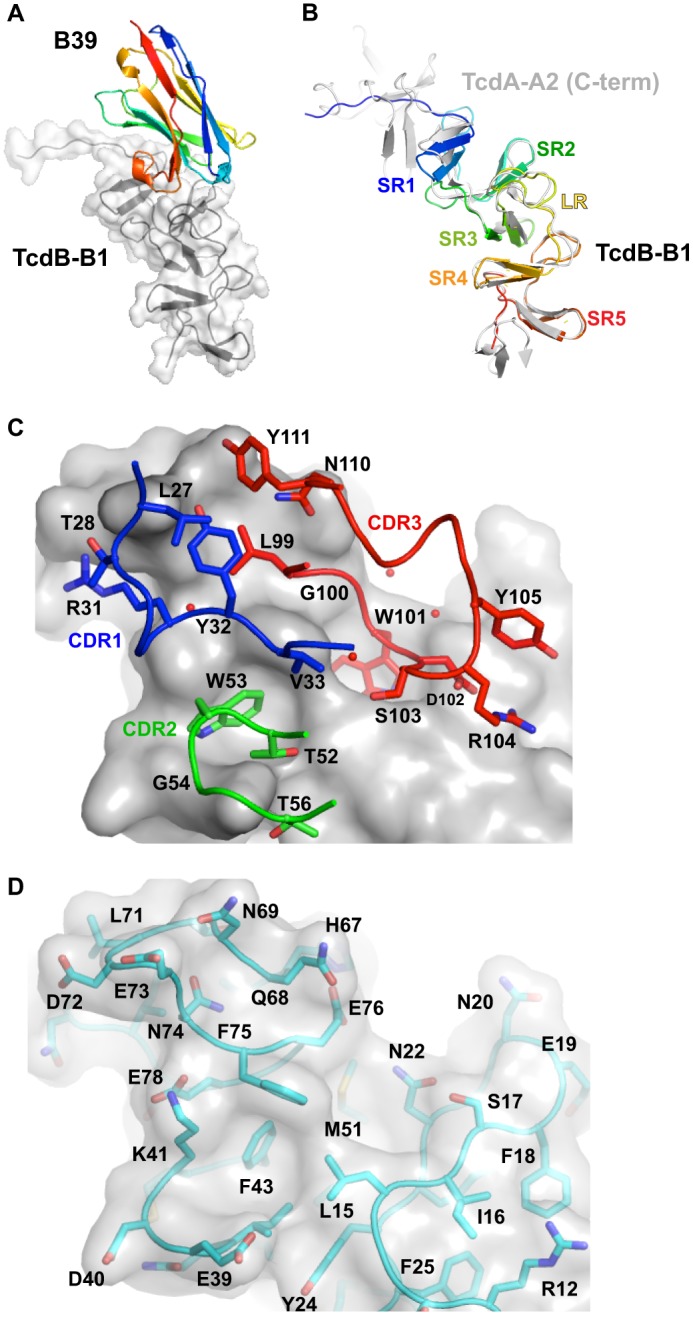
A, complex of B39 VHH bound to TcdB-B1. The two short repeats at the C terminus are drawn in the same orientation as the two short repeats at the C terminus of the TcdA fragments in Fig. 1. The color scheme is the same as in Fig. 4. B, superposition of TcdB-B1 (rainbow coloring with blue at the N terminus and red at the C terminus) and TcdA-A2 (light gray), showing the similarity of structure shared in SR2, SR3, LR, SR4, and SR5 of TcdB-B1 and the corresponding repeats of TcdA-A2. C, detailed view of residues in B39 VHH and ordered water molecules (red spheres) interacting with TcdB-B1. The solvent-accessible surface of TcdB-B1, and the main chain trace and side chains of the portions of the VHH CDRs in contact with TcdB are drawn. D, residues in TcdB-B1 interacting with B39 are drawn beneath a semitransparent representation of the solvent-accessible surface of TcdB-B1. C and D are drawn from the same point of view. Residues forming key interactions are labeled.
VHH B39 was isolated through a process similar to that used to obtain TcdA-specific VHHs in that the TcdB RBD was used to screen an immune llama VHH phage display library, and SPR analysis showed that VHH B39 was shown to bind to the TcdB10463 RBD with high affinity (KD = 70 pm) (data not shown). A complex of this antibody was crystallized with a previously described TcdB RBD fragment, TcdB-B1 (residues 2248–2367 of TcdB10463) containing the native C terminus of TcdB (26). The stoichiometry of binding was observed to be 1:1 in the crystal structure, which is consistent with ESI-MS measurements, where 1:1 and 2:1 complexes of B39·TcdB-B3C were detected when B39 was present at 2- and 4-fold molar excess, respectively (Fig. 7). TcdB-B3C contains all of TcdB-B1, as well as additional N-terminal sequence repeats that approximately double the size of TcdB-B1 (27). Unfortunately, the relative abundance of the 1:1 and 2:1 complexes cannot be quantified by ESI-MS because of the potential differences in the ionization efficiency of the two complexes.
FIGURE 7.
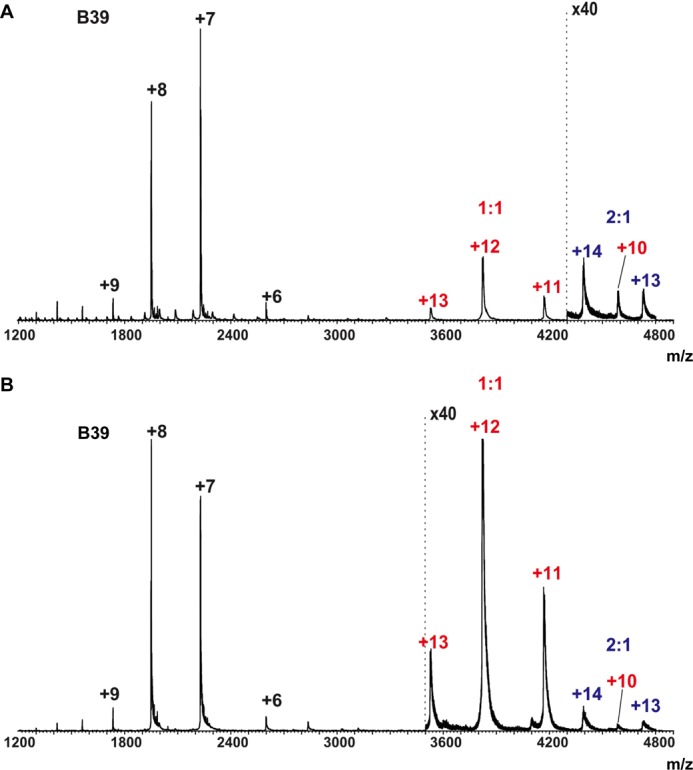
ESI mass spectra acquired for aqueous ammonium acetate (50 mm) solutions of TcdB-B3C·B39 VHH at 1:2 and 1:4 stoichiometric ratios. A, TcdB-B3C (2 μm) and B39 VHH (4 μm). B, TcdB-B3C (2 μm) and B39 VHH (8 μm). The annotations are colored according to the type of complex: VHH monomers (black), 1:1 VHH·TcdB-B3C complexes (red), and 2:1 VHH·TcdB-B3C complexes (blue).
SEC also revealed the formation of a complex with decreased elution volume compared with TcdB-B3C and B39 (Fig. 3). The elution volume of TcdB-B3C (1.62 ml) corresponds to a molecular mass of 58 kDa when compared with calibration standards, thus suggesting the formation of a dimer from the 30.2-kDa protomers. Addition of B39 VHH to TcdB-B3C appears to form a complex with a smaller elution volume (1.57 ml), corresponding to a molecular mass of 73 kDa. The higher apparent molecular mass of this species suggests the binding of a single molecule of VHH to the dimer of TcdB-B3C, but this seems unlikely, because each molecule of TcdB-B3C is expected to have two binding sites for B39. The high density of negatively charged residues in TcdB-B3C (48 Asp and Glu versus 13 Arg and Lys of 261 residues) may contribute toward the artificially low elution volume as opposed to dimerization. If this is true, then the shift in elution volume upon complex formation may correspond to the formation of a 1:1 complex. The lack of evidence for a 2:1 complex may reflect weaker binding of B39 to the second epitope predicted to be found in TcdB-B3C, similar to the case described for A20.1 previously. If binding to the second epitope dissociates during the time course of the chromatography or if there is insufficient B39 to promote binding, only the 1:1 complex would be detected by SEC.
Residues from all three CDRs in B39 appear to form important, direct interactions with TcdB (Fig. 6 and Table 2). In particular, Trp-53 and Trp-101 from CDRs 2 and 3, respectively, project into two mostly hydrophobic pockets formed at the junction of two SRs and the following LR. CDR1 and CDR3 form additional contacts primarily with the LR, whereas CDR2 and a part of CDR3 also interact with portions of the two preceding SRs (epitope 4). Although the combination of SR and LR sequences forming this epitope may superficially appear similar to the epitope recognized in TcdA by A20.1, the mode of toxin recognition in B39 differs at a fundamental level. The epitope recognized in TcdB is adjacent to the carbohydrate-binding site previously identified, but the two sites do not appear to overlap (40). The lack of direct competition between carbohydrate binding and antibody binding may help explain why B39 does not appear to neutralize TcdB, even though the binding is very tight. The contact area formed in the B39 complex is 809 Å2, which is ∼10% larger than the contact area for A20.1 and ∼50% larger than the contact area for A26.8 (Table 3). This larger contact area, combined with a high shape complementarity between the two binding partners is 0.79 (36), is consistent with the tighter binding of B39 compared with A20.1 and A26.8.
DISCUSSION
The molecular structures of two different neutralizing camelid sdAbs binding to two C-terminal fragments of TcdA, as well as the structure of a non-neutralizing sdAb binding to a C-terminal fragment of TcdB, reveal for the first time how specific epitopes in the receptor-binding domains of the large clostridial toxins can be recognized. The binding of A20.1 to an epitope that appears to be highly conserved in different toxinotypes and that also repeats seven times in the entire RBD of most toxinotypes of TcdA suggests a model for how seven molecules of A20.1 could bind to a single molecule of the holotoxin (Fig. 8A). This model was constructed starting with the model previously generated for the RBD of TcdA, in which the highly regular interfaces between adjacent SRs and LRs were used to extend the crystal structures of the C-terminal fragments into a model of the entire RBD (12). In addition to the two molecules of A20.1 observed bound to the C-terminal TcdA-A2 fragment in the A20b crystal form, five additional molecules of A20.1 are predicted to bind to epitopes similar to epitopes 1 and 2 in the N-terminal portions of the entire RBD. A model for seven VHH molecules binding to a single RBD can be constructed by assuming that the highly conserved epitopes seen in the other repeats in the RBD interact with A20.1 in the same manner as observed for epitopes 1 and 2. This model suggests that A20.1 may neutralize TcdA activity by sterically interfering with the binding of TcdA to an extended array of receptor oligosaccharides presented on a cell surface, even though the binding of A20.1 does not directly interfere with the binding of small, soluble trisaccharide ligands (24). Additional evidence is clearly needed to support this hypothesis, but this model suggests a mechanism of inhibition that provides a framework for the design of more potent approaches to neutralizing toxin activity.
FIGURE 8.
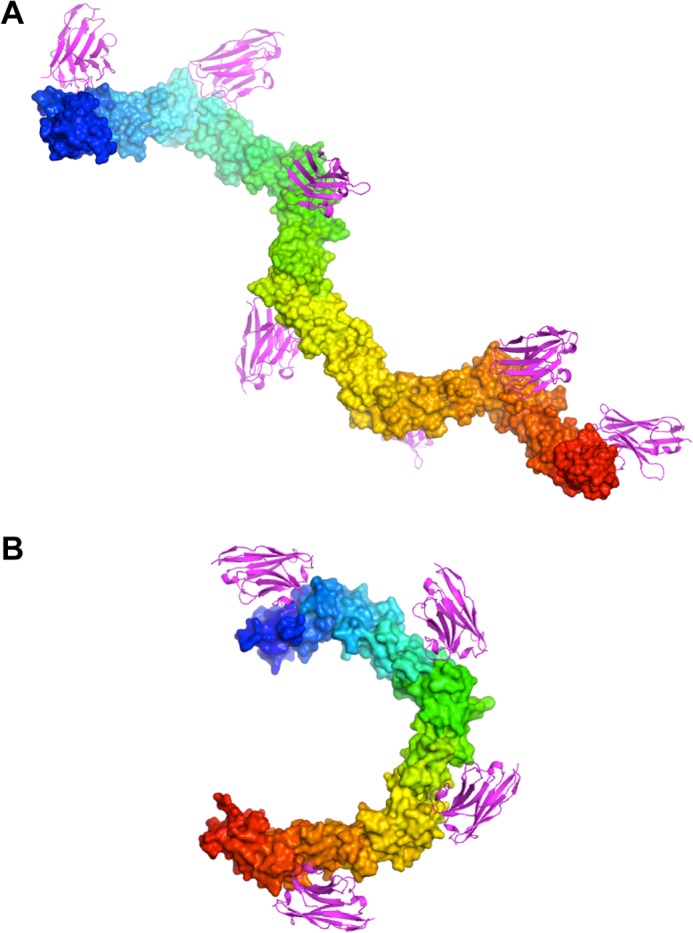
Models of seven molecules of A20.1 VHH bound to the TcdA RBD (A) and four molecules of B39 VHH bound to the TcdB RBD (B). VHH molecules (magenta) are drawn in ribbon cartoon representation, and the RBD molecules (rainbow coloring: blue at the N terminus and red at the C terminus) are drawn in a solvent-accessible surface representation. The model assumes that the A20.1 VHH molecules bind to epitopes in the repetitive RBDs that are nearly identical to epitopes 1 and 2 as seen in the A20a and A20b complexes, and the B39 VHH molecules bind to epitopes nearly identical to epitope 4.
Crystal structures of various A20.1 complexes also reveal for the first time how structural differences in epitopes 1 and 2 may contribute to differences in binding affinity. SEC suggests that the binding of A20.1 to epitope 2 is likely stronger than binding to epitope 1, but further experiments using SPR or isothermal titration calorimetry will be needed to more precisely quantify differences in binding affinity between the two binding sites. It should be noted that the simple A + B < = > AB binding model used to calculate the apparent dissociation constants for VHH binding reported previously (24) is likely an oversimplification of the real situation, because each of the seven predicted epitopes recognized by A20.1 VHH may have differing binding affinities because of slight differences in the sequence and hence structure of different repeats. It should be noted that the highest concentration of A20.1 used to measure binding by SPR was 50 nm, a concentration that is likely sufficient to saturate the binding of epitope 2 but probably not sufficient to saturate the binding of epitope 1. Over the range of A20.1 concentrations tested, no significant deviations from the simple A +B < = > AB binding model were detected, and no biphasic dissociation was observed. The binding affinities of the seven predicted epitopes in the TcdA RBD are at present difficult to estimate. The difference in binding affinity for each of these epitopes will be an important and challenging area for further study that will likely require more complex binding models and experimental design. Understanding the potential range of effects on receptor recognition from the binding of VHHs to different epitopes will also be an important area for further study, especially to better define mechanisms of toxin neutralization.
The epitope recognized by B39 VHH is also repeated in the RBD from TcdB, although the level of sequence conservation is lower. Nevertheless, most of the sequence variations appear to be conservative and unlikely to prevent binding. As a result, a model for the binding of four molecules of B39 to the entire RBD can be constructed through a process similar to that used for A20.1. The differences in the numbers of SRs spacing the LRs, as well as differences in the geometrical relationships between adjacent SRs and LRs, give rise to a more compact, horseshoe-shaped overall structure for the RBD from TcdB. Although negative stain electron micrographs of TcdB are quite difficult to interpret, comparisons with micrographs of TcdA suggest that the RBD may adopt a less extended structure in TcdB that is consistent with the model presented here (10).
Sequence analysis suggests that epitope 4, which is recognized by B39, is predicted to occur in three additional locations on the outer surface of the horseshoe, allowing us to predict a binding model for four molecules of B39 VHH bound to a single molecule of TcdB RBD (Fig. 8B). Additional binding and structural studies are clearly needed to determine the extent to which variations in the sequence and structure of the other three epitopes affect binding affinity. A deeper understanding of this relationship is likely critical to improving the neutralization activity of tight binding VHHs to generate more effective therapeutics for treating CDI in the future. The results presented here provide a framework for further exploring these issues.
Perhaps the most intriguing observation revealed by the VHH complexes reported here is that epitope 3, which is recognized by A26.8 VHH, lies in the most C-terminal SR of TcdA and is not predicted to be found in any of the “internal” repeats found in TcdA. Because this epitope is also distant from the carbohydrate-binding sites but appears to be highly conserved across all known toxinotypes of TcdA, the mechanism for toxin neutralization by A26.8 and at least two other VHHs recognizing the same epitope remains unclear at present. The synergy in toxin neutralization that was previously observed (24) when A20.1 and A26.8 VHHs were added together also supports the notion. The structural observations reported here clearly indicate that these two antibodies bind to distinct epitopes and are likely to inhibit toxin activity through distinct mechanisms. A20.1 binds to an epitope adjacent to the part of the receptor binding site that interacts with the nonreducing end of previously characterized oligosaccharide carbohydrate ligands expressed on epithelial cell surfaces (13, 40). In contrast, A26.8 binds to an epitope that is unique to the C-terminal region of the RBD and hence does not appear in multiple parts of the RBD like the epitope recognized by A20.1. These observations suggest for the first time that the extreme C terminus of TcdA may play a particularly important role in the function of TcdA and perhaps also the pathogenesis of CDI. A deeper understanding of the role of the C terminus in receptor binding, toxin internalization, or other critical steps of toxin function may reveal a novel mechanism for inhibition that could be exploited for developing more effective therapeutics.
Acknowledgments
Some of the x-ray diffraction data were measured at Beamline 08-ID-1 of the Canadian Light Source. Some of the diffraction data were also measured at the Stanford Synchrotron Radiation Lightsource, a Directorate of SLAC National Accelerator Laboratory and an Office of Science User Facility operated for the United States Department of Energy Office of Science by Stanford University. We also gratefully acknowledge the contribution of clones for the TcdA and TcdB RBDs by Maja Rupnik to the early stages of our work on the large clostridial toxins.
This work was supported, in whole or in part, by National Institutes of Health Grants P41GM103393 and P41RR001209 (to the Stanford Synchrotron Radiation Lightsource Structural Molecular Biology Program). This work was also supported by funds from Department of Energy Office of Biological and Environmental Research (to the Stanford Synchrotron Radiation Lightsource Structural Molecular Biology Program), the Alberta Glycomics Centre and Discovery grants from the Natural Sciences and Engineering Research Council of Canada (to K. K. S. N. and J. S. K.), and the Natural Sciences and Engineering Research Council of Canada, the National Research Council Canada, the Canadian Institutes of Health Research, the Province of Saskatchewan, Western Economic Diversification Canada, and the University of Saskatchewan (to Beamline 08-ID-1).
- CDI
- C. difficile infection
- CDR
- complementarity-determining region
- ESI
- electrospray ionization
- LR
- long repeat
- RBD
- receptor-binding domain
- sdAb
- single-domain antibody
- SEC
- size exclusion chromatography
- SPR
- surface plasmon resonance
- SR
- short repeat.
REFERENCES
- 1. Carroll K. C., Bartlett J. G. (2011) Biology of Clostridium difficile. Implications for epidemiology and diagnosis. Annu. Rev. Microbiol. 65, 501–521 [DOI] [PubMed] [Google Scholar]
- 2. Rupnik M., Wilcox M. H., Gerding D. N. (2009) Clostridium difficile infection. New developments in epidemiology and pathogenesis. Nat. Rev. Microbiol. 7, 526–536 [DOI] [PubMed] [Google Scholar]
- 3. Gerding D. N. (2012) Clostridium difficile infection prevention. Biotherapeutics, immunologics, and vaccines. Discov. Med. 13, 75–83 [PubMed] [Google Scholar]
- 4. Lucado J., Gould C., Elixhauser A. (2012) Clostridium difficile infections (CDI) in hospital stays, 2009, statistical brief #124. in Healthcare Cost and Utilization Project (HCUP) Statistical Briefs, pp. 1–12, Agency for Healthcare Research and Quality, Rockville, MD: [PubMed] [Google Scholar]
- 5. Voth D. E., Ballard J. D. (2005) Clostridium difficile toxins. Mechanism of action and role in disease. Clin. Microbiol. Rev. 18, 247–263 [DOI] [PMC free article] [PubMed] [Google Scholar]
- 6. Ballard J. D. (2010) Medical microbiology. A toxin contest. Nature 467, 665–666 [DOI] [PubMed] [Google Scholar]
- 7. Jank T., Giesemann T., Aktories K. (2007) Rho-glucosylating Clostridium difficile toxins A and B. New insights into structure and function. Glycobiology 17, 15R–22R [DOI] [PubMed] [Google Scholar]
- 8. Davies A. H., Roberts A. K., Shone C. C., Acharya K. R. (2011) Super toxins from a super bug. Structure and function of Clostridium difficile toxins. Biochem. J. 436, 517–526 [DOI] [PubMed] [Google Scholar]
- 9. Pruitt R. N., Lacy D. B. (2012) Toward a structural understanding of Clostridium difficile toxins A and B. Front. Cell. Infect. Microbiol. 2, 1–14 [DOI] [PMC free article] [PubMed] [Google Scholar]
- 10. Pruitt R. N., Chambers M. G., Ng K. K., Ohi M. D., Lacy D. B. (2010) Structural organization of the functional domains of Clostridium difficile toxins A and B. Proc. Natl. Acad. Sci. U.S.A. 107, 13467–13472 [DOI] [PMC free article] [PubMed] [Google Scholar]
- 11. Albesa-Jové D., Bertrand T., Carpenter E. P., Swain G. V., Lim J., Zhang J., Haire L. F., Vasisht N., Braun V., Lange A., von Eichel-Streiber C., Svergun D. I., Fairweather N. F., Brown K. A. (2010) Four distinct structural domains in Clostridium difficile toxin B visualized using SAXS. J. Mol. Biol. 396, 1260–1270 [DOI] [PubMed] [Google Scholar]
- 12. Ho J. G., Greco A., Rupnik M., Ng K. K. (2005) Crystal structure of receptor-binding C-terminal repeats from Clostridium difficile toxin A. Proc. Natl. Acad. Sci. U.S.A. 102, 18373–18378 [DOI] [PMC free article] [PubMed] [Google Scholar]
- 13. Greco A., Ho J. G., Lin S. J., Palcic M. M., Rupnik M., Ng K. K. (2006) Carbohydrate recognition by Clostridium difficile toxin A. Nat. Struct. Mol. Biol. 13, 460–461 [DOI] [PubMed] [Google Scholar]
- 14. Sauerborn M., Leukel P., von Eichel-Streiber C. (1997) The C-terminal ligand-binding domain of Clostridium difficile toxin A (TcdA) abrogates TcdA-specific binding to cells and prevents mouse lethality. FEMS Microbiol Lett. 155, 45–54 [DOI] [PubMed] [Google Scholar]
- 15. Kink J. A., Williams J. A. (1998) Antibodies to recombinant Clostridium difficile toxins A and B are an effective treatment and prevent relapse of C. difficile-associated disease in a hamster model of infection. Infect. Immun. 66, 2018–2025 [DOI] [PMC free article] [PubMed] [Google Scholar]
- 16. Babcock G. J., Broering T. J., Hernandez H. J., Mandell R. B., Donahue K., Boatright N., Stack A. M., Lowy I., Graziano R., Molrine D., Ambrosino D. M., Thomas W. D., Jr. (2006) Human monoclonal antibodies directed against toxins A and B prevent Clostridium difficile-induced mortality in hamsters. Infect. Immun. 74, 6339–6347 [DOI] [PMC free article] [PubMed] [Google Scholar]
- 17. Permpoonpattana P., Hong H. A., Phetcharaburanin J., Huang J. M., Cook J., Fairweather N. F., Cutting S. M. (2011) Immunization with Bacillus spores expressing toxin A peptide repeats protects against infection with Clostridium difficile strains producing toxins A and B. Infect. Immun. 79, 2295–2302 [DOI] [PMC free article] [PubMed] [Google Scholar]
- 18. Leuzzi R., Spencer J., Buckley A., Brettoni C., Martinelli M., Tulli L., Marchi S., Luzzi E., Irvine J., Candlish D., Veggi D., Pansegrau W., Fiaschi L., Savino S., Swennen E., Cakici O., Oviedo-Orta E., Giraldi M., Baudner B., D'Urzo N., Maione D., Soriani M., Rappuoli R., Pizza M., Douce G. R., Scarselli M. (2013) Protective efficacy induced by recombinant Clostridium difficile toxin fragments. Infect. Immun. 81, 2851–2860 [DOI] [PMC free article] [PubMed] [Google Scholar]
- 19. Gardiner D. F., Rosenberg T., Zaharatos J., Franco D., Ho D. D. (2009) A DNA vaccine targeting the receptor-binding domain of Clostridium difficile toxin A. Vaccine 27, 3598–3604 [DOI] [PMC free article] [PubMed] [Google Scholar]
- 20. Demarest S. J., Hariharan M., Elia M., Salbato J., Jin P., Bird C., Short J. M., Kimmel B. E., Dudley M., Woodnutt G., Hansen G. (2010) Neutralization of Clostridium difficile toxin A using antibody combinations. MAbs 2, 190–198 [DOI] [PMC free article] [PubMed] [Google Scholar]
- 21. Hussack G., Tanha J. (2010) Toxin-specific antibodies for the treatment of Clostridium difficile. Current status and future perspectives. Toxins 2, 998–1018 [DOI] [PMC free article] [PubMed] [Google Scholar]
- 22. Lowy I., Molrine D. C., Leav B. A., Blair B. M., Baxter R., Gerding D. N., Nichol G., Thomas W. D., Jr., Leney M., Sloan S., Hay C. A., Ambrosino D. M. (2010) Treatment with monoclonal antibodies against Clostridium difficile toxins. N. Engl. J. Med. 362, 197–205 [DOI] [PubMed] [Google Scholar]
- 23. Davies N. L., Compson J. E., Mackenzie B., O'Dowd V. L., Oxbrow A. K., Heads J. T., Turner A., Sarkar K., Dugdale S. L., Jairaj M., Christodoulou L., Knight D. E., Cross A. S., Hervé K. J., Tyson K. L., Hailu H., Doyle C. B., Ellis M., Kriek M., Cox M., Page M. J., Moore A. R., Lightwood D. J., Humphreys D. P. (2013) A mixture of functionally oligoclonal humanized monoclonal antibodies that neutralize Clostridium difficile TcdA and TcdB with high levels of in vitro potency shows in vivo protection in a hamster infection model. Clin. Vaccine Immunol. 20, 377–390 [DOI] [PMC free article] [PubMed] [Google Scholar]
- 24. Hussack G., Arbabi-Ghahroudi M., van Faassen H., Songer J. G., Ng K. K., MacKenzie R., Tanha J. (2011) Neutralization of Clostridium difficile toxin A with single-domain antibodies targeting the cell receptor binding domain. J. Biol. Chem. 286, 8961–8976 [DOI] [PMC free article] [PubMed] [Google Scholar]
- 25. Hussack G., Arbabi-Ghahroudi M., Mackenzie C. R., Tanha J. (2012) Isolation and characterization of Clostridium difficile toxin-specific single-domain antibodies. Methods Mol. Biol. 911, 211–239 [DOI] [PubMed] [Google Scholar]
- 26. Dingle T., Wee S., Mulvey G. L., Greco A., Kitova E. N., Sun J., Lin S., Klassen J. S., Palcic M. M., Ng K. K., Armstrong G. D. (2008) Functional properties of the carboxy-terminal host cell-binding domains of the two toxins, TcdA and TcdB, expressed by Clostridium difficile. Glycobiology 18, 698–706 [DOI] [PubMed] [Google Scholar]
- 27. Lin H., Kitova E. N., Johnson M. A., Eugenio L., Ng K. K., Klassen J. S. (2012) Electrospray ionization-induced protein unfolding. J. Am. Soc. Mass Spectrom. 23, 2122–2131 [DOI] [PubMed] [Google Scholar]
- 28. Gasteiger E., Gattiker A., Hoogland C., Ivanyi I., Appel R. D., Bairoch A. (2003) ExPASy. The proteomics server for in-depth protein knowledge and analysis. Nucleic Acids Res. 31, 3784–3788 [DOI] [PMC free article] [PubMed] [Google Scholar]
- 29. Otwinowski Z., Minor W. (1997) Processing of X-ray diffraction data collected in oscillation mode. Methods Enzymol. 276, 307–326 [DOI] [PubMed] [Google Scholar]
- 30. Kabsch W. (2010) XDS. Acta Crystallogr. D Biol. Crystallogr. 66, 125–132 [DOI] [PMC free article] [PubMed] [Google Scholar]
- 31. Read R. J. (2001) Pushing the boundaries of molecular replacement with maximum likelihood. Acta Crystallogr. D 57, 1373–1382 [DOI] [PubMed] [Google Scholar]
- 32. Murshudov G. N., Vagin A. A., Dodson E. J. (1997) Refinement of macromolecular structures by the maximum-likelihood method. Acta Crystallogr. D 53, 240–255 [DOI] [PubMed] [Google Scholar]
- 33. Emsley P., Cowtan K. (2004) Coot. Model-building tools for molecular graphics. Acta Crystallogr. D 60, 2126–2132 [DOI] [PubMed] [Google Scholar]
- 34. Chen V. B., Arendall W. B., 3rd, Headd J. J., Keedy D. A., Immormino R. M., Kapral G. J., Murray L. W., Richardson J. S., Richardson D. C. (2010) MolProbity. All-atom structure validation for macromolecular crystallography. Acta Crystallogr. D 66, 12–21 [DOI] [PMC free article] [PubMed] [Google Scholar]
- 35. Tsodikov O. V., Record M. T., Jr., Sergeev Y. V. (2002) Novel computer program for fast exact calculation of accessible and molecular surface areas and average surface curvature. J. Comput. Chem. 23, 600–609 [DOI] [PubMed] [Google Scholar]
- 36. Lawrence M. C., Colman P. M. (1993) Shape complementarity at protein/protein interfaces. J. Mol. Biol. 234, 946–950 [DOI] [PubMed] [Google Scholar]
- 37. DeLano W. L. (2002) The PyMOL Molecular Graphics System, DeLano Scientific, San Carlos, CA [Google Scholar]
- 38. Muyldermans S. (2013) Nanobodies. Natural single-domain antibodies. Annu. Rev. Biochem. 82, 775–797 [DOI] [PubMed] [Google Scholar]
- 39. Lee M., Lloyd P., Zhang X., Schallhorn J. M., Sugimoto K., Leach A. G., Sapiro G., Houk K. N. (2006) Shapes of antibody binding sites. Qualitative and quantitative analyses based on a geomorphic classification scheme. J. Org Chem. 71, 5082–5092 [DOI] [PubMed] [Google Scholar]
- 40. El-Hawiet A., Kitova E. N., Kitov P. I., Eugenio L., Ng K. K., Mulvey G. L., Dingle T. C., Szpacenko A., Armstrong G. D., Klassen J. S. (2011) Binding of Clostridium difficile toxins to human milk oligosaccharides. Glycobiology 21, 1217–1227 [DOI] [PubMed] [Google Scholar]