Abstract
Purpose
To determine the ex vivo ability of dual-energy, dual-source computed tomography (DE-DSCT) with additional tin filtration to differentiate between five groups of human renal stone types.
Methods
Forty-three renal stones of ten types were categorized into five primary groups based on effective atomic numbers, which were calculated as the weighted average of the atomic numbers of constituent atoms. Stones were embedded in porcine kidneys and placed in a 35cm water phantom. DE-DSCT scans were performed with and without tin filtration at 80/140kV. The CT number ratio [CTR=CT(low)/CT(high)] was calculated on a volumetric voxel-by-voxel basis for each stone. Statistical analysis was performed and receiver operating characteristic (ROC) curves were plotted to compare the difference in CTR with and without tin filtration, and to measure the discrimination between stone groups.
Results
CTR of non-uric acid stones increased on average by 0.17 (range 0.03–0.36) with tin filtration. The CTR values for non-uric acid stone groups were not significantly different (p>0.05) between any of the two adjacent groups without tin filtration. Use of the additional tin filtration on the high-energy x-ray tube significantly improved the separation of non-uric acid stone types by CTR (p<0.05). The area under the ROC curve increased from 0.78–0.84 without fin filtration to 0.89–0.95 with tin filtration.
Conclusion
Our results demonstrated better separation between different stone types when additional tin filtration was used on DE-DSCT. The increased spectral separation allowed a 5-group stone classification scheme. Some overlapping between particular stone types still exists, including brushite and calcium oxalate.
Introduction
In the United States, the risk of having at least one symptomatic renal stone (nephrolithiasis) by the age of 70 is 12% for men and 7% for women [1]. Left untreated, the recurrent rate of renal stone disease is approximately 50% in 5–10 years and 75% in 20 years [2]. The result is a national healthcare burden from nephrolithiasis that is estimated to exceed $5.3 billion per year [3]. In order to decrease both the incidence and recurrence of nephrolithiasis, a better understanding of the pathophysiology of renal stones is needed. Toward this end, an analysis of the mineral composition of renal calculi provides important information regarding the underlying etiology of stone formation, and can facilitate appropriate patient management. Thus, an accurate in vivo technique to determine stone composition may facilitate early and more efficacious interventions and limit stone recurrence.
In recent years, non-contrast-enhanced computed tomography (CT) has become the preferred imaging modality for the diagnosis of acute ureterolithiasis because of its high sensitivity and specificity and its ability to detect radiolucent stones types, such as those comprised of uric acid [4, 5]. Use of non-contrast-enhanced CT to identify stone composition was first investigated in the early 1980s [6, 7], and later studies confirmed the potential for using CT numbers to determine stone compositions [8, 9]. However, clinical use of the method was hampered by various factors [9, 10], primarily the broad overlap of CT numbers from stones having different compositions, and the dramatically different CT numbers possible (due to differences in mineral concentrations) for stones with identical compositions.
Dual-energy CT (DECT) utilizes the x-ray attenuation information from two different beam energies to characterize chemical composition, and thus has the potential to overcome the limitations of single-energy CT. The principles of DE material decomposition were first described more than 30 years ago by Alvarez and Macovski [11] and later by Kalender et al [12]. However DECT was not widely adopted into clinical practice until recently [13, 14]. DECT may be implemented technically using several different approaches, one of which is to perform DECT using a dual-source CT scanner. A DSCT system is equipped with two x-ray source/detector pairs mounted orthogonally on the same x-ray gantry [13]. Dual-energy post-processing is then used to classify different stone types based on an index derived from CT number measurements at both energies, which is independent of variations in stone density [15–18]. Several in vitro and in vivo studies have demonstrated the ability of dual-source DECT to accurately differentiate uric acid (UA) stones from non-UA stones [15–20]. The high sensitivity and specificity of this technique [15, 18] has led to commercial implementation and routine clinical use.
However, due to the clinical need to differentiate between the remaining non-UA stones, extending the technique beyond simply identifying UA versus non-UA stones is a current goal. Stone composition is an important predictor for the efficacy of noninvasive extracorporeal shock wave lithotripsy (ESWL), or whether other surgical treatments would be preferred. In particular, invasive or surgical stone removal, including ureteroscopic lithotripsy, percutaneous nephrolithotomy and laparoscopic stone removal, is often preferred for patients with certain types of non-UA stones, such as cystine, oxalate and brushite, which are particularly difficult for ESWL because of their resistance to fragmentation [21]. Additionally, since certain metabolic abnormalities and systemic diseases underlie specific stone type formation, special dietary and medications are required for proper treatment or to reduce the risk of recurrent stones. For example, the treatment and prevention of cystine stones often includes urinary alkalinization, a low-sodium and purine diet, and cysteine-binding drugs. Such a management approach is not correct for calcium phosphate stone formers because the solubility of calcium phosphate falls with rising pH. Although analysis of the 24 hour urine composition can be used to infer stone type with fair accuracy, and therefore suggest appropriate treatment strategies, knowledge of the actual stone composition is more definitive. Therefore, the ability to noninvasively differentiate between various non-UA stone types would help physicians prescribe the most appropriate management strategy, even before a stone is passed or removed from a patient. Recent studies have suggested the potential for discriminating between different types of non-UA renal stones using the first implementation of dual-source DECT [19, 20].
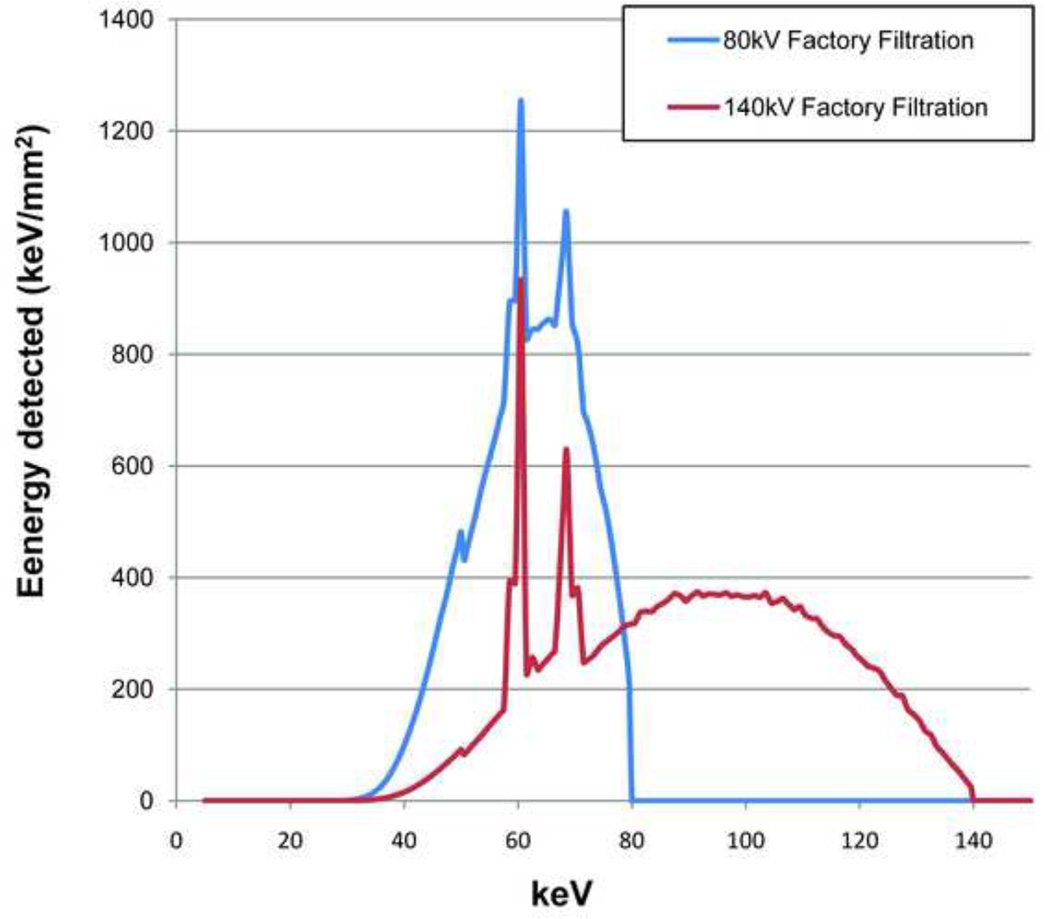
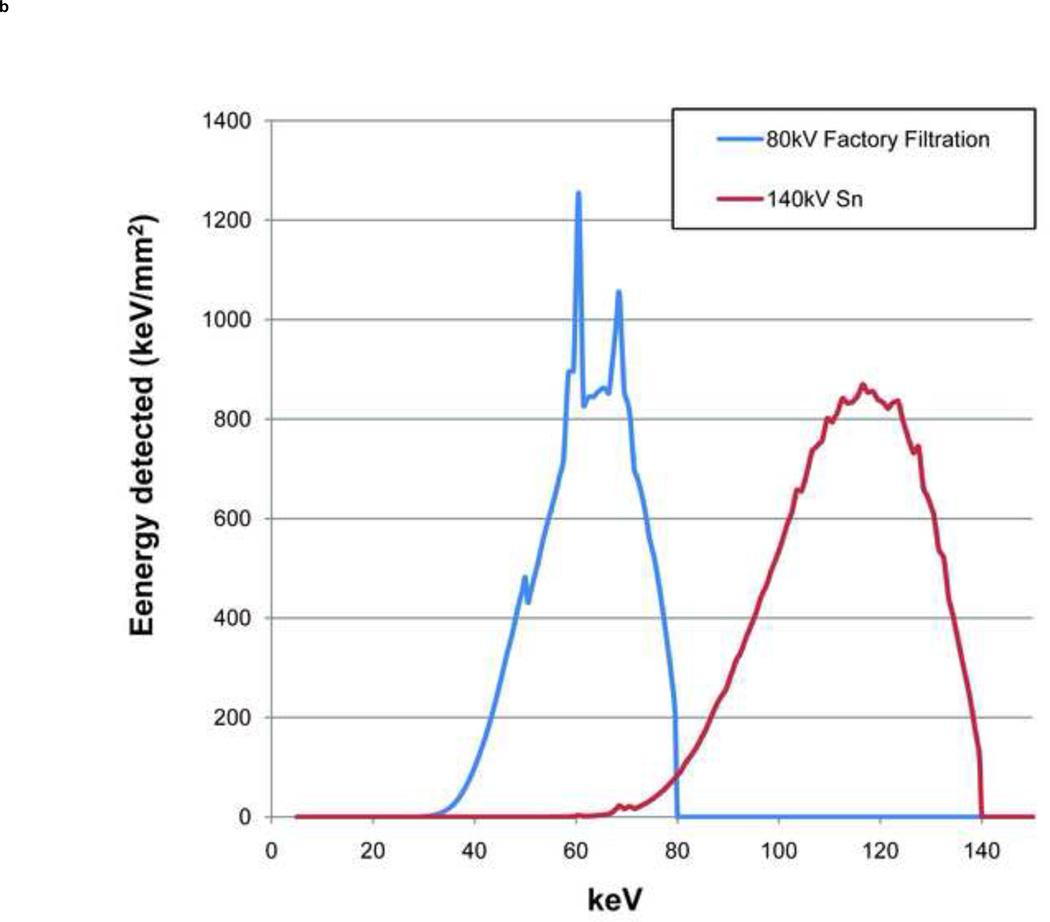
The ability of DECT to discriminate between two materials is highly dependent on the difference between each material’s characteristic CT number ratio (CTR), which is defined as the CT number of a given material in the low energy image to the CT number of the same material in the high-energy image [22]. The difference between the CTR values for any two materials is determined by the separation between the low- and high-energy spectra and the effective atomic numbers of the evaluated materials [22]. The larger the spectral separation, the better two materials can be discriminated, especially in the case of non-UA stones which all have similar effective atomic numbers. Spectral separation can be increased by using different filtration on the two x-ray tubes. In the first generation dual-source scanner (SOMATOM Definition DS, Siemens Healthcare), both x-ray tubes have the same filtration and the X-ray spectra generated at two different tube potentials have significant overlap. A previous study used simulations to show that use of additional tin filtration at the high-energy x-ray tube of a DSCT system operated at 80/140kV can reduce the spectral overlap from 93% to 27% and increase spectral separation from 29 keV to 44 keV (Figure 1) [22]. The results were further validated by two recent ex vivo studies which manually modified the first generation DSCT scanner by adding a tin filter to the high energy tube. Improved discrimination between calcium and iodine was demonstrated [23] (Ramirez Giraldo et al., presented at the 2009 95th Scientific Assembly and Annual Meeting of Radiological Society of North America). These experiments also showed that dual-energy CT material discrimination was improved, without an increase in radiation dose compared to single-energy CT techniques [23].
Fig. 1.
The high (140 kV) and low (80kV) energy spectra simulated for the original factory-installed filtration (a) and with the additional tin filtration (Sn) for the high-energy spectrum (b).
Hence, use of additional filtration for the high-energy x-ray beam may allow non-UA stone types to be separated. In this study, we prospectively evaluated the ability of a second generation DSCT system (SOMATOM Definition Flash, Siemens Healthcare), where the additional filtration of the high energy beam is incorporated into the scanner, to differentiate between five groups of ten clinically relevant renal stone types.
Materials and methods
This retrospective study was approved by our institutional review board, biospecimen committee, and conflict of interest committee. All stones were obtained without any patient-identifying information and hence informed consent was waived.
Renal stones
Forty-three human renal stones of ten different types were obtained from our institutional mineral analysis laboratory. Stone characteristics (Table 1) were determined prior to the DECT scan using a previously validated micro-CT technique [24] and Fourier transform infrared spectroscopy. For uric acid (UA), uric acid dihydrate (UAD), ammonium acid urate (AAU), cystine (CYS), calcium oxalate monohydrate (COM), calcium oxalate dihydrate (COD), brushite (BRU), carbonate apatite (CAP), and hydroxyapatite (HAP), stones were required to contain 95% or more of the component of interest (i.e. stones were of a single type). Struvite (STR) stones were required to have at least 10% magnesium ammonium phosphate hexahydrate, since these infection stones are often admixed with variable amounts of apatite [25]. All stones studied were 4 mm in greatest diameter, or larger. The effective atomic number was calculated as the weighted average of atomic numbers of the compound, according to the stone’s chemical formula (Table 1), with the addition of a calcium cation to the magnesium ammonium phosphate hexahydrate for struvite [26].
Table 1.
Stone type, chemical formula, sample size, approximate stone diameter, and effective atomic number of the 43 stones used in this study.
| Group Number |
Stone type | Chemical formula | Sample numbers |
Size (mm) |
Effective atomic number |
|---|---|---|---|---|---|
| 1 | Ammonium acid urate | C5H3N4O3NH4 | 3 | 6–7 | 6.84 |
| Uric acid | C5H4N4O3 | 2 | 5–8 | 6.91 | |
| Uric acid dihydrate | C5H4N4O3·2H2O | 4 | 4–7 | 7.01 | |
| 2 | Cystine | C6H12N2O4S2 | 9 | 4–12 | 10.78 |
| 3 | Struvite | CaMgNH4PO4·6H2O* | 4 | 5–11 | 12.17* |
| 4 | Calcium Oxalate Dihydrate | CaC2O4·2H2O | 2 | 6–10 | 12.99 |
| Calcium Oxalate Monohydrate | CaC2O4·H2O | 5 | 4–7 | 13.45 | |
| Brushite | CaHPO4·2H2O | 9 | 5–10 | 13.82 | |
| 5 | Carbonate Apatite | Ca10(PO4)6(CO3) | 2 | 4–10 | 15.74 |
| Hydroxyapatite | Ca10(PO4)6(OH)2 | 3 | 5–10 | 15.86 | |
Struvite stones are commonly a mixture of magnesium ammonium phosphate and apatite [25].
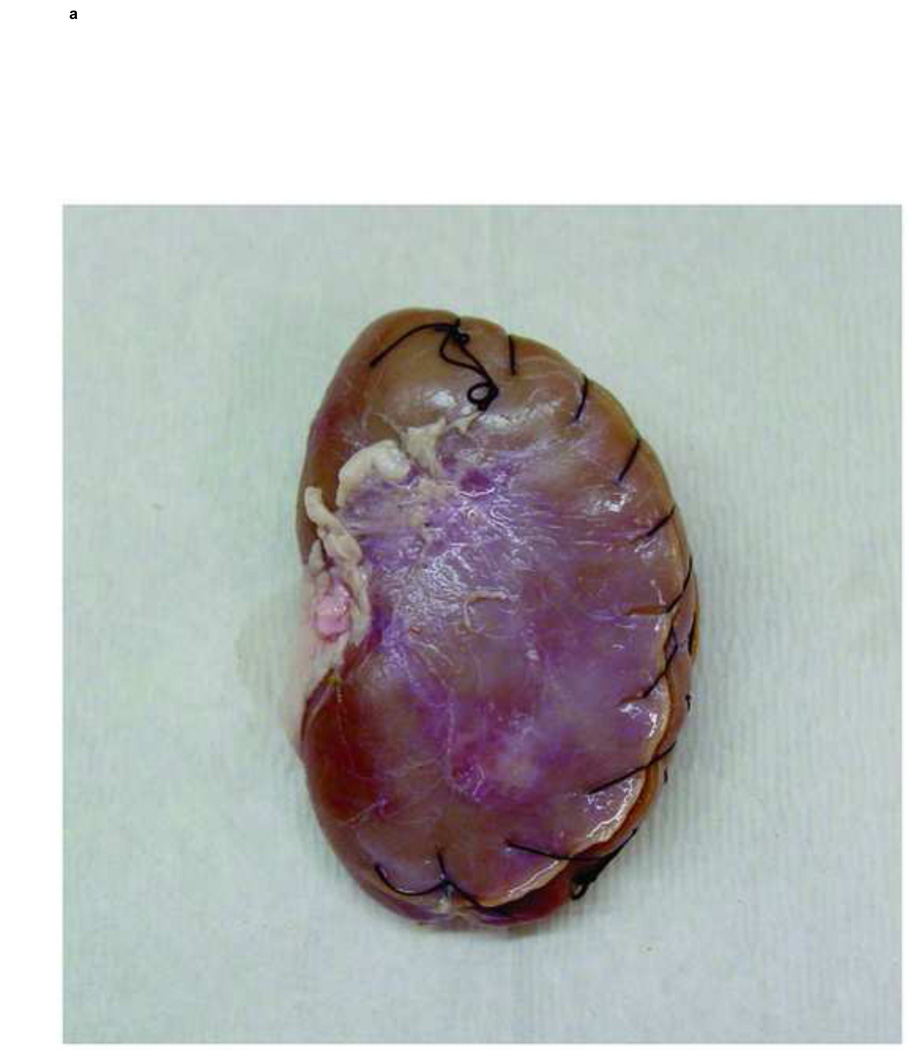
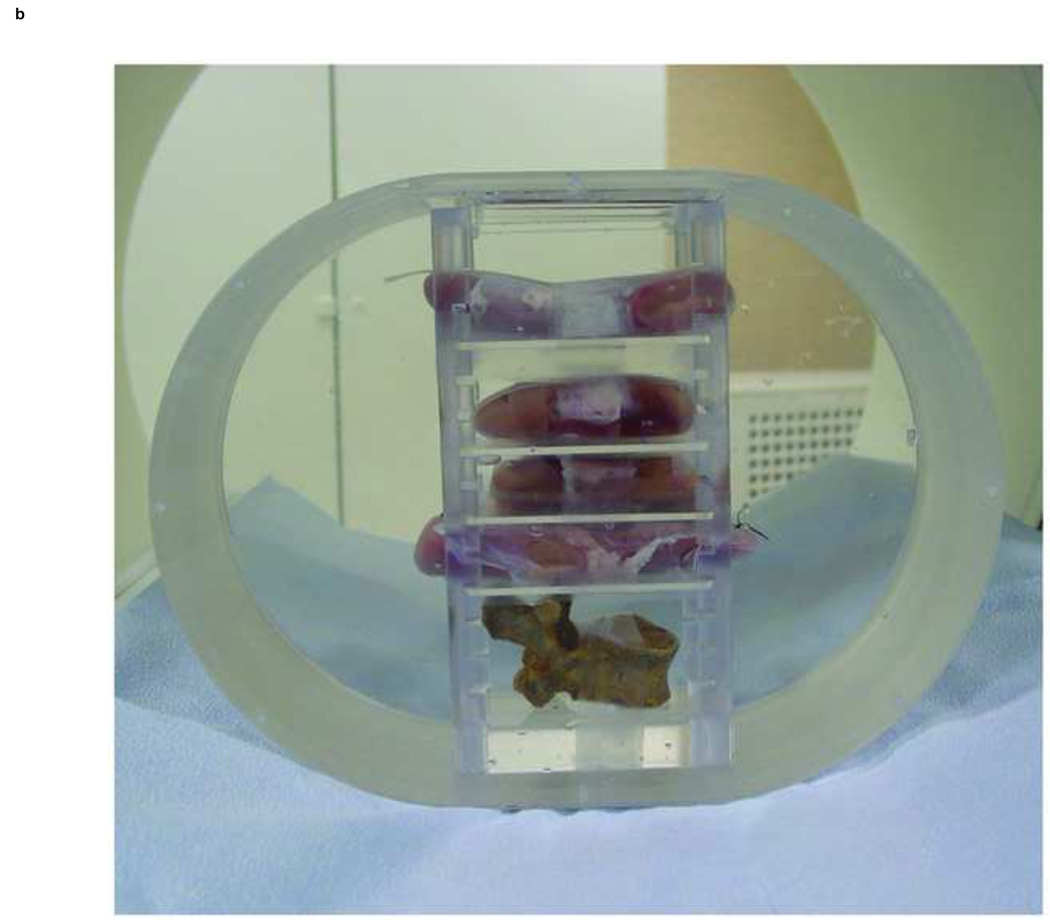
All stones were hydrated in distilled water for twenty-four hours and then embedded in fresh porcine kidneys. Considerable effort was made to eliminate air bubbles from around the stones. The stone-filled kidneys were placed in a 35 cm water phantom anterior to a cadaver spine to create realistic scattering and attenuation conditions for the clinical setting (Figure 2).
Fig. 2.
Photographs show a porcine kidney that has renal stones sutured inside (a) and the set up of the water phantom (b). Stone-filled kidneys were placed in a 35cm water phantom anterior to a cadaver spine to create realistic scattering and attenuation conditions (b).
CT data acquisition and post-processing
Spiral CT scanning was performed on a 128-slice dual-source CT scanner (SOMATOM Definition Flash, Siemens Healthcare, Forchheim, Germany). A clinical dual-energy kidney stone protocol was used with and without tin filtration (Table 2). On this system, the additional tin filter is moved into the path of the high energy beam when this feature is selected at the scan. The total volume CT dose index (CTDIvol) values were set to match the CTDIvol values from our routine abdominal/pelvis protocol for a comparable-sized patient [27, 28].
Table 2.
Scan parameters and volume CT dose index (CTDIvol).
| 80/140 kV with tin | 80/140 kV | |
|---|---|---|
| Additional tin filtration | Yes | No |
| Tube potential (A/B) | 80/140 kV | 140/80 kV |
| Effective mAs (A/B)* | 340/184 | 62/341 |
| Collimation | 2×20×0.6 mm | 2×20×0.6 mm |
| Rotation time (s) | 0.5 | 0.5 |
| Pitch | 0.6 | 0.6 |
| Automatic exposure control | Off | Off |
| CTDIvol (mGy) | 16.4 | 18.3 |
effective mAs: effective tube-current-time product = tube current time product/pitch
Images were reconstructed at 1.0 mm thickness and 0.8 mm interval, with a 150-mm field of view (FOV) and a medium smooth kernel (D30). Image data were post-processed using custom MatLab-based software (MatLab, version 2009a, Math-Works, Natick, MA). A square region of interest (ROI) was defined manually to include the whole stone, as visualized in a maximum intensity projection (MIP) image, and was then extended in the z-dimension, creating a three-dimensional rectangular ROI. Within each ROI, the stone was segmented from the kidney tissues by using a predefined threshold for both the low- and high-energy CT images. The CTR value of each individual voxel was calculated as the CT number at 80kV divided by CT number at 140kV. The CTR values of all voxels within the segmented volume were averaged to indicate the CTR of each specific stone.
Data analysis
The CTR values for each stone were plotted in order of increasing CTR with and without use of the tin filter to demonstrate the impact of the tin filtration. Statistical significance of the data was evaluated using a paired t-test. A p < 0.05 was considered to be statistically significant.
To evaluate whether the increased spectral separation achieved with use of the additional tin filtration improved the ability to differentiate stone composition, the ten evaluated stone types were categorized into five primary groups based on their effective atomic numbers (Zeff). Group-1: AAU, UAA, and UAD (Zeff =6.84–7.01, n=9); Group-2: CYS (Zeff = 10.78, n=9); Group-3: STR (Zeff =12.17, n=4); Group-4: COM, COD, and BRU (Zeff =12.99–13.63, n=16); and Group-5: CAP and HAP (Zeff =15.74–15.86, n=5). Student t-tests between two sets of unpaired data (with assumed unequal variances) were performed to compare the mean CTR between adjacent stone groups (e.g. group 1 vs group 2, group 2 vs group 3, etc.). A p < 0.05 was used to indicate statistical significance.
Receiver operating characteristic (ROC) curves (sensitivity on the y-axis against 1-specificity on the x-axis) were plotted for multiple CTR threshold values, which were used to separate adjacent stone groups. The curve that reaches closest to the upper left corner, corresponding to the best sensitivity and specificity, suggests the optimal cut-off point for stone type differentiation. The area under the curve (AUC) was calculated and compared between with and without tin data. To visually characterize stone types, a five-color coding scheme was implemented in our MatLab software code.
Results
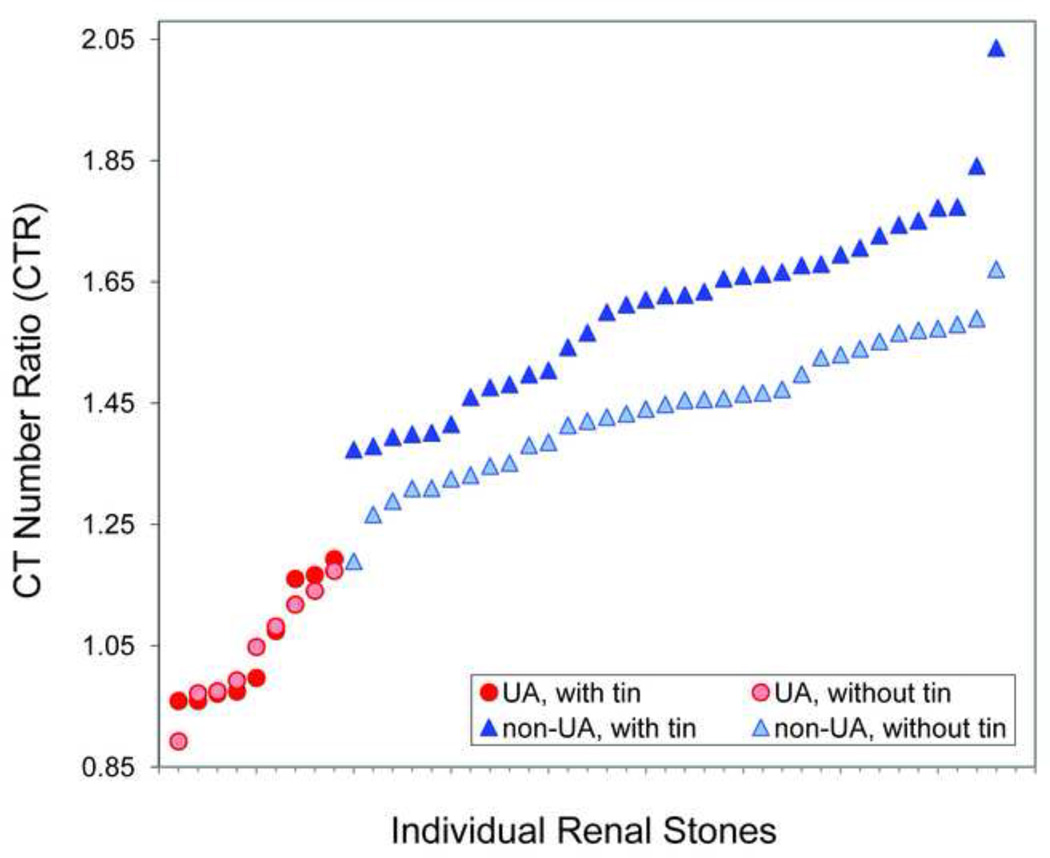
A total of forty-three renal stones were included in this study. The average stone size was 6.6 mm (range, 4–12 mm). The mean CTR of all stones was 1.49 (range, 0.96–2.04) when scanned with 80/140 kV and additional tin filtration, as compared to 1.36 (range, 0.89–1.67) at 80/140 kV without tin filtration (Table 3).
Table 3.
CT number ratio (lowest, median and highest values) of ten different stone types.
| 80/140 kV with tin |
80/140 kV without tin |
||||||
|---|---|---|---|---|---|---|---|
| n | Lowest | Median | Highest | Lowest | Median | Highest | |
| Uric acid | 2 | 0.97 | 0.99 | 1.00 | 0.89 | 0.93 | 0.97 |
| Uric acid dihydrate | 4 | 0.96 | 0.96 | 1.07 | 0.97 | 1.02 | 1.14 |
| Ammonium acid urate | 3 | 1.16 | 1.17 | 1.19 | 1.08 | 1.12 | 1.17 |
| Cystine | 9 | 1.37 | 1.40 | 1.50 | 1.19 | 1.33 | 1.43 |
| Struvite | 6 | 1.48 | 1.55 | 1.63 | 1.31 | 1.41 | 1.45 |
| Calcium Oxalate Monohydrate | 3 | 1.69 | 1.73 | 1.75 | 1.50 | 1.53 | 1.57 |
| Calcium Oxalate Dihydrate | 5 | 1.61 | 1.67 | 1.68 | 1.41 | 1.44 | 1.47 |
| Brushite | 9 | 1.57 | 1.63 | 1.77 | 1.39 | 1.47 | 1.59 |
| Carbon Apatite | 2 | 1.73 | 1.78 | 1.84 | 1.50 | 1.52 | 1.55 |
| Hydroxyapatite | 4 | 1.72 | 1.76 | 2.04 | 1.56 | 1.57 | 1.67 |
Increased CTR of non-uric acid stones with use of additional tin filtration
The 34 non-UA stones included 7 types: cystine, struvite, calcium oxalate dihydrate, calcium oxalate monohydrate, brushite, carbonate apatite, and hydroxyapatite. The CTR of non-uric acid stones increased by an average value of 0.17 (range, 0.03–0.36) with tin filtration. No significant change was observed in uric acid stones (UA, UAD and AAU) (Figure 3).
Fig. 3.
Graphs shows CT number ratio (CTR) of individual renal stones, sorted in ascending order by CTR. The CTR of non-uric acid stones was always increased using the additional tin filtration. No increase in CTR was observed for uric acid stone types.
Improved separation in CTR of stone types due to additional tin filtration
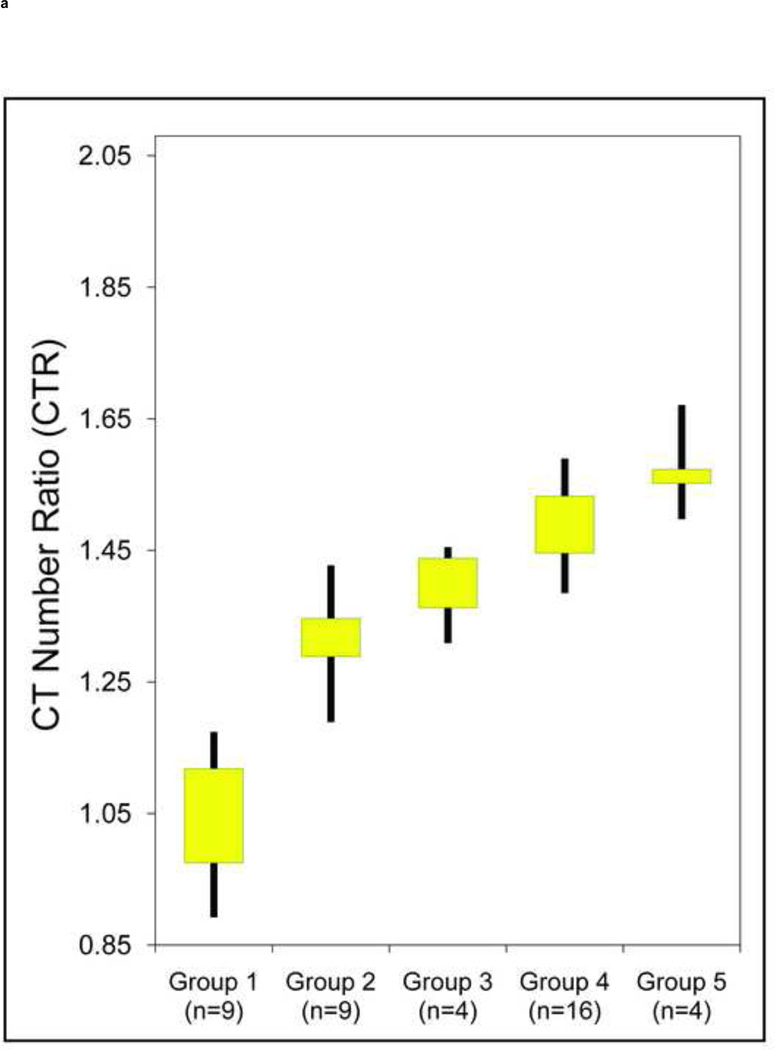
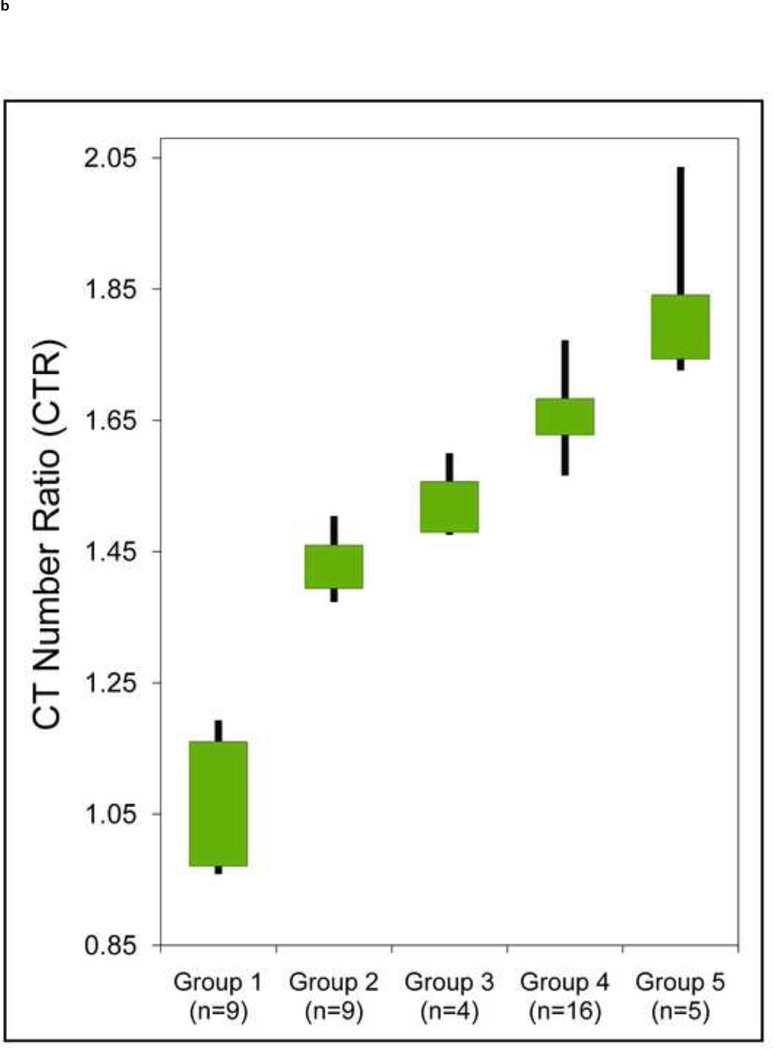
Sufficient separation between the UA stone types and non-UA stones was observed both with and without tin filtration (p < 0.01) (Figure 4). However, the CTR values for non-UA stone groups were not significantly different (p > 0.05) between any of the two adjacent groups when the scan was performed without tin filtration (Figure 4a): Stone CTR range for Group-2: 1.19–1.43, Group-3: 1.31–1.45, Group-4: 1.39–1.59, and Group-5: 1.50–1.67. Hence, with identical beam filtration on each tube of the DSCT scanner, insufficient differentiation of non-UA stone types was observed. However, with use of the additional tin filtration on the high-energy x-ray tube (Figure 4b), significantly different separation of non-uric acid stone types was observed (p < 0.05): Group-2: 1.37–1.50, Group-3: 1.48–1.63, Group-4: 1.57–1.77, Group-5: 1.72–2.04.
Fig. 4.
Box-and-whisker plot shows the range (whiskers) and first and third quartiles (boxes) of CT number ratios (CTR) values of five groups of kidney stone types: Group 1: uric acid, uric acid dihydrate and ammonium acid urate; Group 2: cystine; Group 3: struvite; Group 4: calcium oxalate monohydrate, calcium oxalate dihydrate and brushite; Group 5: hydroxyapatite and carbonate apatite. The separation between these groups is shown without (a) and with (b) tin filtration, both at 80/140 kV.
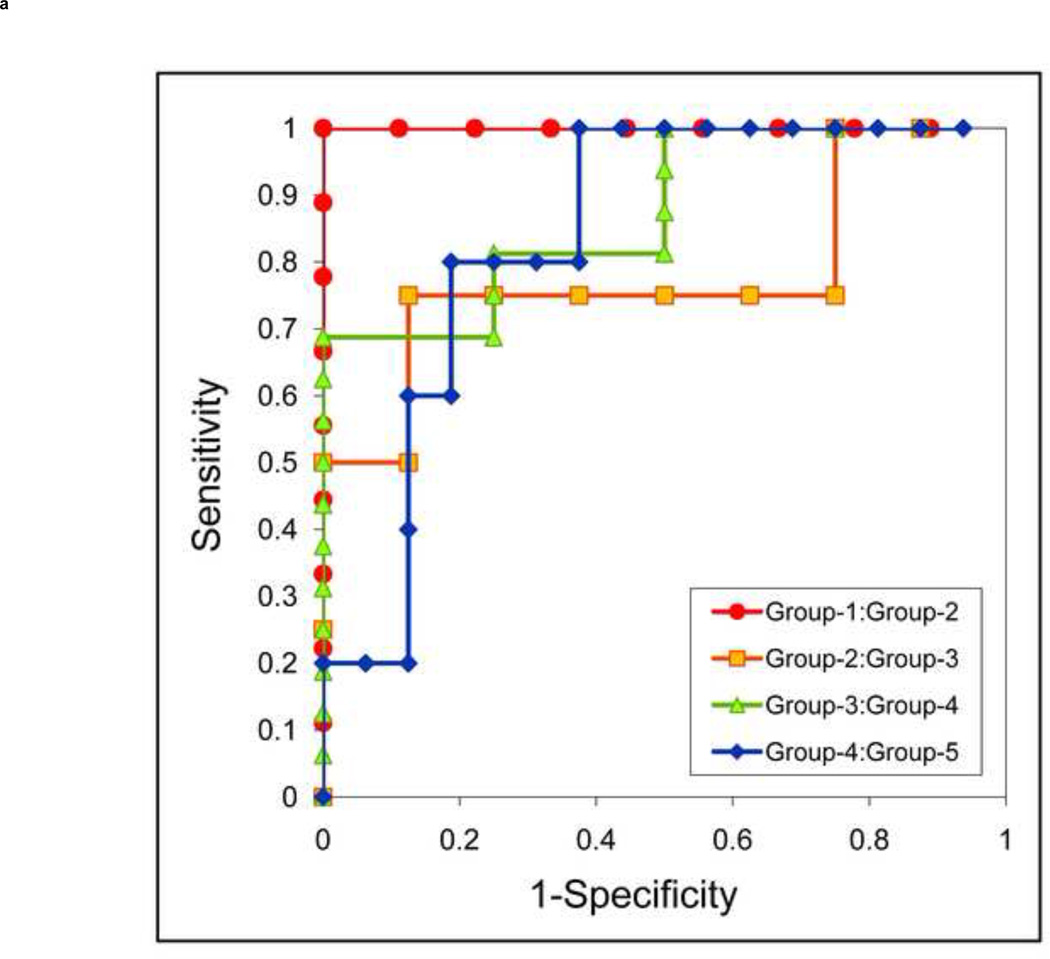
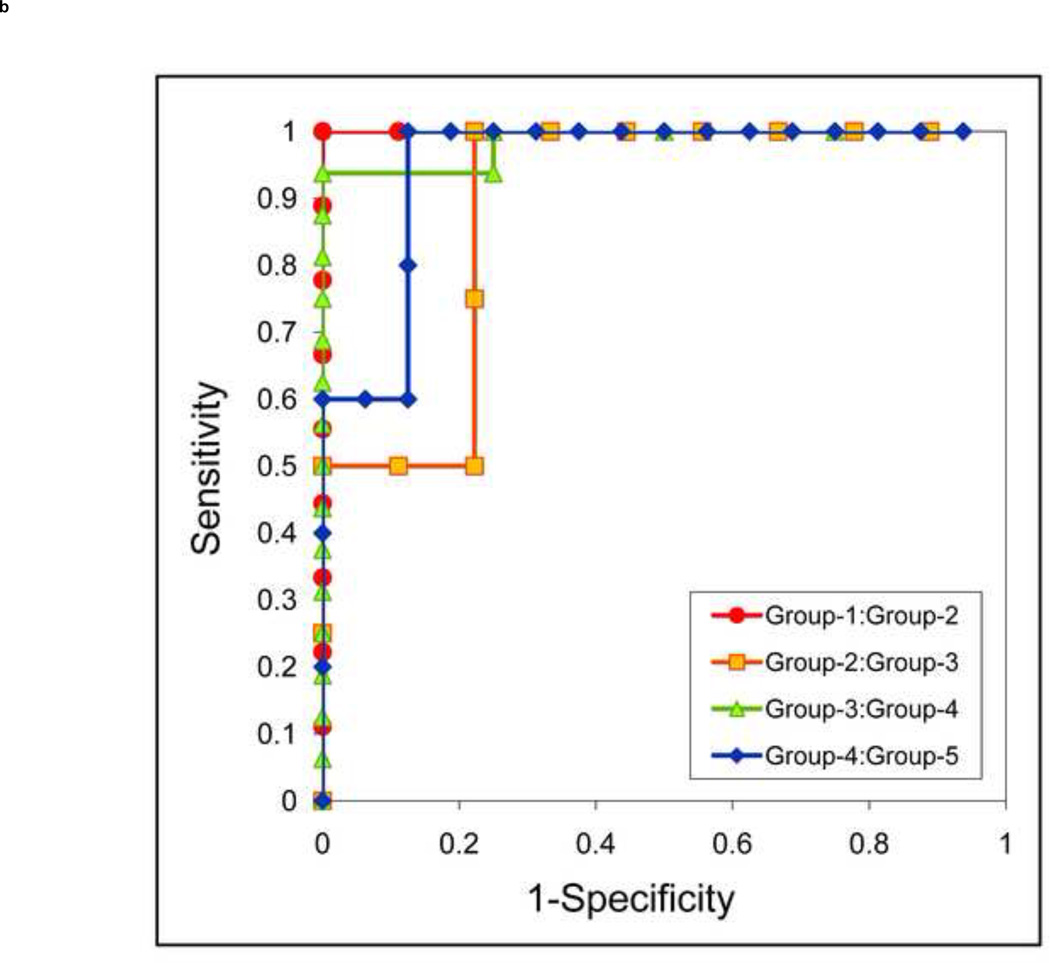
Without tin filtration (Figure 5a), the area under the ROC curve was 1.00 (95% CI, 1.0–1.0) for differentiating Group-1 stones from Group-2, 0.78 (95% CI, 0.51–1.0) for differentiating Group-2 from Group-3, 0.88 (95% CI, 0.71–1.0) for differentiating Group-3 from Group-4, and 0.84 (95% CI, 0.60–1.0) for differentiating Group-4 from Group-5. The area under the ROC curve (Figure 5b) with tin filtration was 1.00 (95% CI, 1.0–1.0), 0.89 (95% CI, 0.66–1.0), 0.98 (95% CI, 0.93–1.0), and 0.95 (95% CI, 0.81–1.0), respectively, for the same between-group comparisons.
Fig. 5.
Receiver Operating Characteristic (ROC) analysis of the stone composition differentiation using dual-source DECT with and without additional tin filtration. Four ROC curves are illustrated to indicate the ability of DECT to differentiate five stone groups: Group 1: uric acid, uric acid dihydrate and ammonium acid urate; Group 2: cystine; Group 3: struvite; Group 4: calcium oxalate monohydrate, calcium oxalate dihydrate and brushite; Group 5: hydroxyapatite and carbonate apatite. The ROC curves with tin filtration (b) show larger area under the curve than without tin filtration (a), which suggests a better method to differentiate the five stone groups.
Improved renal stone characterization with tin filtration
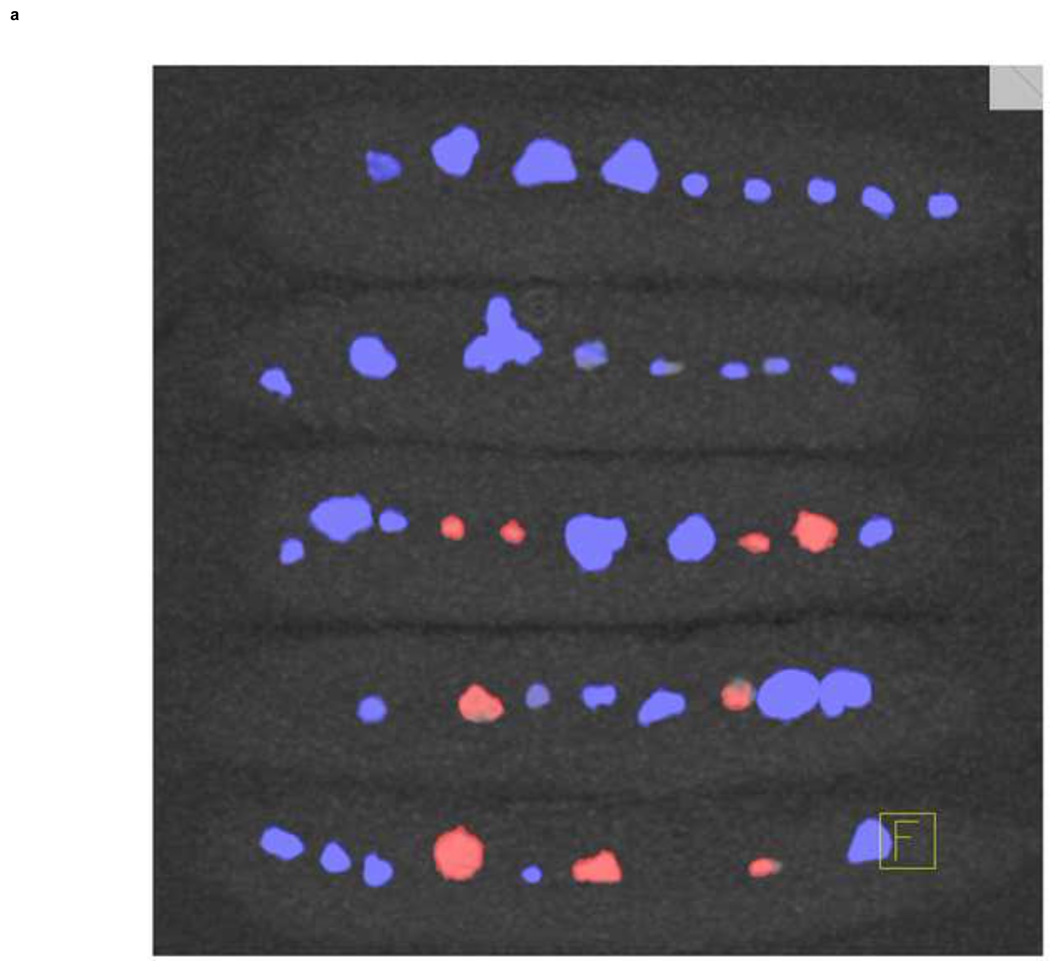
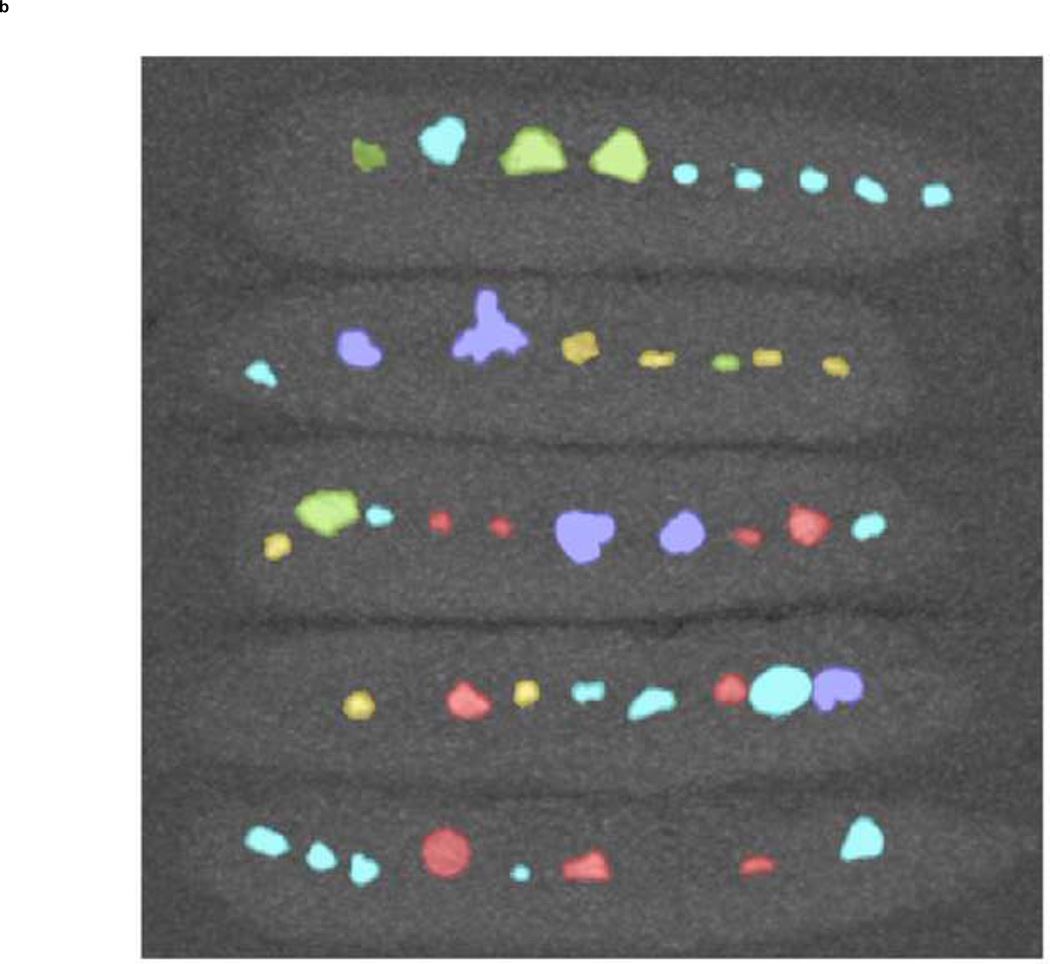
The improved separation in CTR between the five stone groups when additional tin filtration was used to increase spectral separation may allow clinical characterization of unknown stones into one of the five stone groups. The cut-off point (threshold) between two distinct groups was determined based on the ROC curves (the point nearest to the upper left corner, corresponding to the best sensitivity and specificity couple of the test). The CTR range for characterizing a stone into one of the five groups was determined to be: Group-1: below 1.19, Group-2: 1.19–1.46, Group-3: 1.46–1.60, Group-4: 1.60–1.71, and Group-5: above 1.71. Different color codes were assigned to each CTR range. Figure 6 demonstrates the use of a 5-color coding scheme.
Fig. 6.
Stone composition characterization with color coding. The commercially-available uric acid vs. non-uric acid differentiation algorithm with blue-red color coding is shown in the left panel (a); red: uric acid, blue: non-uric acid. Using dual-source DECT with additional tin filtration, it was possible to further characterize the same stones into one of five groups (b). These five groups and their representing colors are: Group 1 in red: uric acid, uric acid dihydrate and ammonium acid urate, Group 2 in yellow: cystine; Group 3 in green: struvite; Group 4 in turquoise: calcium oxalate monohydrate, calcium oxalate dihydrate and brushite; Group 5 in purple: hydroxyapatite and carbonate apatite.
Discussion
In this study, we showed that increased spectral separation, achieved by adding tin filtration to the high-energy tube of a dual-source CT system, increased the differences in CTR between non-UA stone types. Consequently, the ten evaluated stone types were able to be separated into five distinct groups, one UA group and four non-UA groups. Without additional tin filtration, the non-UA stones types could not be differentiated.
Several studies have been performed to evaluate the ability of DECT to differentiate between different types of non-UA renal stones. Matlaga and colleagues demonstrated statistical significance between UA and COM stones and UA and HAP stones [19]. However, significant overlap of CTR among non-uric acid stones was reported. Grosjean et al. used a 16-slice multi-detector CT scanner to perform sequential CT scans at two energy levels, 80kV and 120kV [29]. By calculating the difference of CT numbers at two energies, six stone types, including UA, CYS, STR, COM/COD and BRU (APA stones were not included in this study) appeared distinctive. Despite the relatively larger sample size (n=12 to 64 for each stone type), the standard deviation (SD) of the CT numbers within each stone type was small (at 80kV, the SD/mean was 3%–5% for most stone types and 10% for struvite). This indicates that the stones selected in this study were likely to be similar to each other in terms of density, porosity, and morphology. A more significant difference between the stone types used in the Grosjean study would be expected if an 80/140kV scan with additional tin filtration were to be used and CT number ratio, instead of CT number difference, was evaluated. Furthermore, additional scan (i.e. the 80kV scan) increases the radiation dose of the study if the dose at 120kV is not sufficiently reduced, impeding its adoption in clinical practice. In the study by Thomas et al, although six different stone types were included (excluding struvite stones), cystine was the only non-UA stone to be differentiated from the other non-UA stone types [30]. Differentiation between calcified stones was not achieved. In the study by Boll et al, with a first generation DSCT (i.e. without additional tin filtration), an advanced data processing algorithm was used to generate specific attenuation identifiers Uslope, which enabled the differentiation of five groups of renal stones: UA, CYS, STR, calcium oxalate (COX) and calcium phosphate, and BRU [20]. The algorithm was not described in detail. The sample size was limited for several stone types (n=4, 3, 5 for CYS, STR and BRU respectively), and outliers were retrospectively identified and excluded from the analysis, limiting the ability to generalize the results. Compared to these previous studies, our study used relatively realistic conditions. We selected only one stone from each patient. The SD/mean values of CT numbers at 80kV were 13%, 34%, 30%, 19% and18% for CYS, STR, COX, BRU and APA stones respectively, indicating a relatively diverse sample of stones within each type. A 35 cm water phantom was used to better reflect actual patient attenuation. The stones were embedded in porcine kidneys to eliminate contact with materials such as rubber or plastic, which might alter the measured CT attenuation value of the stone. The ratio of the CT number at each energy was used for analysis, which can easily be adopted in clinical practice.
To measure the attenuation values at low and high energies and calculate the DE CT number ratio or index, most of the previous studies employed a user defined circular or free-hand ROI in one or several transverse sections [16–20, 29]. However, consistent drawing of ROIs is potentially influenced by the stone shape and its orientation in the scan, visualization window and level, and particularly the investigator’s judgment. Thus a manual ROI approach in single or multiple planes is a subjective assessment and may introduce systematic errors. In our study, we used a volumetric approach for stone segmentation, which involved only certain CT number thresholds. No personal judgment was employed. Hence, the measured CTR values were solely dependent on chemical composition and the scan protocol (in this case, either 80kV with or without tin filtration of the 140 beam), and was independent of stone shape, orientation or investigator’s decisions. This provided a consistent analysis approach.
In 1979, Kelcz et al were the first to show the importance of different spectral filtration for DECT [31]. Primak el al used simulations to determine how additional filtration could improve DECT imaging for the purpose of material discrimination [22]. The results were later validated in ex vivo studies using a modified first generation DSCT [23] (Ramirez Giraldo et al., 2009 RSNA meeting). Our ex vivo study is an extension of all these previous works to a more challenging scenario, where the effective atomic numbers between non-UA stones are closer to each other compared to the differences between calcium, iron and iodine evaluated previously. Also, our study is the first to evaluate the ability of a second generation of the DSCT scanner to differentiate non-UA stone types. On this system, the tin filter is commercially implanted while for the first generation DSCT the filter had to be manually inserted into the beam. While the second generation DSCT systems may not become as widely utilized as the current scanner systems, our results may be more directly applicable to clinical practice.
The majority of the evaluated stones in this study were between 4–12 mm in maximum diameter. Studies show that about 95% of ureteral stones of 4 mm or smaller will pass spontaneously [32], and several medical interventions can potentially increase passage rate [33]. Hence, surgical interventions are typically not initially recommended for these small stones, whereas more than 50% of renal stones with a diameter > 4 mm need surgical intervention or extracorporeal shock wave lithotripsy (ESWL) [32]. Thus, the non-invasive identification of stone composition is clinically more important for larger stones that are less likely to pass spontaneously.
In our study, brushite stone was in the same group as the two calcium oxalate stones because of their similar effective atomic numbers. While brushite stones are rare, they raise special clinical concerns. Different from struvite and hydroxyapatite stones, which can easily be disintegrated by lithotripsy, brushite stones require a high number of shock waves at a high energy level, as well as repeated treatment [34]. Also, rapid regrowth of brushite fragments is more common than for other stone types [34]. Thus, it is clinically important to provide in vivo identification of brushite stones.
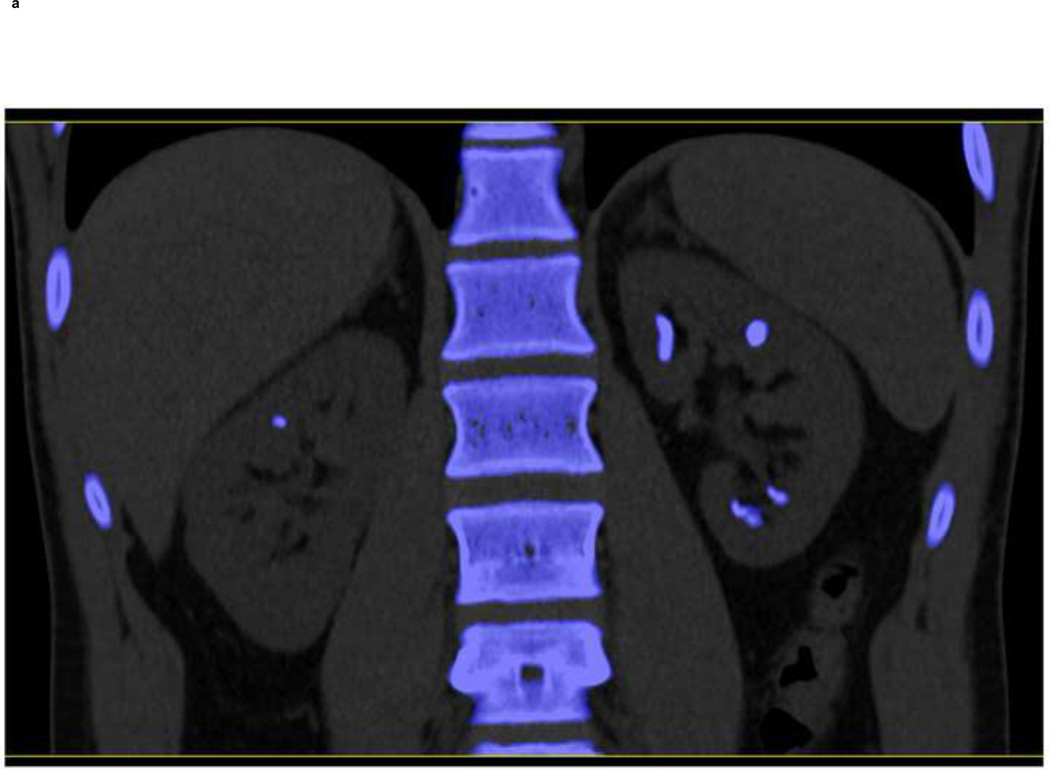
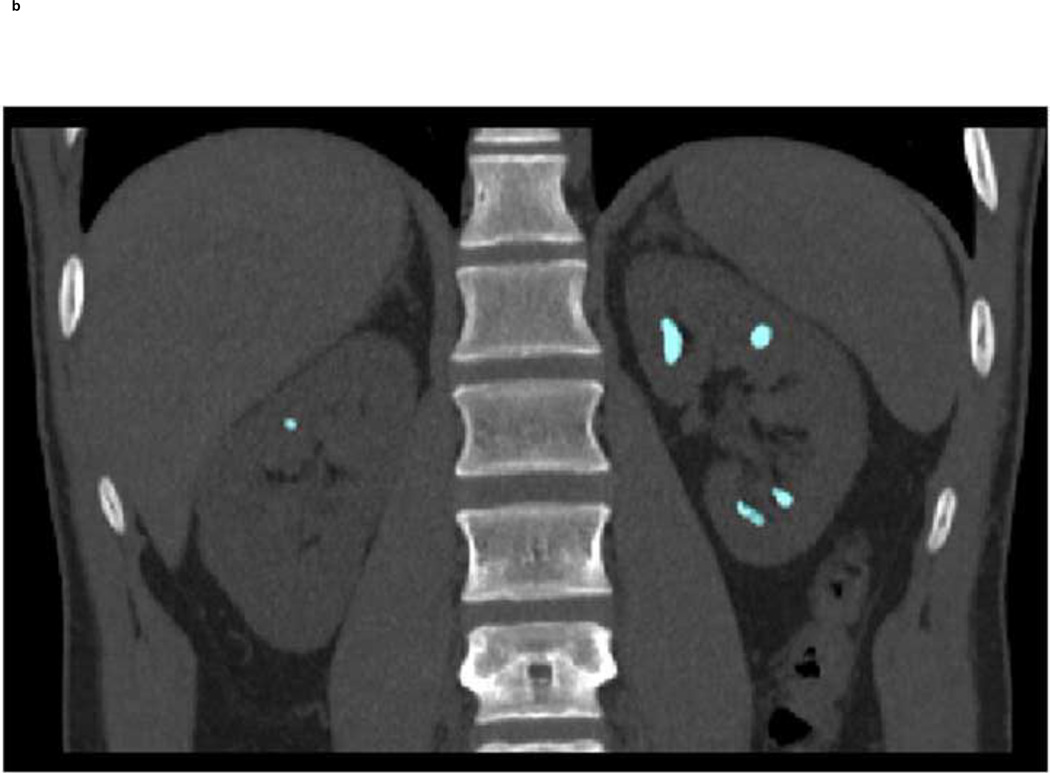
Although our study demonstrates the feasibility of further differentiating renal stones into one of the five groups using dual-source DECT with additional tin filtration, this work was done ex vivo with phantoms. It remains to be determined how effective this technique will be in patients. In Figure 7, we show an example of a clinical case. Image data were evaluated with the commercial DE software (“Kidney Stone”, Syngo CT Workplace, Siemens Healthcare) currently used in our clinical practice to differentiate UA from non-UA stones. Additionally, the algorithm described in this study was used to characterize stone composition into one of five groups. Multiple stones were characterized as non-UA composition using the commercial software (Figure 7a). With tin filtration and the developed algorithm, we were further able to characterize the stones as belonging to Group-4 (Figure 7b, coded in turquoise), indicating either calcium oxalate or brushite stones.
Fig. 7.
A clinical example demonstrating the feasibility of using dual-source DECT with tin filtration to differentiate non-UA stone types. Using commercially software (“Kidney Stone”, Syngo CT Workplace, Siemens Healthcare), the stones were coded in blue (a) indicating a non-UA stone type. With dual-source DECT and additional tin filtration on the high energy tube, it was possible to characterize these stones into Group-4, which was defined to include three stone types: calcium oxalate mono- or dihydrate or brushite. Group-4 is coded in turquoise (b). The stones were subsequently removed from the patient with percutaneous nephrolithotomy and were confirmed to be pure calcium oxalate dihydrate by both Fourier transform infrared spectroscopy and micro-CT.
One of the limitations in this study is the relatively small stone sample size and the intentional selection of pure stones. This study considered only pure stones, which comprised at least 95% of one composition, and excluded those which did not match this criteria. The only exception was struvite stones because these are always formed with a second substance, which is usually apatite. To enroll only pure stones reduced the number of patients represented in our study. This is because most renal stones are of mixed composition and are more common than pure stones [35]. The improvement made in discriminating pure stones documented here will also apply to stones of mixed compositions.
In summary, the ability of DECT to discriminate between renal stone compositions depends on the difference between the CTR of the materials, which is determined by the difference in atomic numbers of stone components, and spectral separation. The effective atomic numbers of the UA stone types fall into a narrow range (6.84–7.01). The effective atomic number numbers of non-UA stones are higher and more varied (range, 10.78–15.56). The large difference in the effective atomic numbers of UA and non-UA stones explains the ability of DECT to differentiate UA from non-UA with high accuracy. However, the differences in the effective atomic numbers among the common non-UA stones, such as cystine, struvite, calcium oxalate, brushite and apatite, are much smaller (Table 1). This work demonstrated that dual-source DECT, with increased spectral separation due to filtration of the high-energy beam, may allow in vivo identification of multiple types of non-UA stones. However, properly differentiating some stone types, such as the discrimination between brushite and calcium oxalate stone, still remains a challenge.
References
- 1.Stamatelou KK, Francis ME, Jones CA, Nyberg LM, Curhan GC. Time trends in reported prevalence of kidney stones in the United States: 1976–1994. Kidney Int. 2003;63:1817–1823. doi: 10.1046/j.1523-1755.2003.00917.x. [DOI] [PubMed] [Google Scholar]
- 2.Moe OW. Kidney stones: pathophysiology and medical management. Lancet. 2006;367:333–344. doi: 10.1016/S0140-6736(06)68071-9. [DOI] [PubMed] [Google Scholar]
- 3.Saigal CS, Joyce G, Timilsina AR. Direct and indirect costs of nephrolithiasis in an employed population: opportunity for disease management? Kidney Int. 2005;68:1808–1814. doi: 10.1111/j.1523-1755.2005.00599.x. [DOI] [PubMed] [Google Scholar]
- 4.Smith RC, Rosenfield AT, Choe KA, et al. Acute flank pain: comparison of non-contrast-enhanced CT and intravenous urography. Radiology. 1995;194:789–794. doi: 10.1148/radiology.194.3.7862980. [DOI] [PubMed] [Google Scholar]
- 5.Dalrymple NC, Verga M, Anderson KR, et al. The value of unenhanced helical computerized tomography in the management of acute flank pain. J Urol. 1998;159:735–740. [PubMed] [Google Scholar]
- 6.Mitcheson HD, Zamenhof RG, Bankoff MS, Prien EL. Determination of the chemical composition of urinary calculi by computerized tomography. J Urol. 1983;130:814–819. doi: 10.1016/s0022-5347(17)51472-x. [DOI] [PubMed] [Google Scholar]
- 7.Hillman BJ, Drach GW, Tracey P, Gaines JA. Computed tomographic analysis of renal calculi. AJR Am J Roentgenol. 1984;142:549–552. doi: 10.2214/ajr.142.3.549. [DOI] [PubMed] [Google Scholar]
- 8.Mostafavi MR, Ernst RD, Saltzman B. Accurate determination of chemical composition of urinary calculi by spiral computerized tomography. J Urol. 1998;159:673–675. [PubMed] [Google Scholar]
- 9.Nakada SY, Hoff DG, Attai S, Heisey D, Blankenbaker D, Pozniak M. Determination of stone composition by noncontrast spiral computed tomography in the clinical setting. Urology. 2000;55:816–819. doi: 10.1016/s0090-4295(00)00518-5. [DOI] [PubMed] [Google Scholar]
- 10.Levi C, Gray JE, McCullough EC, Hattery RR. The unreliability of CT numbers as absolute values. AJR Am J Roentgenol. 1982;139:443–447. doi: 10.2214/ajr.139.3.443. [DOI] [PubMed] [Google Scholar]
- 11.Alvarez RE, Macovski A. Energy-selective reconstructions in X-ray computerized tomography. Phys Med Biol. 1976;21:733–744. doi: 10.1088/0031-9155/21/5/002. [DOI] [PubMed] [Google Scholar]
- 12.Kalender WA, Perman WH, Vetter JR, Klotz E. Evaluation of a prototype dual-energy computed tomographic apparatus. I. Phantom studies. Med Phys. 1986;13:334–339. doi: 10.1118/1.595958. [DOI] [PubMed] [Google Scholar]
- 13.Flohr TG, McCollough CH, Bruder H, et al. First performance evaluation of a dual-source CT (DSCT) system. Eur Radiol. 2006;16:256–268. doi: 10.1007/s00330-005-2919-2. [DOI] [PubMed] [Google Scholar]
- 14.Johnson TR, Krauss B, Sedlmair M, et al. Material differentiation by dual energy CT: initial experience. Eur Radiol. 2007;17:1510–1517. doi: 10.1007/s00330-006-0517-6. [DOI] [PubMed] [Google Scholar]
- 15.Primak AN, Fletcher JG, Vrtiska TJ, et al. Noninvasive differentiation of uric acid versus non-uric acid kidney stones using dual-energy CT. Acad Radiol. 2007;14:1441–1447. doi: 10.1016/j.acra.2007.09.016. [DOI] [PMC free article] [PubMed] [Google Scholar]
- 16.Graser A, Johnson TR, Bader M, et al. Dual energy CT characterization of urinary calculi: initial in vitro and clinical experience. Invest Radiol. 2008;43:112–119. doi: 10.1097/RLI.0b013e318157a144. [DOI] [PubMed] [Google Scholar]
- 17.Stolzmann P, Scheffel H, Rentsch K, et al. Dual-energy computed tomography for the differentiation of uric acid stones: ex vivo performance evaluation. Urol Res. 2008;36:133–138. doi: 10.1007/s00240-008-0140-x. [DOI] [PubMed] [Google Scholar]
- 18.Stolzmann P, Kozomara M, Chuck N, et al. In vivo identification of uric acid stones with dual-energy CT: diagnostic performance evaluation in patients. Abdom Imaging. 2009 Sep 2; doi: 10.1007/s00261-009-9569-9. [Epub ahead of print] [DOI] [PubMed] [Google Scholar]
- 19.Matlaga BR, Kawamoto S, Fishman E. Dual source computed tomography: a novel technique to determine stone composition. Urology. 2008;72:1164–1168. doi: 10.1016/j.urology.2008.03.051. [DOI] [PubMed] [Google Scholar]
- 20.Boll DT, Patil NA, Paulson EK, et al. Renal stone assessment with dual-energy multidetector CT and advanced postprocessing techniques: improved characterization of renal stone composition--pilot study. Radiology. 2009;250:813–820. doi: 10.1148/radiol.2503080545. [DOI] [PubMed] [Google Scholar]
- 21.Lingéman JE, McAteer JA, Gnessin E, Evan AP. Shock wave lithotripsy: Advances in technology and technique. Nature Reviews Urology. 2009;6:660–670. doi: 10.1038/nrurol.2009.216. [DOI] [PMC free article] [PubMed] [Google Scholar]
- 22.Primak AN, Ramirez Giraldo JC, Liu X, Yu L, McCollough CH. Improved dual-energy material discrimination for dual-source CT by means of additional spectral filtration. Med Phys. 2009;36:1359–1369. doi: 10.1118/1.3083567. [DOI] [PMC free article] [PubMed] [Google Scholar]
- 23.Primak A, Ramirez-Giraldo JC, Eusemann C, et al. Dual-source dual-energy CT with additional tin filtration: Dose and image quality evaluation in phantoms and in-vivo. AJR Am J Roentgenol. 2010;195:1–11. doi: 10.2214/AJR.09.3956. [DOI] [PMC free article] [PubMed] [Google Scholar]
- 24.Zarse CA, McAteer JA, Sommer AJ, et al. Nondestructive analysis of urinary calculi using micro computed tomography. BMC Urol. 2004;4:15. doi: 10.1186/1471-2490-4-15. [DOI] [PMC free article] [PubMed] [Google Scholar]
- 25.Healy KA, Ogan K. Pathophysiology and management of infectious staghorn calculi. Urol Clin North Am. 2007;34:363–374. doi: 10.1016/j.ucl.2007.05.006. [DOI] [PubMed] [Google Scholar]
- 26.Murty RC. Effective Atomic Numbers of Heterogeneous Materials. Nature. 1965;207:398–399. [Google Scholar]
- 27.American Association of Physicists in Medicine. AAPM Task Group 23 of the Diagnostic Imaging Council CT Committee. College Park, MD: 2008. The measurement, reporting and management of radiation dose in CT (Report #96) [Google Scholar]
- 28.International Electrotechnical Commission. Medical Electrical Equipment. Part 2-44: Particular requirements for the safety of x-ray equipment for computed tomography. IEC publication No. 60601-2-44. Ed. 2.1. Geneva, Switzerland: International Electrotechnical Commission (IEC) Central Office; 2002. [Google Scholar]
- 29.Grosjean R, Sauer B, Guerra RM, et al. Characterization of human renal stones with MDCT: advantage of dual energy and limitations due to respiratory motion. AJR Am J Roentgenol. 2008;190:720–728. doi: 10.2214/AJR.07.2466. [DOI] [PubMed] [Google Scholar]
- 30.Thomas C, Krauss B, Ketelsen D, et al. Differentiation of urinary calculi with dual energy CT: effect of spectral shaping by high energy tin filtration. Invest Radiol. 2010;45:393–398. doi: 10.1097/RLI.0b013e3181df9d28. [DOI] [PubMed] [Google Scholar]
- 31.Kelcz F, Joseph PM, Hilal SK. Noise considerations in dual energy CT scanning. Med Phys. 1979;6:418–425. doi: 10.1118/1.594520. [DOI] [PubMed] [Google Scholar]
- 32.Miller OF, Kane CJ. Time to stone passage for observed ureteral calculi: a guide for patient education. J Urol. 1999;162:688–690. doi: 10.1097/00005392-199909010-00014. discussion 690-681. [DOI] [PubMed] [Google Scholar]
- 33.Hollingsworth JM, Rogers MA, Kaufman SR, et al. Medical therapy to facilitate urinary stone passage: a meta-analysis. Lancet. 2006;368:1171–1179. doi: 10.1016/S0140-6736(06)69474-9. [DOI] [PubMed] [Google Scholar]
- 34.Klee LW, Brito CG, Lingeman JE. The clinical implications of brushite calculi. J Urol. 1991;145:715–718. doi: 10.1016/s0022-5347(17)38432-x. [DOI] [PubMed] [Google Scholar]
- 35.Daudon M, Bader CA, Jungers P. Urinary calculi: review of classification methods and correlations with etiology. Scanning Microsc. 1993;7:1081–1104. discussion 1104-1086. [PubMed] [Google Scholar]


