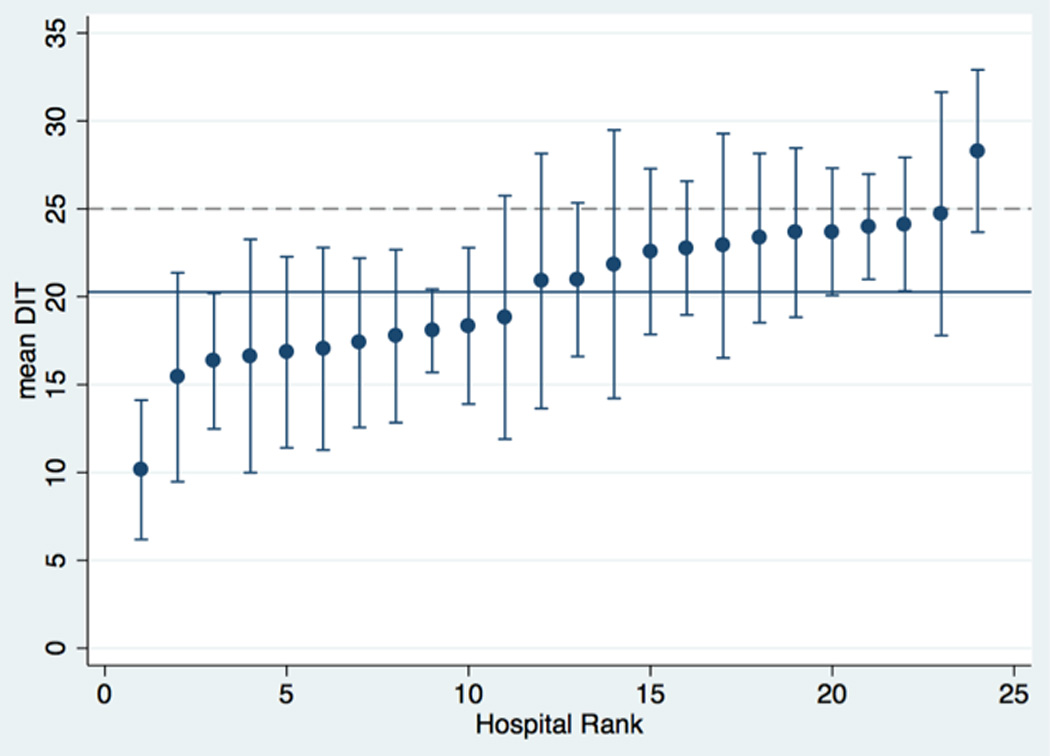
Figure 1.

Ranking of Hospitals’ Adjusted Door-to-Imaging time (DIT)
*Hospitals ranked by mean predicted DIT, adjusted for age, race, sex, diabetes, valvular disease, onset location, onset-to-arrival time, stroke severity (NIHSS), ambulance arrival, weekend presentation, elevated blood pressure on arrival, presentation to intervention versus control hospital, and pre-versus post-intervention.
Bars: 95%CI around predicted values
Blue line: overall mean (20.3 minutes)
Dashed line: 25-minute benchmark
