Abstract
A high throughput electrochemiluminescent (ECL) chip was fabricated and integrated into a fluidic system for screening toxicity-related chemistry of drug and pollutant metabolites. The chip base is conductive pyrolytic graphite onto which are printed 64 microwells capable of holding one-µL droplets. Films combining DNA, metabolic enzymes and an ECL-generating ruthenium metallopolymer (RuIIPVP) are fabricated in these microwells. The system runs metabolic enzyme reactions, and subsequently detects DNA damage caused by reactive metabolites. The performance of the chip was tested by measuring DNA damage caused by metabolites of the well-known procarcinogen benzo[a]pyrene (B[a]P). Liver microsomes and cytochrome P450 (cyt P450) enzymes were used with and without epoxide hydrolase (EH), a conjugative enzyme required for multi-enzyme bioactivation of B[a]P. DNA adduct formation was confirmed by determining specific DNA-metabolite adducts using similar films of DNA/enzyme on magnetic bead biocolloid reactors, hydrolyzing the DNA, and analyzing by capillary liquid chromatography-mass spectrometry (CapLC-MS/MS). The fluidic chip was also used to measure IC50-values of inhibitors of cyt P450s. All results show good correlation with reported enzyme activity and inhibition assays.
Introduction
Predicting toxicity risk for new molecules at early stages of commercial development presents a major challenge to chemical and drug industries.1,2 Despite a sophisticated array of assessment tools, toxicity becomes apparent in some drugs only after reaching human clinical trials, and in a few even after marketing. Thus, there is need for new, reliable, high-throughput platforms providing molecular information that augments predictions from traditional and emerging toxicity bioassays.3–6
Adducts of DNA nucleobases formed by reactions with chemicals or their metabolites are important biomarkers of genotoxicity, which denotes compounds that damage genetic material. Genotoxicity testing can be valuable for predicting drug toxicity.7–11 We have developed novel molecular toxicity screening devices based on 20–50 nm thick films assembled layer-by-layer (LbL) that combine metabolic enzymes with DNA. In the reaction step, metabolites produced by these enzymes are formed in films with high concentrations of DNA, favouring reaction with DNA bases if possible.5,10,12 In the detection step, relative amounts and rates of DNA damage are measured by voltammetry,13–15 or electrochemiluminescence (ECL)11,16,17 by including metallopolymer [Ru(bpy)2(PVP)10]2+ {(PVP = poly(4-vinylpyridine)} (RuIIPVP) in the films as a electrochemical ECL-producing catalyst.
ECL involves electrochemically-driven high-energy electron transfer reactions generating electronically excited states that emit light upon relaxation.18 Excitation of ECL luminophores can be facilitated by co-reactants such as tripropylamine or guanines in DNA.10 ECL is a powerful analytical tool with widespread applications, owing to attractive features including absence of a light source, high sensitivity, and compatibility with a variety assay protocols.18,19
DNA damage often entails formation of covalent adducts of metabolites with nucleobases, and disrupts the double helix to make reactive guanine bases more accessible to catalytic RuIIIPVP sites. This increases the catalytic reaction rate of the detection reaction involving electrochemically generated RuIIIPVP with guanines in the DNA, producing larger ECL signals for damaged than for intact DNA. Rates of signal increase vs. enzyme reaction time correlate with rodent genotoxicity metrics,11 and with formation rates of individual DNA adducts measured by capillary liquid chromatographymass spectrometry (CapLC-MS/MS).10 We also developed enzyme/DNA films on magnetic beads as biocolloid reactors to generate reactive metabolites followed by hydrolyzing the damaged DNA, and determining the nucleobase-metabolite adducts by LC-MS/MS. The latter analysis elucidates the genotoxic chemistry in more detail.20–23 These devices assess the possibility of genotoxic reactions of metabolites with DNA, and are complimentary to cell-based toxicity screening devices and bioassays.5,6,10
Our first ECL toxicity array employed a pyrolytic graphite (PG) block to contain the DNA/enzyme/RuIIPVP spots. In situ metabolite generation was accomplished by manual deposition and incubation of reactants and ECL development solutions on arrays.11,16,17 However, this approach is experimentally tedious for a large number of spots, reagent crossover between spots is an issue, and reactant concentrations are prone to change during reactions. However, microfluidic systems can provide a constant feed of reactants at fixed concentration and flow rate, enabling measurements at high-throughput.24–27 We previously integrated microfluidics with electrochemical detection of reactive metabolites using 8-sensor arrays and electronics.15,28 ECL detection, however, does not require an electronic array, just a conducting chip and spatially separate reactive spots. In this paper, we describe a new high throughput ECL-based fluidic platform for chemical toxicity screening, with 64 spots on the chip with printed microwells.
Materials and methods
Chemicals
[Ru(bpy)2(PVP)10]2+ (RuIIPVP (bpy = 2,2-bipyridyl; PVP = poly(4-vinylpyridine)) was synthesized and characterized as described previously.29 Ultrapure pyrolytic graphite (PG, 2.5 × 2.5 × 0.3 cm.) was obtained via http://www.graphitestore.com. Sources and descriptions of chemicals are in ESI† file.
Reaction flow system
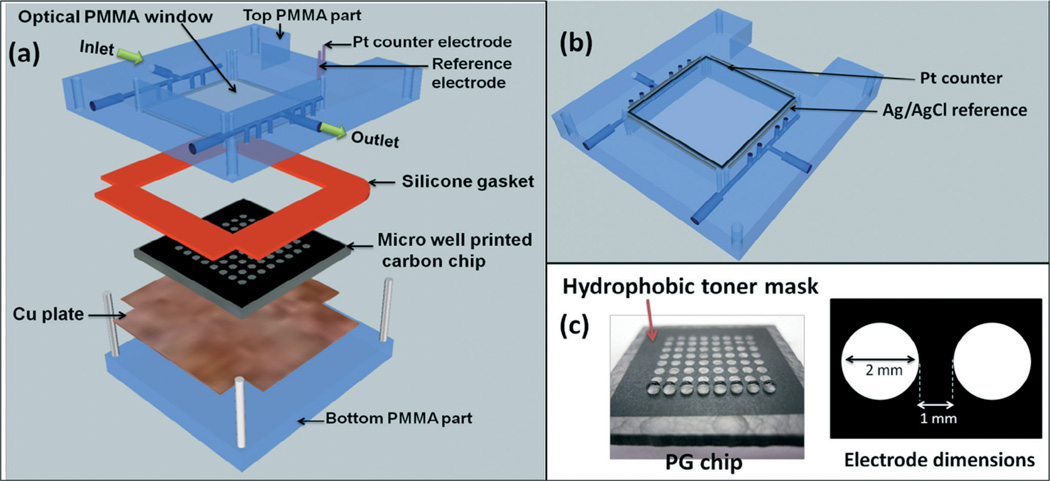
The system features the assembled ECL chip (Scheme 1) inside a dark box (G:BOX, Syngene Inc.) using light acquisition with a charge coupled device (CCD) camera.30 The ECL chip inlet port is connected to a dual syringe pump (55–3333, Harvard Inc.) via a 4-way switching valve (v101D, IDEX Inc) to direct buffers and reaction solutions into the device (Fig. S1, ESI†). Chip housing (Scheme 2) consists of a top poly(methylmethacrylate) (PMMA) plate featuring an optical glass window, Pt counter and Ag/AgCl reference electrode wires in the bottom side, a silicone rubber gasket, the microwell printed PG chip, a Cu plate underneath the chip for electrical connection, and a bottom PMMA plate. The top PMMA plate was machined with 4 mm diameter female ports to connect to 0.2 mm i.d. polyether ether ketone (PEEK) tubing forming an inlet and an outlet. Pt counter and Ag/AgCl reference electrodes were partially embedded in grooves on the underside of the top PMMA plate, so that they both surrounded all the microwells symmetrically, which is necessary for good reproducibility of spot ECL (Scheme 2(b)). The hydrophobic mask to make microwells was designed with the software Inkscape on a 1 : 1 scale (Scheme 2(c)). It was then printed onto high gloss paper (the backing of Avery labels) using an HP laser jet printer at 1200 dots per inch (dpi). The mask was then cut and transferred onto the bare PG by heating in a press at 290 °F for 90 s. Each well holds maximum of 1.5 ± 0.1 µL volume of solution, and facilitates to construct the films containing enzymes, DNA and RuII-PVP. Cytochrome P450 (cyt P450) enzymes in supersomes or microsomes were used with or without epoxide hydrolase (EH). A flexible silicone gasket was placed on top of the microwell printed PG chip, and the entire assembly was sandwiched between the hard PMMA plates bolted together with screws (Scheme 2(a)) to form a sealed channel. The total volume of the channel is 688 ± 7 µL, estimated by measuring the volume of liquid required to completely fill the channel.
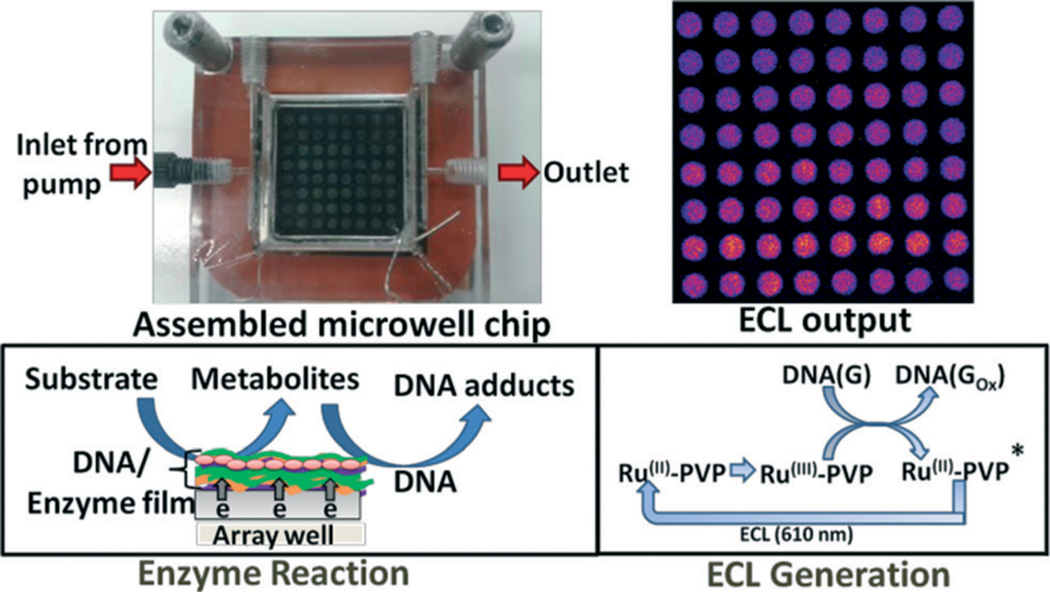
Scheme 1.
Fluidic ECL chip for high throughput screening of metabolite-generated DNA damage. The device consists of a flow cell, and a 2.5 × 2.5 × 0.3 cm pyrolytic graphite chip on which 64 analytical spots containing DNA, metabolic enzymes and light emitting polymer (RuIIPVP) have been fabricated. Lower right box shows a simplified version of the detection chemistry, where DNA(G) = guanines in DNA.
Scheme 2.
ECL chip and the fluidic reaction chamber, (a) component assembly into the flow cell, (b) underside view of reference and counter electrode wires in the top poly(methylmethacrylate) (PMMA) plate, (c) pyrolytic graphite (PG) chip with printed microwells. The first row is shown containing 1 µL water droplets.
Spot deposition
Enzyme/RuIIPVP/DNA films were formed a layer at a time in the microwells using 1 µL droplets of the following stock solutions. Solution compositions were optimized previously11,17,31 for steady state adsorption, and 1.0 µL of each adsorbate solution was sequentially incubated in the microwells for 20 min at 4 °C washing with water between layer depositions, except for enzymes and DNA where 30 min incubations were used. Solutions are (a) polydiallyldimethylammonium chloride (PDDA), 2 mg mL−1 in 0.05 M NaCl; 3 mg mL−1 in 0.5 M NaCl; (b) RuIIPVP, 2.5 mg mL−1 50% V/V ethanol; (c) calf thymus DNA, 2 mg mL−1 in 10 mM TRIS + 0.5 M NaCl, pH 7.4; (d) human liver microsomes (HLM), 20 mg mL−1 in 250 mM sucrose; (e) human microsomal epoxide hydrolase (EH), 10 mg mL−1 in 100 mM potassium phosphate buffer of pH 7.4; (f) pooled human liver S9 (HS9), 20.0 mg mL−1 in 150 mM KCl, 50 mM Tris-HCl + 2.0 mM EDTA; (g) baculovirus-insect cell expressed cyt P450 1B1 supersomes (cyt P450 1B1), 4.5 mg mL−1 in 100 mM potassium phosphate buffer of pH 7.4; (h) baculovirus-insect cell expressed cyt P450 1A1 supersomes (cyt P450 1A1), 4.5 mg mL−1 in 100 mM potassium phosphate buffer of pH 7.4; (i) baculovirus-insect cell expressed cyt P450 1A2 supersomes, (cyt P450 1A2), 4.5 mg mL−1 in 100 mM potassium phosphate buffer of pH 7.4; (j) rat liver microsomes (RLM), 20 mg mL−1 in 250 mM sucrose; (k) myoglobin (Mb), 3 mg mL−1 in 10 mM acetate buffer of pH 5.0; (l) control supersomes (Cyt P450 free), 5 mg mL−1 in 100 mM potassium phosphate buffer of pH 7.4. All films have the general film architecture, (RuIIPVP/DNA)2/RuIIPVP/cyt P450 enzyme source/EH or PDDA/DNA, where the first four analytical spots were deposited without EH, while the last four were with EH. (Note: in the remainder of the paper, films composition is abbreviated by the type of cyt P450 source used. Example: (RuIIPVP/DNA)2/RuIIPVP/cytP4501B1/PDDA/DNA–cyt P450 1B1, (RuIIPVP/DNA)2/RuIIPVP/cytP4501B1/EH/DNA–cyt P450 1B1 + EH. A quartz crystal microbalance (QCM, USI Japan) was used to measure mass densities and nominal thickness of the spots.10,31 Full details are in the ESI† file.
Enzyme reaction and ECL signal acquisition
Safety note: benzo[a]pyrene (B[a]P) and B[a]P metabolites are known carcinogens. All manipulations were done under a closed hood while wearing gloves.
For genotoxicity screening, enzyme reactions were run first by flowing reactant solutions through the chip (Scheme 1) at 500 µL min−1 using constant potential of −0.65 V vs. Ag/AgCl (0.14 M KCl) at 22 (±2) °C to activate natural cyt P450 catalysis as reported previously.15,32–34 Following the enzyme reactions, washing with anaerobic 50 mM phosphate buffer + 0.1 M NaCl of pH 7.4 was done for 3 min at 500 µL min−1. Then, 1.25 V vs. Ag/AgCl was applied to the array for 180 s with a CHI 1232 electrochemical analyzer (CH Instruments Inc.) to generate ECL acquisition which is detected by the CCD camera. Each chip is single use, and was replaced with a new chip for each run. Signal integration and data analysis were done using Syngene Gene Tools v3.06 (SynGene), with color enhancement using Photoshop CS.
Cyt P450 inhibition assay
Inhibitors of cyt P450 1A1 and cyt P450 1A2 were employed to determine the concentration of inhibitor producing 50% of inhibition (IC50,) under our assay conditions. Furafylline was used as inhibitor of cyt P450 1A2 and rhapontigenin as inhibitor of cyt P450 1A1.35 The assay involved the repetition of the above DNA damage detection protocol with oxygenated 25 µM B[a]P after 15 min incubations for range of inhibitor concentrations.
DNA-metabolite structure elucidation by CapLC-MS/MS
DNA-metabolite adducts were characterized by employing CapLC-MS/MS analysis of products obtained with the aid of magnetic biocolloid reactor beads as reported previously.23 Briefly, films of cyt P450 1B1, DNA, PDDA were fabricated on 1 µm carboxylate functionalized magnetic beads with final film architecture of PDDA/cyt P450 1B1/PDDA/DNA. This magnetic bead dispersion in 10 mM Tris buffer (200 µL, pH 7.0) was incubated with 25 µM B[a]P for 4 hours in the presence of the NADPH regeneration system at 37 °C to enable metabolite generation and DNA adduct formation. After the reaction, DNA was enzymatically hydrolyzed off the beads by incubating with appropriate enzymes (see ESI†) for 12 hours. DNA-B[a]P adducts were separated by using a Capillary LC (Waters Capillary LC-XE) equipped with column switching, which allows the selective capture of DNA fragments in a trap column. The trap column was Luna® dC18 110A C18, 20.0 mm, 0.5 mm i.d., 5µm particle size (Phenomenex, Torrance, CA) and analytical column Atlantis® dC18, 150 mm, 0.3 mm i.d., 5µm particle size (Waters). A 4000 QTRAP (AB Sciex) mass spectrometer with Analyst 1.4 software was operated in positive ion mode. Multiple reactions monitoring (MRM) was done at 5.5 kV, capillary temperature 200 °C and declustering potential 60 V.
Results
Cyt P450s are the major enzymes responsible for oxidative metabolism of lipophilic chemicals in humans.36 Cyt P450 1 enzymes are known to metabolize polyaromatic hydrocarbons such as B[a]P (eqn (1)).37–39 Epoxy hydrolase (EH) occurs in membrane bound or soluble forms,40 and is responsible for subsequent hydrolysis of initial metabolites formed by cyt P450s (eqn (2)).37,39 We employed supersomal fractions of cyt P450 1A1, 1A2 and 1B1, liver microsomes (human and rat) and human S9 fractions as sources of cyt P450s. Liver microsomes and human S9 fraction contain membrane bound EH, while supersomal fractions do not.40 The influence of EH on DNA damage rate was studied by the inclusion of an additional source of microsomal EH in films.
Studies with B[a]P
We chose B[a]P as a model compound because its DNA-reactive metabolites are well understood. Bioactivation of B[a]P involves initial epoxidation by cyt P450s yielding B[a]P-7,8-epoxide (eqn (1)), followed by hydrolysis of B[a]P-7,8-epoxide by epoxide hydrolase to form B[a]P-7,8-dihydrodiol (eqn (2)).41 Subsequent cyt P450 oxidation of the dihydrodiol generates reactive B[a]P-7,8-dihydrodiol-9,10-epoxide (BPDE) (eqn (3)), which reacts with DNA bases.41
 |
(1) |
 |
(2) |
 |
(3) |
Film fabrication and characterization
Film growth was monitored using QCM, with films constructed on 9 MHz mercaptopropane thiol derivatized gold-coated quartz crystals.11 Frequency shift was measured after deposition and drying of each layer. Stable, reproducible film growth was confirmed by QCM. Nominal film thicknesses were 47–59 nm (Table S1, Fig. S2, ESI†). Total cyt P450s present in films is varied for different sources (Table 1).
Table 1.
Amount of cyt P450s in films
| Cyt P450 source | Total cyt P450s, fmol |
|---|---|
| Cyt P450 1B1 | 4.8 ± 0.3 |
| Cyt P450 1A2 | 5.0 ± 0.3 |
| Cyt P450 1A1 | 3.9 ± 0.2 |
| HLM | 41 ± 5 |
| Hs9 | 11 ± 3 |
| RLM | 76 ± 4 |
Reproducibility
To assess chip-to-chip reproducibility, ECL from films containing (RuIIPVP/DNA)3 in microwells in four different chips were acquired, and the variance in ECL intensity was analyzed by one way analysis of variance (one-way ANOVA). ECL intensities obtained from different array chips for the same film assembly did not differ at the 95% confidence interval (p > 0.05, see Fig. S3, ESI†). Relative standard deviation of ECL intensity of spots in a given chip (spot-to-spot reproducibility) was about ±6%.
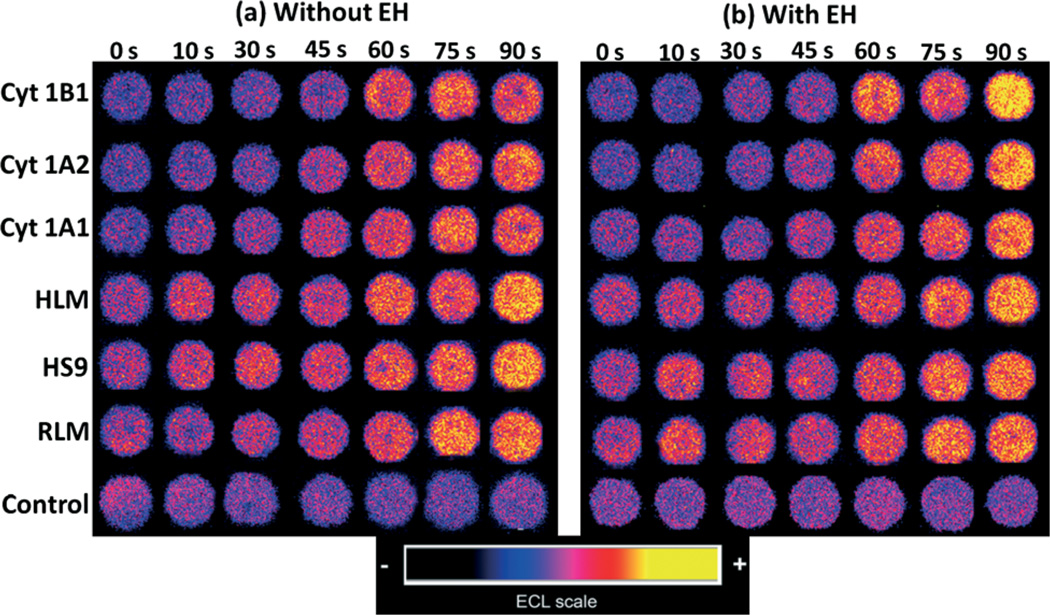
ECL captured from spots with different cyt P450 sources in the fluidic system showed increases in intensity with enzyme reaction time (Fig. 1). Slopes of ECL intensity vs. enzyme reaction time are directly related to the extent of DNA damage, mostly due to formation of covalent adducts of metabolites with nucleobases that disorder the DNA double helix.5,10
Fig. 1.
Reconstructed ECL array data obtained from analytical spots containing optimized RuIIPVP/enzyme/DNA film assemblies reacted with oxygenated 25 µM of B[a]P + 1% DMSO in pH = 7.4 phosphate buffer with bioelectronic activation of cyt P450s at −0.65 V vs. Ag/AgCl (0.14 M KCl) for reaction times from 0–90 s. Control spots contained cyt P450 1B1 with or without EH, and were subjected to the same reaction conditions as above without bioelectronic activation of cyt P450s.
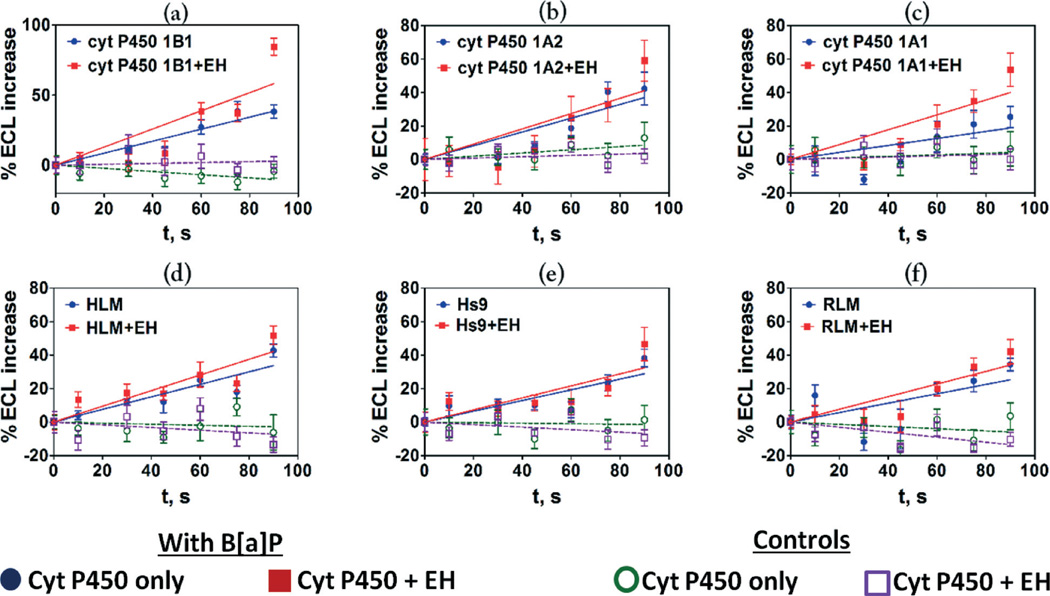
The variation in ECL (%ECL) with reaction time is depicted in Fig. 2 where the initial slopes of %ECL increase vs. reaction time are proportional to relative rates of DNA damage.10,16,17 Higher rates of DNA damage were found when epoxide hydrolase (EH) was added to cyt P450 enzymes (Fig. 1 and 2) suggesting the formation of BPDE (eqn (3)) leading to DNA nucleobase adducts. The rates of DNA damage in control supersomes (cyt P450 free) were also evaluated, but were negligible due to the absence of cyt P450 enzymes for B[a]P bioactivation (see Fig. S4, ESI†). We used 25 µM tetrahydrofuran (THF) + 1% DMSO in pH = 7.4 phosphate buffer as a negative control, which did not show any DNA damage under our assay conditions (see Fig. S5, ESI†).
Fig. 2.
Influence of enzyme reaction time on ECL increase for fluidic sensor chips reacted with 25 µM B[a]P at pH 7.4 using electronic activation of cyt P450s, (a) cyt P450 1B1, (b) cyt P450 1A2, (c) cyt P450 1A1, (d) HLM, (e) Hs9, (f) RLM. Controls are without substrate or with substrate but without electronic activation of cyt P450s, which gave equivalent results. Error bars represent standard deviations for n = 4. The results with control supersomes are shown in the ESI file (Fig. S4, ESI).†
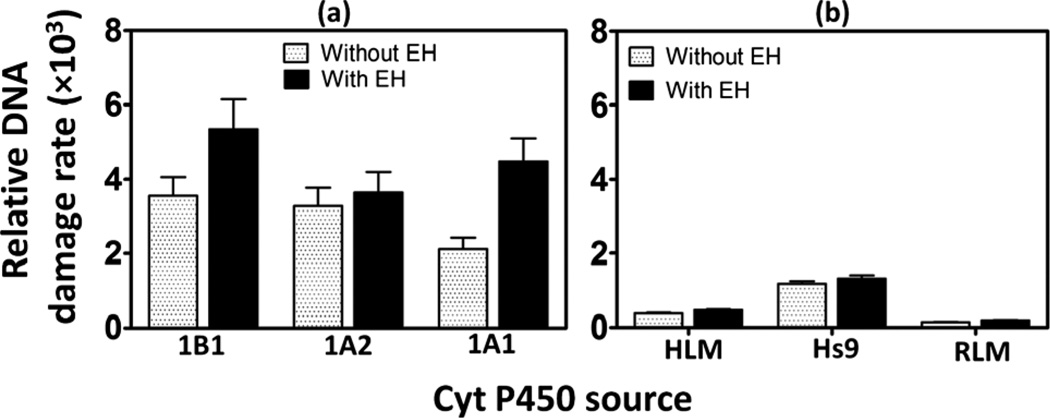
Relative DNA damage rates involving formation of DNA-reactive metabolites were estimated as turnover rates by normalizing %ECL for the total amount of cyt P450 enzymes in each film (in picomoles) per µM of B[a]P. Addition of epoxide hydrolase as an enzyme source increased DNA damage rates as shown in Fig. 3, consistent with results obtained utilizing a voltammetric array featuring cyt P450 1B1.28 Significantly higher relative DNA damage rates are apparent in supersomal fractions compared to microsomal fractions due to the higher concentration of those cyt P450 isoforms in supersomal fractions that are specifically responsible for the metabolism of B[a]P.28,37 Addition of EH did not greatly affect the turnover rates of microsomal fractions because they contain intrinsic microsomal EH.28,40 DNA damage rate by B[a]P in HS9 fractions was ~8 fold larger than that of RLM and ~3 times larger than HLM (Fig. 3(b)). This is due to the presence of both microsomal and cytosolic enzymes in HS9 fractions, which facilitates more complete metabolism of B[a]P.42 Cyt P450 1B1 supersomes in the presence of EH show the highest relative rate of DNA damage (Fig. 3(a)) followed by cyt P450s 1A1, and 1A2. The relative rate of DNA damage by cyt P450 1B1 is ~1.5 times higher than that of 1A2 and ~1.2 times higher than 1A1. These results are consistent with those from bacteriocell expressed cyt P450s.16,38
Fig. 3.
Influence of epoxide hydrolase on sensor array relative DNA damage rate ({picomole of cyt P450s}−1 s−1 mM−1) for 25 µM B[a]P at pH 7.4, (a) supersomal fractions (b) microsomal fractions.
DNA-metabolite structure elucidation by CapLC-MS/MS
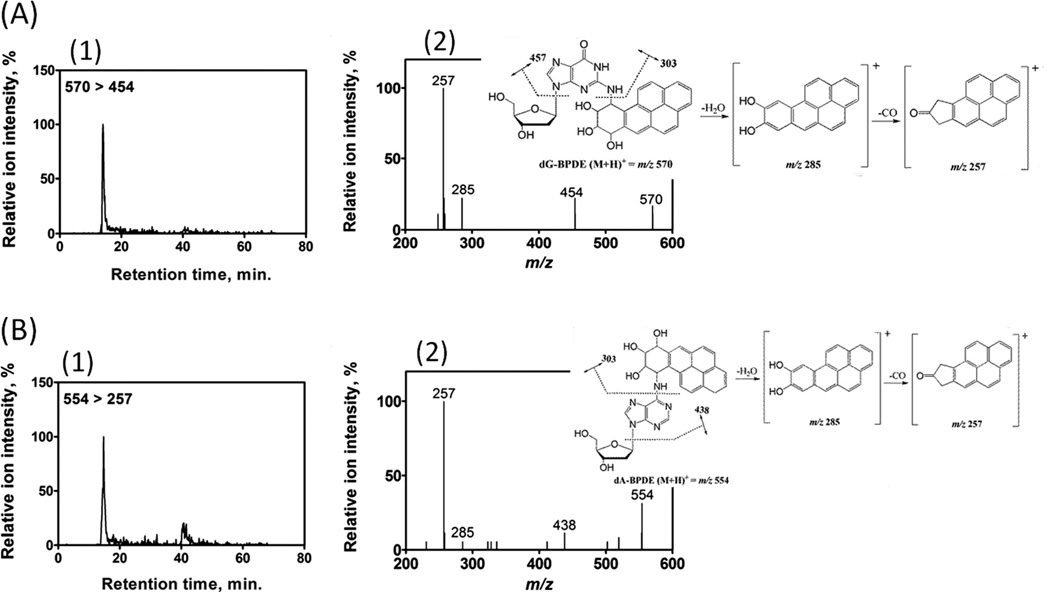
Array results were supported with molecular information on B[a]P bioactivation forming DNA adducts by using CapLC-MS/MS. Magnetic beads (1 µm) decorated with DNA/enzyme films were used as biocolloidal reactors to generate DNA-BPDE adducts from B[a]P. Subsequent analyses by CapLC-MS/MS revealed the formation of BPDE adducts with guanine and adenine nucleobases in DNA. Fig. 4(A) depicts the selective reaction monitoring (SRM) chromatogram (Fig. 4(A)1) and product ion spectrum (Fig. 4(A)2) for N2-deoxyguanosine–benzo(a)pyrene-7,8-dihydrodiol-9,10-epoxide adduct (dG-BPDE, [M + H]+ = m/z 570). CapLC-MS/MS data for N6-deoxyadenosine–benzo(a)pyrene-7,8-dihydrodiol-9,10-epoxide adduct (dA-BPDE, [M + H]+ = m/z 554) formation is shown in Fig. 4(B). The characteristic fragmentation patterns of mass transition from m/z 570 to 454 for dG-BPDE, and that of m/z 554 to 257 for dA-BPDE confirm the generation of BPDE-DNA adducts. These results are consistent with our previous reports43 and published literature.44
Fig. 4.
CapLC-MS/MS analysis of reaction products from cyt P450 1B1/DNA biocolloid reactors with B[a]P. (A) dG-BPDE adduct, (1) representative SRM chromatogram with mass transition m/z 570–454 indicating the formation of dG-BPDE adduct (2) product ion spectrum of m/z 570 with inserted fragmentation, collision energy 35 eV, (B) dA-BPDE adduct, (1) representative SRM chromatogram with mass transition m/z 554-257 indicating the formation of dA-BPDE adduct (2) product ion spectrum of m/z 554 with inserted fragmentation, collision energy 35 eV.
Cyt P450 inhibition assay
Cyt P450 inhibition34,45,46 can result in situations in which one drug (or another molecule) inhibits a cyt P450 isoform that metabolizes a second drug. Co-administration of two such drugs can result in high plasma concentrations of the more slowly metabolized drug that can cause toxic effects known as drug–drug interactions.46 Cyt P450 inhibition assays provide an important tool to predict such interactions by assessing contributions of individual P450 isoforms to the total metabolism.46
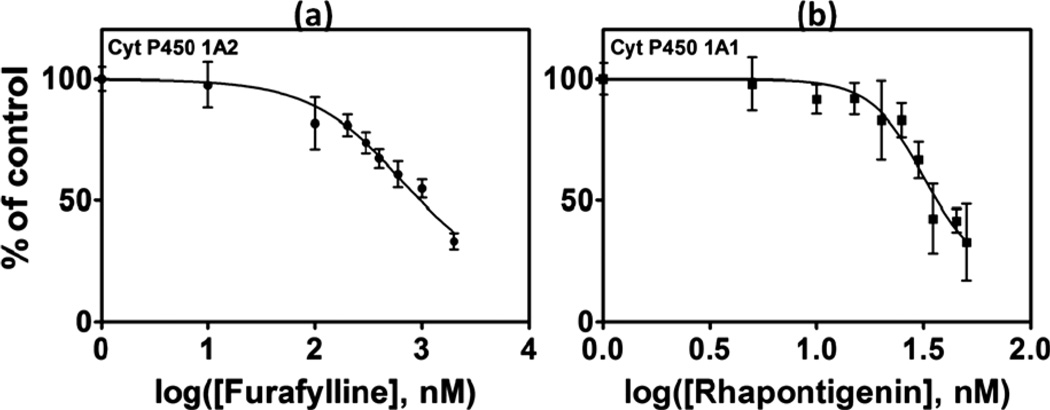
Inhibition of specific cyt P450 isoforms was measured with the microwell fluidic chip by running metabolic reactions at various inhibitor concentrations. Inhibition decreases the rate of formation of BPDE from B[a]P, and thus decreases the amount of DNA damage. The degree of inhibition is reflected by decreased ECL intensity relative to the uninhibited assay. In the presence of furafylline, an inhibitor for cyt P450 1A2,35a a significant decrease in ECL intensity was observed with increasing concentration (Fig. 5(a)). IC50, the concentration of inhibitor producing 50% inhibition,35 of furafylline under our assay conditions was 0.65 ± 0.01 µM, while for rhapontigenin, an inhibitor for cyt P450 1A1,35b it was 0.032 ± 0.001 µM.
Fig. 5.
The percent decrease in ECL intensity over the control (no inhibitor) after 15 min incubation with an inhibitor; (a) furafylline with cyt P450 1A2 supersomes, (b) rhapontigenin with cyt P450 1A1 supersomes. ECL array images are in the ESI file (Fig. S6, ESI).†
Discussion
Results above document successful development of a simple, high throughput ECL based fluidic chip to run metabolic enzyme reactions followed by rapid detection of DNA damage. The system represents a reliable genotoxicity screening device with the implicit assumption that DNA damage events are likely to cause genotoxic effects. Attractive features include high throughput, miniaturization, parallel analysis of a representative cohort of metabolic enzymes, and the possibility of further automation. These devices assess the possibility of genotoxic reactions of metabolites with DNA. Thus, they are complimentary to cell-based devices and existing and emerging toxicity bioassays.5,6,10
The fluidic reaction/detection platform is capable of up to 64 enzymatic reactions in a single run. The novel computer-printed well design facilitates DNA/enzyme film formation from tiny amounts of materials. This print and peel technology to create micro-well type sensor arrays is simple, versatile and broadly applicable to fabricate a desired number of sensor spots on virtually any solid substrate to which the pattern can be heat transferred.
We tested the device here for 16 different reactions catalyzed by a variety of cyt P450 supersomal and microsomal sources with 4 replicates each. Reactive metabolites were generated from the procarcinogen B[a]P. The fluidic ECL system provides a good platform for enzyme chemistries by supplying a constant flow and concentration of substrate throughout the reaction. This is in contrast to our earlier non-microfluidic ECL array chips in which reactants are spotted manually and reactant concentrations are influenced by the reaction itself, atmospheric oxygen, and evaporation.11,16,17 This is reflected in the present case in linear %ECL vs. reaction time plots, whereas with the manual ECL array these plots are often curved.11 Thus the fluidic system allows a more reliable estimate of the rate of DNA damage as the slope of the linear plots. In general, the new device showed good reproducibility among reaction spots with spot-to-spot relative standard deviation of ±6%. Although each chip is single use only, this chip-to-chip reproducibility suggests good control over film deposition (see Fig. S3, ESI†).
Enzymes that generate B[a]P metabolites in vitro include specific cyt P450 isoforms in isolated bacterial membranes (bicistronic enzymes),16,38 baculovirus-insect cell expressed human cyt P450 supersomes,28 hepatic cells and liver microsomes.39,47 We used human cyt P450 supersomes to assess the ability of specific isoforms for B[a]P bioactivation. With EH included, cyt P450 1B1 showed the highest rate of DNA damage followed by cyt P450s 1A1 and 1A2 (Fig. 3). This is consistent with genotoxicity assays reported by Shimada et al. using recombinant cyt P450 enzymes to activate B[a]P to genotoxic products that induce gene expression in specific bacteria.38 Also, our non-fluidic ECL array studies confirmed that DNA damage rate from B[a]P metabolites is larger for cyt P450 1B1 that of cyt P450s 1A1 and 1A2.16 Inclusion of EH increased the rate of DNA damage and it was prominent in supersomal fractions (see Fig. 3), consistent with the role of EH in complete bioactivation of B[a]P to produce DNA-reactive BPDE.37,38,41
CapLC-MS/MS provided molecular confirmation of B[a]P bioactivation, and detected product ion spectra of dG-BPDE and dA-BPDE to confirm formation of these adducts (Fig. 4). We employed collision energy of 35 eV, where molecular ion of dG-BPDE, m/z of 570 undergoes the fission of glycosidic bond resulting its major product ion m/z 454. The cleavage of the bond between exocyclic N of guanine and BPDE moiety results m/z 303 (Fig. 4(A)). However, at this relatively higher collision energy it loses a water molecule to yield ion m/z 285 and subsequent loss of CO to generate fairly stable product m/z 257 (Fig. 4(A)). This signature fragmentation pattern is a clear indication of dG-BDPE adducts.44 A similar product ion spectrum was reported with SRM of dA-BPDE, where its major product ion m/z 438 was observed.
We also demonstrated the use of the array to measure IC50 values for known selective inhibitors of cyt P450 1A1 and 1A2 (Fig. 4). Furafylline, is a selective non competitive inhibitor of cyt P450 1A2, which exerts its inhibitory effect by initially interacting with the substrate binding site, and then binding through a basic nitrogen with the heme iron of P450.35a Rhapontigenin, is an inactivator of P450 1A1 as well as a competitive inhibitor.35b IC50 values found with the fluidic array were 0.65 ± 0.01 µM for furafylline using cyt P450 1A2 and 0.032 ± 0.001 µM using cyt P450 1A1. These values are reasonably correlated with reported IC50's in the literature (Table 2). However, direct comparisons are complicated by different assay conditions and enzyme sources leading to a large spread in the results.48
Table 2.
Comparison of IC50 data of the inhibitors with literature reported values
| Inhibitor | Assay | Enzyme source | IC50, µM | Ref. |
|---|---|---|---|---|
| Furafylline | This work | Recombinant P450 | 0.65 ± 0.01 | — |
| Phenacetin O-deethylase activity | HLM | 1.76 ± 0.28 | 49 | |
| Phenacetin O-deethylase activity | Recombinant P450 | 1.64 ± 0.16 | 49 | |
| Metabolomics by LC-MS/MS | HLM | 2.0 | 50 | |
| Phenacetin O-deethylase activity | RLM | 0.48 | 51 | |
| Phenacetin O-deethylase activity | RLM | 0.07 | 35a | |
| Ethoxyresorufin O-deethylation assay | HLM | 6 | 52 | |
| Ethoxyresorufin O-deethylation assay | Recombinant P450 | 6 | 52 | |
| Rhapontigenin | This work | Recombinant P450 | 0.032 ± 0.001 | — |
| Ethoxyresorufin O-deethylation assay | Recombinant P450 | 0.4 | 35b |
Conclusions
In summary, this paper describes a simple chip for high throughput screening of potential genotoxic chemistry of metabolites. The fluidic platform provides constant reagent delivery during enzyme reactions to form metabolites, followed by ECL detection of relative DNA damage. Results for B[a]P bioactivation and IC50 determinations consistent with known chemistry of these systems was demonstrated. In conjunctions with existing and emerging bioassays, this novel high-throughput screening tool shows value for predicting metabolic fate and in toxicity assessment of new environmental chemicals and drugs.
Supplementary Material
Acknowledgements
This work was supported financially by US PHS grant No. ES03154 from the National Institute of Environmental Health Sciences (NIEHS), NIH, USA. The authors thank Daniel Daleb for his efforts in fabricating the device. We also acknowledge FAPESP Proc. No. 11/02259-6 for financial support to Dr. R. C. Faria for a sabbatical visit.
Footnotes
Electronic supplementary information (ESI) available. See DOI: 10.1039/c3lc50698c
Notes and references
- 1.Paul SM, Mytelka DS, Dunwiddie CT, Persinger CC, Munos BH, Lindborg SR, Schacht AL. Nat. Rev. Drug Discovery. 2010;9:203–215. doi: 10.1038/nrd3078. [DOI] [PubMed] [Google Scholar]
- 2.Stokstad E. Science. 2009;325:294–295. [Google Scholar]
- 3.Kramer JA, Sagartz JE, Morris DL. Nat. Rev. Drug Discovery. 2007;6:636–649. doi: 10.1038/nrd2378. [DOI] [PubMed] [Google Scholar]
- 4.Nassar AEF, Kamel AM, Clarimont C. Drug Discovery Today. 2004;9:1055–1064. doi: 10.1016/S1359-6446(04)03297-0. [DOI] [PubMed] [Google Scholar]
- 5.Rusling JF, Hvastkovs EG, Schenkman JB. Curr. Opin Drug Discovery Dev. 2007;10:67–73. [PubMed] [Google Scholar]
- 6.Lynch AM, Sasaki JC, Elespuru R, Jacobson-Kram D, Thybaud V, De Boeck M, Aardema MJ, Aubrecht J, Benz RD, Dertinger SD, Douglas GR, White PA, Escobar PA, Fornace A, Jr, Honma M, Naven RT, Rusling JF, Schiestl RH, Walmsley RM, Yamamura E, van Benthem J, Kim JH. Environ. Mol. Mutagen. 2011;52:205–223. doi: 10.1002/em.20614. [DOI] [PubMed] [Google Scholar]
- 7.Park BK, Boobis A, Clarke S, Goldring CEP, Jones D, Kenna JG, Lambert C, Laverty HG, Naisbitt DJ, Nelson S, Nicoll-Griffith DA, Obach RS, Routledge P, Smith DA, Tweedie DJ, Vermeulen N, Williams DP, Wilson ID, Baillie TA. Nat. Rev. Drug Discovery. 2011;10:292–307. doi: 10.1038/nrd3408. [DOI] [PubMed] [Google Scholar]
- 8.Guengerich FP. Chem. Res. Toxicol. 2001;14:611–650. doi: 10.1021/tx0002583. [DOI] [PubMed] [Google Scholar]
- 9.Tarun M, Rusling JF. Anal. Chem. 2005;77:2056–2062. doi: 10.1021/ac048283r. [DOI] [PubMed] [Google Scholar]
- 10.(a) Rusling JF, Hvastkovs EG, Schenkman JB. In: Drug Metabolism Handbook. Nassar A, Hollenburg PF, Scatina J, Wiley J, J N, editors. 2009. pp. 307–340. [Google Scholar]; (b) Hvastkovs EG, Schenkman JB, Rusling JF. Annu. Rev. Anal. Chem. 2012;5:79–105. doi: 10.1146/annurev.anchem.111808.073659. [DOI] [PMC free article] [PubMed] [Google Scholar]
- 11.Pan S, Zhao L, Schenkman JB, Rusling JF. Anal. Chem. 2011;83:2754–2760. doi: 10.1021/ac200050n. [DOI] [PMC free article] [PubMed] [Google Scholar]
- 12.Rusling JF. Biosens. Bioelectron. 2004;20:1022–1028. doi: 10.1016/j.bios.2004.06.033. [DOI] [PubMed] [Google Scholar]
- 13.Zhou L, Rusling JF. Anal. Chem. 2001;73:4780–4786. doi: 10.1021/ac0105639. [DOI] [PubMed] [Google Scholar]
- 14.Zhou L, Yang J, Estavillo C, Stuart JD, Schenkman JB, Rusling JF. J. Am. Chem. Soc. 2003;125:1431–1436. doi: 10.1021/ja0290274. [DOI] [PubMed] [Google Scholar]
- 15.Wasalathanthri DP, Mani V, Tang CK, Rusling JF. Anal. Chem. 2011;83:9499–9506. doi: 10.1021/ac202269t. [DOI] [PMC free article] [PubMed] [Google Scholar]
- 16.Hvastkovs EG, So M, Krishnan S, Bajrami B, Tarun M, Jansson I, Schenkman JB, Rusling JF. Anal. Chem. 2007;79:1897–1906. doi: 10.1021/ac061975q. [DOI] [PMC free article] [PubMed] [Google Scholar]
- 17.Krishnan S, Hvastkovs EG, Bajrami B, Choudhary D, Schenkman JB, Rusling JF. Anal. Chem. 2008;80:5279–5285. doi: 10.1021/ac800763r. [DOI] [PMC free article] [PubMed] [Google Scholar]
- 18.(a) Forster RJ, Bertoncello P, Keyes TE. Annu. Rev. Anal. Chem. 2009;2:359–385. doi: 10.1146/annurev-anchem-060908-155305. [DOI] [PubMed] [Google Scholar]; (b) Bertoncello P, Forster RJ. Biosens. Bioelectron. 2009;24:3191–3200. doi: 10.1016/j.bios.2009.02.013. [DOI] [PubMed] [Google Scholar]
- 19.Miao W. Chem. Rev. 2008;108:2506–2553. doi: 10.1021/cr068083a. [DOI] [PubMed] [Google Scholar]
- 20.(a) Bajrami B, Hvastkovs EG, Jensen G, Schenkman JB, Rusling JF. Anal. Chem. 2008;80:922–932. doi: 10.1021/ac702025f. [DOI] [PubMed] [Google Scholar]; (b) Bajrami B, Krishnan S, Rusling JF. Drug Metab. Lett. 2008;2:158–162. doi: 10.2174/187231208785425854. [DOI] [PMC free article] [PubMed] [Google Scholar]
- 21.Bajrami B, Zhao L, Schenkman JB, Rusling JF. Anal. Chem. 2009;81:9921–9929. doi: 10.1021/ac9015853. [DOI] [PMC free article] [PubMed] [Google Scholar]
- 22.Zhao L, Schenkman JB, Rusling JF. Anal. Chem. 2010;82:10172–10178. doi: 10.1021/ac102317a. [DOI] [PMC free article] [PubMed] [Google Scholar]
- 23.Zhao L, Schenkman JB, Rusling JF. Anal. Chem. 2010;82:10172–10178. doi: 10.1021/ac102317a. [DOI] [PMC free article] [PubMed] [Google Scholar]
- 24.Niu X, Gielen F, Edel JB, deMello AJ. Nature. 2011;3:437–442. doi: 10.1038/nchem.1046. [DOI] [PubMed] [Google Scholar]
- 25.de Mello AJ. Nature. 2006;442:394–402. [Google Scholar]
- 26.Xia YN, Whitesides GM. Annu. Rev. Mater. Sci. 1998;28:153–184. [Google Scholar]
- 27.Unger MA, Chou HP, Thorsen T, Scherer A, Quake SR. Science. 2000;288:113–116. doi: 10.1126/science.288.5463.113. [DOI] [PubMed] [Google Scholar]
- 28.Wasalathanthri DP, Faria RC, Mall S, Joshi AA, Schenkman JB, Rusling JF. Analyst. 2013;138:171–178. doi: 10.1039/c2an35993f. [DOI] [PMC free article] [PubMed] [Google Scholar]
- 29.Dennany L, Forster RJ, Rusling JF. J. Am. Chem. Soc. 2003;125:5213–5218. doi: 10.1021/ja0296529. [DOI] [PubMed] [Google Scholar]
- 30.Sardesai NP, Kadimisetty K, Faria R, Rusling JF. Anal. Bioanal. Chem. 2013;405:3831–3838. doi: 10.1007/s00216-012-6656-5. [DOI] [PMC free article] [PubMed] [Google Scholar]
- 31.Lvov Y. In: Handbook of Surfaces and Interfaces of Materials. Nalwa RW, editor. vol. 3. San Diego, CA: Academic Press; 2001. pp. 170–189. [Google Scholar]
- 32.Krishnan S, Schenkman JB, Rusling JF. J. Phys. Chem. B. 2011;115:8371–8380. doi: 10.1021/jp201235m. [DOI] [PMC free article] [PubMed] [Google Scholar]
- 33.Krishnan S, Wasalathanthri DP, Zhao L, Schenkman JB, Rusling JF. J. Am. Chem. Soc. 2011;133:1459–1465. doi: 10.1021/ja108637s. [DOI] [PMC free article] [PubMed] [Google Scholar]
- 34.Wasalathanthri DP, Malla S, Faria RC, Rusling JF. Electroanalysis. 2012;24:2049–2052. doi: 10.1002/elan.201200373. [DOI] [PMC free article] [PubMed] [Google Scholar]
- 35.(a) Sesardic D, Boobis AR, Murray BP, Murray S, Segura J, De La Torre R, Davies DS. Br. J. Clin. Pharmacol. 1990;29:651–663. doi: 10.1111/j.1365-2125.1990.tb03686.x. [DOI] [PMC free article] [PubMed] [Google Scholar]; (b) Chun YJ, Ryu SY, Jeong TC, Kim MY. Drug Metab. Dispos. 2001;29:389–393. [PubMed] [Google Scholar]
- 36.(a) Guengerich FP. Chem. Res. Toxicol. 2008;21:70–83. doi: 10.1021/tx700079z. [DOI] [PubMed] [Google Scholar]; (b) Guengerich FP. Chem. Res. Toxicol. 2001;14:612–640. doi: 10.1021/tx0002583. [DOI] [PubMed] [Google Scholar]
- 37.Kim JH, Stansbury KH, Walker NJ, Trush MA, Strickland PT, Sutter TR. Carcinogenesis. 1998;19:1847–1853. doi: 10.1093/carcin/19.10.1847. [DOI] [PubMed] [Google Scholar]
- 38.Shimada T, Gilliam EMJ, Oda Y, Tsumura F, Sutter TR, Guengerich FP, Inoue K. Chem. Res. Toxicol. 1999;12:623–629. doi: 10.1021/tx990028s. [DOI] [PubMed] [Google Scholar]
- 39.Bauer E, Guo Z, Ueng Y, Bell LC, Zeldin D, Guengerich FP. Chem. Res. Toxicol. 1996;8:136–142. doi: 10.1021/tx00043a018. [DOI] [PubMed] [Google Scholar]
- 40.Fretland AJ, Omiecinski CJ. Chem.-Biol. Interact. 2000;129:41–59. doi: 10.1016/s0009-2797(00)00197-6. [DOI] [PubMed] [Google Scholar]
- 41.Benigni R, Bossa C. Chem. Rev. 2011;111:2507–2536. doi: 10.1021/cr100222q. [DOI] [PubMed] [Google Scholar]
- 42.Brandon EFA, Raap CD, Meijerman I, Beijnen JH, Schellens JHM. Toxicol. Appl. Pharmacol. 2003;189:233–246. doi: 10.1016/s0041-008x(03)00128-5. [DOI] [PubMed] [Google Scholar]
- 43.Pan S, Li D, Zhao L, Schenkman JB, Rusling JF. Chem. Res. Toxicol. 2013;26:1229–1239. doi: 10.1021/tx400147c. [DOI] [PMC free article] [PubMed] [Google Scholar]
- 44.(a) Wang JJ, Marshall WD, Law B, Lewis DM. Int. J. Mass Spectrom. 2003;230:45–55. [Google Scholar]; (b) Beland FA, Churchwell MI, Von Tungeln LS, Chen S, Fu PP, Culp SJ, Schoket B, GyŐrffy E, Minárovits J, Poirier MC, Bowman ED, Weston A, Doerge DR. Chem. Res. Toxicol. 2005;18:1306–1315. doi: 10.1021/tx050068y. [DOI] [PubMed] [Google Scholar]
- 45.(a) Hollenberg PF. Drug Metab. Rev. 2002;34:17–35. doi: 10.1081/dmr-120001387. [DOI] [PubMed] [Google Scholar]; (b) Guengerich FP. Adv. Pharmacol. 1997;43:7–35. doi: 10.1016/s1054-3589(08)60200-8. [DOI] [PubMed] [Google Scholar]
- 46.Wienkers LC, Heath TG. Nat. Rev. Drug Discovery. 2005;4:825–834. doi: 10.1038/nrd1851. [DOI] [PubMed] [Google Scholar]
- 47.(a) Fox CH, Selkirk JK, Price FM, Croy RG, Sanford KK, Cottler-Fox M. Cancer Res. 1975;35:3551–3557. [PubMed] [Google Scholar]; (b) Selkirk JK, Croy RG, Whitlock JP, Jr, Gelboin HV. Cancer Res. 1975;35:3651–3655. [PubMed] [Google Scholar]; (c) Gautier J, Urban P, Beaune P, Pompon D. Eur. J. Biochem. 1993;11:63–72. doi: 10.1111/j.1432-1033.1993.tb19870.x. [DOI] [PubMed] [Google Scholar]
- 48.(a) Khojasteh SC, Prabhu S, Kenny JR, Halladay JS, Lu AYH. Eur. J. Drug Metab. Pharmacokinet. 2011;36:1–16. doi: 10.1007/s13318-011-0024-2. [DOI] [PubMed] [Google Scholar]; (b) Bourrié M, Meunier V, Berger Y, Fabre G. J. Pharmacol. Exp. Ther. 1996;277:321–332. [PubMed] [Google Scholar]
- 49.Walsky RL, Obach RS. Drug Metab. Dispos. 2004;32:647–660. doi: 10.1124/dmd.32.6.647. [DOI] [PubMed] [Google Scholar]
- 50.Testino S, Patonay G. J. Pharm. Biomed. Anal. 2003;30:1459–1467. doi: 10.1016/s0731-7085(02)00480-6. [DOI] [PubMed] [Google Scholar]
- 51.Eagling V, Tjia JF, Back DJ. Br. J. Clin. Pharmacol. 1998;45:107–114. doi: 10.1046/j.1365-2125.1998.00679.x. [DOI] [PMC free article] [PubMed] [Google Scholar]
- 52.Moody GC, Griffin S, Mather A, McGinnity D, Riley R. Xenobiotica. 1999;450:53–75. doi: 10.1080/004982599238812. [DOI] [PubMed] [Google Scholar]
Associated Data
This section collects any data citations, data availability statements, or supplementary materials included in this article.


