Abstract
Photoacoustic (PA) thermography is a promising tool for temperature measurement in deep tissue. Here, we propose an absolute temperature measurement method based on the dual temperature dependences of the Grüneisen parameter and the speed of sound in tissue. By taking ratiometric measurements at two adjacent temperatures, we can eliminate the factors that are temperature irrelevant but difficult to correct for in deep tissue. To validate our method, absolute temperatures of blood-filled tubes embedded ~9 mm deep in chicken tissue were measured in a biologically relevant range from 28 °C to 46 °C. The temperature measurement accuracy was ~0.6 °C. The results suggest that our method can be potentially used for absolute temperature monitoring in deep tissue during thermotherapy.
In clinical cancer therapies, heating is an effective tool for oncologists. Applied in radiotherapy and chemotherapy, hyperthermia can dramatically increase the efficacy of radiation-induced cell damage and drug delivery, respectively [1]. Alternatively, thermotherapy can directly damage the tumor cells through thermal ablation [2]. In these thermal treatments, it is critical to noninvasively monitor the deep tissue temperature in real time, so that the heating can be precisely controlled both temporally and spatially in order to reach the desired temperature for a sufficient duration to cause cancerous cell necrosis, and to minimize undesired damage to surrounding healthy cells [3]. So far, various imaging techniques, including magnetic resonance imaging (MRI) [4], ultrasound imaging [5], and photoacoustic tomography (PAT) [6], have been used for noninvasive temperature monitoring during deep tissue thermotherapy. However, the MRI method, based on the temperature dependence of the proton resonance frequency, is not fast enough for real-time temperature readout. The ultrasound method, based on the temperature dependence of the speed of sound, suffers from low imaging contrast and senses only relative temperature changes.
Recently, PAT has been drawing attention for use in noninvasive temperature measurement, taking advantage of its rich optical absorption contrast, high detection sensitivity, and deep penetration depth [7]. In PAT, optical excitation converts a small change in the Grüneisen parameter (the conversion efficiency of optical energy deposition to pressure) to a fractionally equal change in ultrasound signal amplitude. Therefore, PAT is extremely sensitive to changes in the Grüneisen parameter, which increases with the equilibrium temperature, thereby enabling temperature measurement with high sensitivity. However, like ultrasound thermometry, current PA thermometry can measure only temperature changes compared to a baseline, based on the linear amplitude-temperature relationship calibrated ex vivo [6]. Although it is possible to derive the absolute temperature by compensating for the local light deposition at a superficial depth (< 1 mm), it remains challenging to get the absolute temperature in deep tissue.
Here, we improve PA thermometry using the temperature dependence of the speed of sound in tissue. As a result, absolute temperatures in deep tissue can be quantified. Ratiometric operations at different temperatures can eliminate temperature-insensitive factors such as the local light deposition and the target dimension, and thus the absolute temperatures can be computed by solving a pair of linear equations related to the temperature-induced changes in the PA signal amplitude and acoustic flight time.
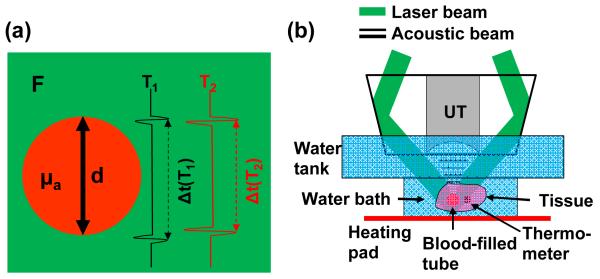
The principle of the proposed method is illustrated in Fig. 1(a). For a target (e.g., a blood vessel) embedded in tissue, the PA signal amplitude can be expressed as,
| (1) |
where P is the signal amplitude detected by the ultrasonic transducer, T is the equilibrium temperature, Γ is the Grüneisen parameter, and ηth is the percentage of the absorbed photon energy that is converted into heat. μa is the optical absorption coefficient, and F is the local optical fluence.
Fig. 1.
Absolute temperature measurement by deep photoacoustic macroscopy (PAMac). (a) Illustration of the phantom parameters used for the temperature measurement. F, local laser fluence; μa, absorption coefficient of the blood-filled tube; d, diameter of the blood-filled tube. When the temperature increases from T1 to T2, both the PA signal amplitude and the speed of sound increase. (b) Schematic of the temperature measurement on PAMac. The blood-filled tube and thermometer were embedded in fresh chicken breast tissue suspended in a water bath, whose temperature was regulated by an electrical heating pad and homogenized by continuous stirring. UT, ultrasonic transducer.
In limited-view PA imaging as shown in Fig. 1(a), the top and bottom boundaries of the target can be clearly imaged [8]. The acoustic flight time Δt between the two boundaries can be written as
| (2) |
where d is the dimension of the target along the acoustic flight path and va is the speed of sound.
During thermotherapy, if two PA measurements are performed at temperatures T1 and T2, the ratios of the two measurements give
| (3) |
| (4) |
here, we assume that all the tissue parameters in Eqs. (1-2) are temperature insensitive except Γ and va. This assumption has been experimentally validated by previous studies within a temperature range as wide as from 10 °C to 55 °C [9, 10]. When the tissue temperature is raised to more than 60 °C, the tissue’s optical properties may change due to protein denaturing [3]. Furthermore, the effect of tissue thermal expansion is neglected, since it is typically more than two orders of magnitude less than that induced by the change in speed of sound (linear thermal expansion coefficient of water: 6.9×10⁻⁵/°C) [5]. Here, we also assume that the local optical fluence does not change during the temperature change. This assumption can be easily satisfied when the temperature induced light attenuation change (e.g., change in oxygen saturation of hemoglobin) is small and localized, e.g., within a blood vessel or a tumor region.
Previous studies have shown that both Γ and va can be approximated as linear functions of temperature within the range from 10 °C to 55 °C. Accordingly, we can rewrite Eqs. (3-4) as
| (5) |
| (6) |
where the four coefficients c1-4 can be experimentally calibrated. From Eqs. (5-6), we can then solve for the temperatures T1 and T2 in absolute units. It is worth pointing out that, although two measurements are still required here, unlike previous PA thermometry, our method does not need any measurement at a known baseline temperature, which is usually not practical in deep tissue, especially for internal organs where the temperature may be significantly different from other parts of the body.
Although the current method is initiated for absolute temperature measurement during thermotherapy, it is essentially a two-state ratiometric method. The same concept can be applied to any conditions with a spontaneous or induced temperature perturbation. Therefore, for single-time temperature measurement, an additional photothermal (e.g., CW laser) or acoustic-thermal (e.g., HIFU transducer) source can be used to induce a small temperature increase in the region of interest, then the baseline condition and the perturbation condition can serve as the two states needed in our method. Furthermore, this method is not restricted to a single target in the measurement of acoustic flight time. If the target’s boundaries are too close to be resolved, we can choose two targets at different depths in the region of interest, provided that the temperature is uniform between the two targets. For bulk tissues, blood vessels at different depths can be identified as targets. For a temperature range greater than 55 °C but less than the boiling point, we can operate successively over two adjacent temperature points such that the assumption on the temperature insensitivity of the parameters continues to hold for each step.
Dark-field deep photoacoustic macroscopy (PAMac) was used in this study. The system has been described in detail previously [11]. Briefly, as shown in Fig. 1(b), a Ti:sapphire laser generating nanosecond pulses at 800 nm serves as the illumination source. A dark-field illumination pattern is formed by the combination of a spherical conical lens and a weakly focusing optical condenser, and is coaxially aligned with the ultrasound focus in water. Generated PA waves are detected by a single-element 5-MHz ultrasound transducer and collected at a sampling rate of 500 MHz. A transverse spatial resolution of 560 μm and an axial resolution of 144 μm have been achieved, with an imaging depth of more than 20 mm in biological tissue. The spatial resolution and imaging depth are highly scalable as a function of the ultrasonic frequency. The phantom was made of plastic tubes filled with whole bovine blood, embedded in fresh chicken breast tissue. The phantom was submerged in a water bath, whose temperature was adjusted by an electrical heating pad. The water bath was continuously stirred to homogenize the temperature. A calibrated thermometer was attached to the blood-filled tube, and its reading was used as the ground truth of the temperature.
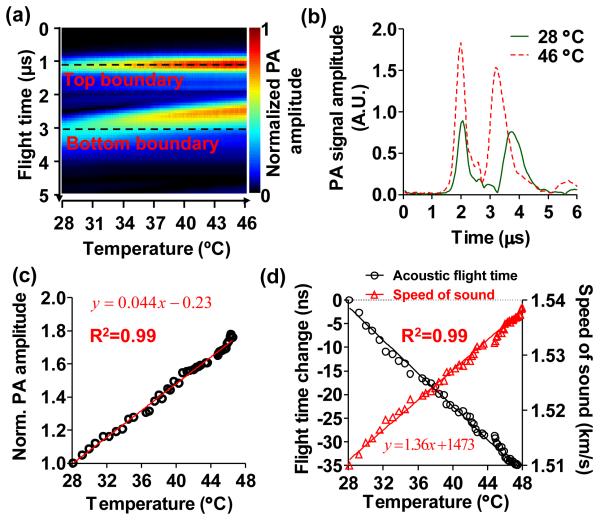
Firstly, the system was calibrated using a 3-mm- diameter blood-filled tube in a clear medium. The signal amplitude and acoustic flight time between the top and bottom boundaries of the tube were measured as the temperature changed from 28 °C to 46 °C. As shown in Fig. 2(a), the PA signals from both boundaries increased with the temperature due to the elevated Grüneisen parameter, and the acoustic flight time between the two boundaries decreased due to the increased speed of sound. Note that the PA signals were aligned at the top boundaries to better visualize the changes in flight time. Two representative PA signals are plotted in Fig. 2(b), showing a 79.5% increase in the PA signal amplitude and a 1.7% increase in the speed of sound when the temperature changed from 28 °C to 46 °C. The linear fittings of the change in PA signal amplitude relative to the signal at 28 °C, and of the speed of sound as a function of temperatures are shown in Fig. 2(c-d), respectively. The results show that every degree of temperature increase leads to a 4.4% increase in the PA signal amplitude and a 0.10% (~1.5 m/s) increase in the speed of sound, consistent with findings reported in the literature [9, 10].
Fig. 2.
Systematic calibrations for absolute temperature measurement. (a) Assembly of the time-resolved A-line signals of a 3-mm-diameter blood-filled tube in a clear medium with changing temperature. The top and bottom boundaries of the tube are marked by the dashed lines. As the temperature increased, the PA signal amplitude increased and the acoustic flight time between the two boundaries decreased. The A-lines were aligned at the top boundary for better visualization of the change in acoustic flight time. (b) Representative A-line signals at 28 °C and 46 °C, showing the changes in PA signal amplitude and the acoustic flight time. (c) Normalized PA signal amplitude as a function of temperature between 28 °C to 46 °C, showing the temperature dependence of Grüneisen parameter. Solid line: linear fitting. (d) Change in acoustic flight time (left axis) and speed of sound (right axis) as a function of temperature. Solid lines: first-order rational fitting for flight time, linear fitting for speed of sound.
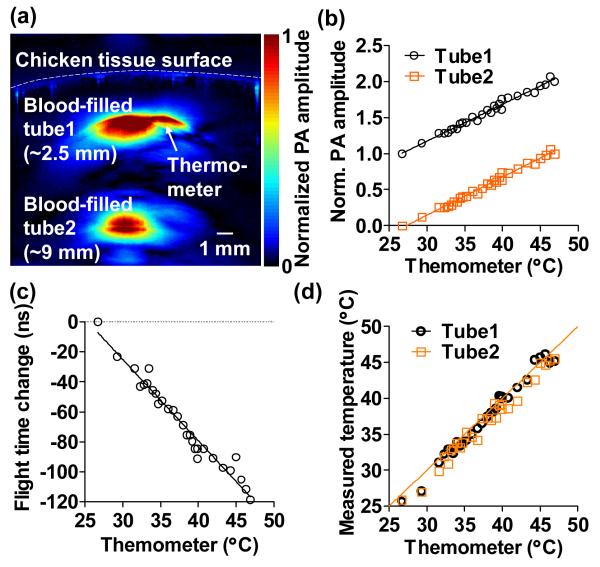
Secondly, we performed absolute temperature measurement in deep tissue based on the above calibration results. In this experiment, two 1-mm- diameter blood-filled tubes were embedded in chicken tissue at depths of ~2.5 mm and ~9.0 mm, respectively, as shown in Fig. 3(a). The laser fluence on the sample surface was ~20 mJ/cm2. The water bath temperature was varied from 27 °C to 47 °C. The PA signal amplitudes of the two blood-filled tubes were measured, and the acoustic flight time between the two tubes was calculated with the temperature change. As shown in Fig. 3(b), the PA amplitude normalized to that at the starting temperature from both tubes followed the same slope as a function of the thermometer readings, which indicated that the temperatures of the two tubes were the same. Again, the change in the acoustic flight time between the tubes was approximately inversely proportional to the temperature. Finally, the absolute temperatures of both tubes were computed based on Eqs. (5-6), and the results agreed well with the thermometer readings, as shown in Fig. 3(d). The root-mean-squared errors show a measurement accuracy of 0.4 °C for the shallower tube and 0.6 °C for the deeper tube. The temperature measurement becomes less accurate for deeper tissue mainly due to the lower signal-to-noise ratio. The major error source is the acoustic flight time measurement, since the temperature-induced change in the speed of sound is small. Nevertheless, the measurement accuracy can be improved by increasing the excitation fluence, selecting targets with longer distance in between, or signal averaging at the expense of measurement time. The minimum target distance required for the speed of sound measurement is inversely proportional to the temperature change between two consecutive measurements. In the temperature range from 28 °C to 55 °C, the minimum target distance for one degree of temperature change is ~3 mm.
Fig. 3.
Absolute temperature measurement in deep tissue. (a) Representative cross-sectional image acquired at 800 nm, showing two blood-filled tubes embedded in chicken breast tissue at depths of ~2.5 mm and ~9 mm, respectively. A thermometer was also embedded at the same depth as the top tube. (b). Relative changes in the PA amplitudes from the two tubes followed the same slopes as a function of thermometer readings, which indicated the homogeneous temperature distribution in the tissue. The signals were shifted for clarity. Solid lines: linear fitting. (c) Change in the acoustic flight time between the two tubes as a function of temperature. Solid line: first-order rational fitting. (d) Absolute temperatures measured at the top and bottom tubes as a function of the thermometer readings. Solid line: y = x.
Although we took measurements only after the temperature reached equilibrium in the entire water bath in our experiment, the measurement speed should be mainly limited by the laser repetition rate as long as the local temperature in the measured region is homogenous. The mathematical framework in our method is designed for local or regional thermotherapy, which heats a part of the body such as a diseased organ or the entire tumor. In regional thermotherapy, the heated region typically has a diameter of more than tens of millimeters, thus the temperature uniformity within a few millimeters can be satisfied. In the highly confined heating situations, such as laser thermotherapy, where the temperature gradient can be large, the average temperature within the heated region can be estimated by our method.
In conclusion, we have demonstrated a photoacoustic method for absolute temperature measurement in deep tissue. Our method is based on combining the temperature dependences of the Grüneisen parameter and the speed of sound in tissue. The ratiometric method eliminates the factors that are temperature insensitive but difficult to correct for. Combined with previously demonstrated functional, flow dynamic, and metabolic imaging capabilities of PAT [12], absolute PA thermometry has the potential to provide physicians with real- time multi-parametric information during thermotherapy, which is closely related to the tissue viability and functionality. This method can be applied in moderate thermotherapy of cancers, which heats cancer cells to the range of 40 °C to 42 °C. The therapy damages cancer cells directly, makes the cancer cells radiosensitive, and increases the pore size to improve delivery of chemotherapeutic and immunotherapeutic agents. Most local and regional cancer treatments are in this temperature range. The measurement depth will be good for skin cancer, neck cancer and even brain cancer thermotherapy.
Acknowledgements
The authors appreciate Prof. James Ballard’s close reading of the manuscript. We thank Lidai Wang and Arie Krumholz for helpful discussions. This work was sponsored by NIH grants DP1 EB016986 (NIH Director’s Pioneer Award), R01 EB008085, R01 CA134539, U54 CA136398, R01 CA157277, and R01 CA159959. L. V. Wang has a financial interest in Endra, Inc., and Microphotoacoustics, Inc., which, however, did not support this work.
References
- 1.Falk MH, Issels RD. Int J Hyperther. 2001;17:1–18. doi: 10.1080/02656730150201552. [DOI] [PubMed] [Google Scholar]
- 2.Goldberg SN, Gazelle GS, Mueller PR. Am J Roentgenol. 2000;174:323–331. doi: 10.2214/ajr.174.2.1740323. [DOI] [PubMed] [Google Scholar]
- 3.Dewhirst MW, Viglianti BL, Lora-Michiels M, Hanson M, Hoopes PJ. Int J Hyperther. 2003;19:267–294. doi: 10.1080/0265673031000119006. [DOI] [PubMed] [Google Scholar]
- 4.Quesson B, de Zwart JA, Moonen CTW. J Magn Reson Imaging. 2000;12:525–533. doi: 10.1002/1522-2586(200010)12:4<525::aid-jmri3>3.0.co;2-v. [DOI] [PubMed] [Google Scholar]
- 5.MaassMoreno R, Damianou CA. J Acoust Soc Am. 1996;100:2514–2521. doi: 10.1121/1.417359. [DOI] [PubMed] [Google Scholar]
- 6.Pramanik M, Wang LV. J Biomed Opt. 2009;14:054024. doi: 10.1117/1.3247155. [DOI] [PMC free article] [PubMed] [Google Scholar]
- 7.Yao J, Wang LV. Contrast Media Mol Imaging. 2011;6:332–345. doi: 10.1002/cmmi.443. [DOI] [PMC free article] [PubMed] [Google Scholar]
- 8.Xu Y, Wang LV, Ambartsoumian G, Kuchment P. Med Phys. 2004;31:724–733. doi: 10.1118/1.1644531. [DOI] [PubMed] [Google Scholar]
- 9.Bilaniuk N, Wong GSK. J Acoust Soc Am. 1993;93:1609–1612. [Google Scholar]
- 10.Shah J, Park S, Aglyamov S, Larson T, Ma L, Sokolov K, Johnston K, Milner T, Emelianov SY. J Biomed Opt. 2008;13:034024. doi: 10.1117/1.294036. [DOI] [PMC free article] [PubMed] [Google Scholar]
- 11.Song KH, Wang LV. J Biomed Opt. 2007;12:060503. doi: 10.1117/1.2818045. [DOI] [PubMed] [Google Scholar]
- 12.Yao J, Maslov KI, Zhang Y, Xia Y, Wang LV. J Biomed Opt. 2011;16:076003. doi: 10.1117/1.3594786. [DOI] [PMC free article] [PubMed] [Google Scholar]


