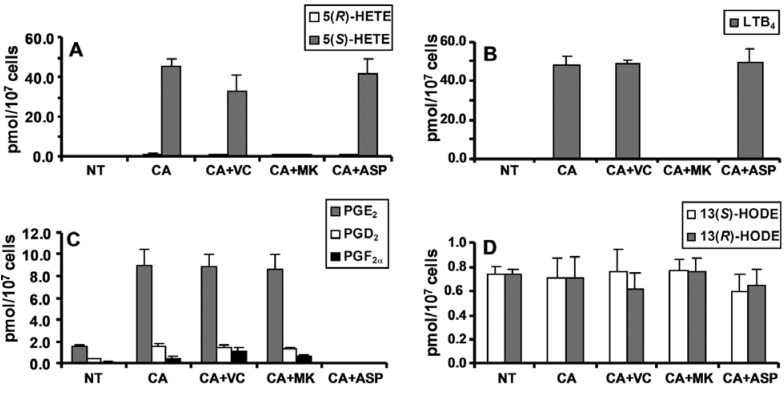
Figure 6.
Amount of lipid peroxidation metabolites from CESS cells. A, 5-HETEs. B, LTB4. C, PGE2, PGD2, and PGF2α. D, 13-HODEs. NT, no treatment; CA, treated with 1.0 μm A23187; CA+VC, treated with 1.0 μm A23187 and 1.0 mm vitamin C; CA+MK, treated with 1.0 μm A23187 and 1.0 μm MK886; CA+ASP, treated with 1.0 μm A23187 and 200.0 μm aspirin. Analyses were performed by stable isotope dilution LC-ECAPCI/SRM/MS of PFB derivatives. Determinations were conducted in triplicate (means ± S.D.). Reprinted with permission from Ref. [108].

