
Figure 4.
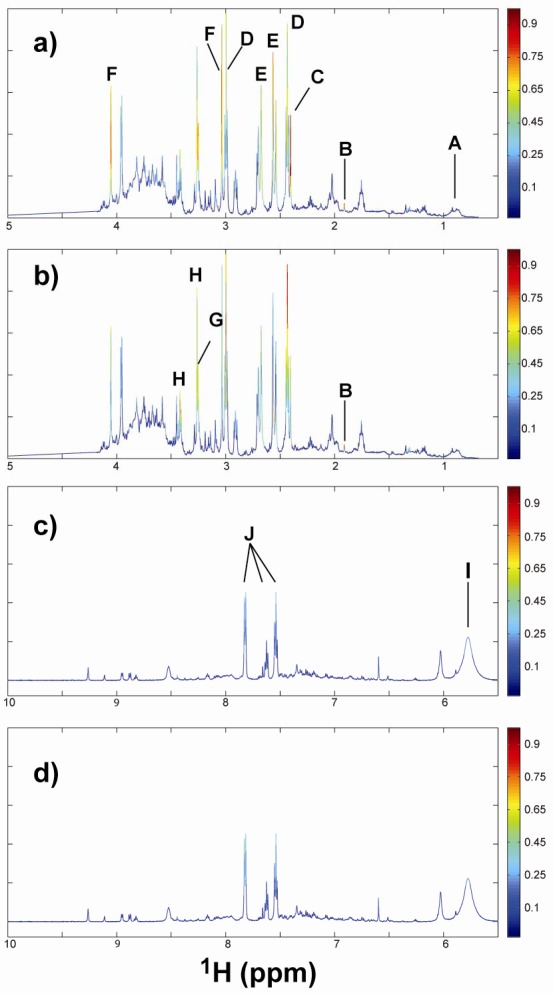
Urine 1H NMR spectra with color mapping showing the relative orthogonal signal correction-filtered partial least squares discriminate analysis (OSC-PLSDA) variable importance in projection (VIP) coefficients for sample classification. Representative spectrum is for a control animal in week 1. Expansion of different spectral regions with the VIP color coding with the TBP-treated (a,c) and the TPP-treated (b,d). Representative metabolites are labeled: A: Dibutyl phosphate, B: Acetate, C: Succinate, D: 2-Oxoglutarate, E: Citrate, F: Creatine, G: Betaine, H: Taurine, I: Urea, J: Benzoate.