

Abstract
The prevalence of metabolic syndrome, hypertension, and diabetes has been increasing rapidly in Korea. The rate of increase has paralleled the replacement of Korean traditional diets (KTD), which emphasize vegetables and fermented foods, with western style dietary patterns that are rich in animal foods and saturated fat. We aimed to investigate the efficacy of the KTD in controlling fasting plasma glucose, blood pressure, and cardiovascular disease risk factors in hypertensive and type 2 diabetic (T2D) patients. Forty-one patients (61.8±1.5 years) who were taking medications prescribed for respective diseases were recruited from the Chonbuk National University Hospital for participation in a 12-week, parallel, controlled clinical trial. The control group (n=20) was advised to “eat as usual,” whereas the experimental KTD diet group (n=21) was fed the KTD three times a day for 12 weeks. At the end of the trial, both groups had lower body mass index, % body fat, and waist–hip ratio compared to the baseline values (P<.05). Compared to the control group, the KTD group had a greater mean change (P<.05) from the baseline for glycated hemoglobin (HbA1c) (−0.72% vs. −0.25%) and heart rate (−7.1 vs. +1.6). Regular consumption of the KTD for 12 weeks by hypertensive and T2D patients resulted in favorable changes in cardiovascular risk factors.
Key Words: : cardiovascular risk, diabetes, Korean traditional diet (KTD), hypertension, metabolic syndrome
Introduction
The prevalence of metabolic syndrome (MS) has been increasing around the world. MS is associated with increased risk of developing coronary heart disease, overall mortality, and cardiovascular mortality.1–3 In South Korea, the prevalence of MS has increased significantly from 24.9% in 1998 to 31.3% in 2007.4,5 These increases in MS have been attributed to changes in socio-environmental and lifestyle factors, as Korean's dietary and disease patterns have been changing along with its accelerated socioeconomic development that began in the 1970s. Since that time, major dietary changes have decreased the intake of plant foods and grain groups and increased the intake of animal foods.6,7 The main cause of death in Korea before 1970s was pneumonia.7 Consumption rate of animal foods in Korea increased significantly in mid-1970s, replacing plant foods that were rich in traditional Korean diets.6 Although increased energy consumption may be partially responsible for the increasing incidence of metabolic diseases, it is also possible that the qualitative changes in dietary choices might have resulted in the increase in cardiovascular diseases (CVDs) and MS. Westernization of Korean dietary habits are also believed to be culpable in the increasing prevalence of CVD and disease patterns in Korea.4,5,7 The upward trends in the incidence of chronic diseases in Korea8 have underscored the importance of managing MS as a means of preventing CVDs.9,10
Lifestyle modification is generally recognized as a key intervention in MS due to its complex treatment strategies.2 Modification of dietary patterns has generally been accepted as a cornerstone of treating people with type 2 diabetes (T2D) and hypertension, as appropriate energy intake improves glycemic control and risk complications.8,11 The Korean traditional diet (KTD) is generally characterized by a variety of fermented soybean products and vegetable-based foods, which are rich in bioactive compounds that promote cardiovascular health and glycemic control.12 The management of diabetes mellitus,10,13,14 cardiovascular events,10,12,13,15–25 hypertension,17,21 MS,12,18 and obesity19,20 has been shown to be improved by adherence to healthy diets. In previous retrospective studies, the Korean diet eating pattern was associated with a lower risk of T2D,5 hypertension,17 obesity,19,20,25 and MS.12,20,22,24,25 However, these studies were carried out by observational epidemiological study design. No prospective or intervention studies that can substantiate the association as a cause-and-effect relationship have been reported in patients with hypertension and T2D. The objective of the present 12-week intervention-prescribed diet study was to investigate the efficacy of the KTD in controlling fasting plasma glucose (FPG), blood pressure, and cardiovascular risk factors in hypertensive and T2D patients who were taking medications prescribed for respective diseases.
Materials and Methods
Subjects
The study subjects were recruited from the Clinical Trial Center for Functional Foods (CTCF2) in the Chonbuk National University Hospital, from August to September 2010. Potential participants were recruited through the hospital diabetes and hypertension clinics, regional diabetes retinal screening services, and advertisement in local newspapers. The participants were restricted to those who were older than 18 years, medically diagnosed with hypertension and T2D, and were taking oral medications to control blood pressure, plasma glucose, and lipids. Among 50 qualified patients with diagnosed hypertension and T2D, 48 patients were enrolled in the randomized trial (Fig. 1). Subjects excluded from the study were those who had (1) hypertension (diastolic blood pressure [DBP] >116 mmHg or systolic blood pressure [SBP] >200 mmHg) with a history of cardiovascular events; (2) type 1 diabetes mellitus or uncontrolled T2D (glycated hemoglobin [HbA1c]>9.0%); (3) history of cancer; (4) hematologic retinopathy or neuroretinopathy; (5) digestive or central nervous system disorders; (6) severe or malignant retinopathy; (7) impairment of renal and liver function, dysproteinemia, nephritic syndrome, or other renal diseases; (8) coagulopathy or human immunodeficiency virus; (9) histories of taking psychiatric medications in the previous 2 months; (10) medical histories or conditions that would affect assimilation of foods as gastric bypass surgeries; (11) participating in other clinical trials within the previous 2 months; (12) renal diseases such as acute/chronic renal failure and nephrotic syndrome; (13) laboratory tests, medical or psychological conditions deemed by the investigators to interfere with successful participation in the study; (14) history of alcoholism; and (15) pregnant and/or breastfeeding women. Each patient completed a personal health and medical history questionnaire that served as a screening tool. All subjects completed written informed consents before the onset of the study. The study was conducted according to the Declaration of Helsinki. The research protocol was approved by the Institutional Review Board (IRB) of Chonbuk National University Hospital, Republic of Korea.
FIG. 1.
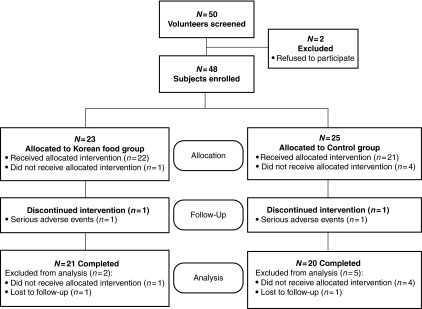
Flow chart for the study subjects.
Experimental protocol
Study design
A 12-week, randomized, parallel, controlled clinical trial was carried out with diet interventions at the CTCF2. We considered participants to be suitable for randomization to the KTD group and the control group if they met the selection criteria stated under the description of subjects, were receiving a set of classes, and drug treatments for blood glucose, blood pressure, and lipid control according to the national and international guidelines for the management of T2D.26,27 Computer-generated random numbers were used to assign each subject to either the experimental or control group. The control group (n=20) was instructed to “eat as usual,” whereas the KTD group (n=21) was fed the KTD for 12 weeks. All subjects were instructed to maintain their usual activity levels and use no other functional foods or dietary supplements during the intervention period. Medication dosages were monitored for all patients throughout the study period. The subjects were monitored for current medication use and self-reported symptoms or side effects, changes in physical activities, lifestyles, and compliance to the respective dietary regimens.
Dietary intervention
All participants in the present study had received some nutrition education from their physicians and dietitians on diabetic dietary management.26 Although subjects were randomly assigned to one of the two dietary groups, patients could not be blinded from the dietary intervention of the KTD versus control diet. The KTD group meals were prepared at the hospital nutrition kitchen on a 13-day menu cycle. The participants of the KTD group visited the clinical trial center every day and consumed meals three times a day under close observation by researchers. The KTD trial diet menu was developed based on the typical Korean diets consumed in the 1970s.6,7
Briefly, the KTD used in the present study followed the common traditional Korean table settings and menu called “3-chup bansang” (meaning three side dishes excluding routine dishes such as rice, soup, and condiments).28 The KTD consisted of rice, soup, kimchi, fermented soy-based condiments, vegetables either raw or cooked, roasted or baked fish or meat, and dry-preserved dish for all three meals a day throughout the 12-week intervention. The KTD was characterized by high vegetable and low red meat consumption.7,13 The number of servings from each food group was adjusted for each individual to meet the Korean recommended dietary allowance.29 The KTD specifically excluded bread, milk, and other dairy products, which had not been a part of traditional Korean menus.
The control group was not given a prescribed diet regimen, as Koreans currently consume a variety of western food items. They were instead instructed to “eat and exercise as usual” while following the Korean Diabetes Association's dietary guidelines,30 which emphasize dietary intake that can help control FPG levels, maintain weight, meet nutritional requirements, and consume adequate energy derived from carbohydrates (50–60%), protein (15–20%), and fat (20–25%).
The purpose of this study was to evaluate whether routine consumption of KTD for 12 weeks has effects on cardiovascular risk factors. The KTD did not have restrictions in caloric and sodium intake as they were instructed to consume as much as they want to eat. All KTD meals were prepared with sea salt and fermented soy condiments, such as soy sauce and soybean paste, and red pepper paste called gochujang. Caloric intake of the KTD group was at about 2050 kcal/day, which is similar to those reported by men and women at the national level (1681 and 2406 kcal/day for 50- to 64-year-old women and men, respectively)31 (Table 1).
Table 1.
Daily Dietary Composition of Korean Traditional Diet Group
| Nutrients | Food groups (g) | Components of KTD (g) | |||
|---|---|---|---|---|---|
| Energy (kcal) | 2050 | Fruits | 102.6 | Steamed rice | 630 |
| Protein (% of energy) | 16.7 | Vegetables | 797.7 | Soup | 750 |
| Animal (% of energy) | 4.3 | Total grain | 312.3 | Kimchi | 150 |
| Plant (% of energy) | 12.4 | Whole grain | 270.0 | Vegetables either raw or cooked | 360 |
| Total lipid (% of energy) | 20.8 | Dairy products | 0 | Soy-based condiments | 50 |
| Animal (% of energy) | 2.7 | Meat | 16.2 | Dry-preserved dish | 58.5 |
| Plant (% of energy) | 18.1 | Fish | 64.0 | Roasted or baked fish or meat | 83.5 |
| Saturated fat (% of energy) | 1.8 | Egg | 5.2 | ||
| Monounsaturated fat (% of energy) | 3.5 | Legumes | 88.5 | ||
| Polyunsaturated fat (% of energy) | 3.8 | Seaweeds | 18.5 | ||
| Cholesterol (mg) | 184.8 | ||||
| Carbohydrate (% of energy) | 62.5 | ||||
| Fiber (g) | 50.4 | ||||
| Potassium (g) | 5468 | ||||
| Sodium (mg) | 7014 | ||||
| Calcium (mg) | 1085 | ||||
| Iron (mg) | 28.4 | ||||
Safety assessment
Safety measurements taken for the subjects included electrocardiograms, hematological tests, and complete blood chemistry panels, including white and red blood cell counts, hemoglobin, hematocrit, platelet count, total protein, albumin, alanine aminotransferase (ALT), aspartate aminotransferase (AST), blood urea nitrogen (BUN), and creatinine levels. Pulse and blood pressure were measured after a 5-min rest at each visit by using the OMRONT4 digital blood pressure monitor (Omron Corp., Tokyo, Japan).
Anthropometric measurement
Height and body weight were measured using a digital scale while the subjects were wearing a light hospital gown. Body mass index (BMI) was calculated by weight (kg)/height (m)2. Waist circumference was measured twice to the nearest 0.1 cm with a measuring tape at the midpoint between the lower border of the ribs and the upper border of pelvis. Hip circumference was measured at the largest extension of the buttocks. Total body fat and lean mass were determined using a bioelectric impedance analyzer (Inbody 3.0; Biospace Co., Ltd., Seoul, Korea).
Metabolic parameters
Metabolic data were obtained using standard protocols of the clinical laboratory of the Chonbuk National University Hospital; the measurements were repeated to make a total of five visits to the clinic, that is, at the initial screening, week 0 (baseline), 4, 8, and 12. The data on demographics, smoking, physical activity, alcohol drinking, medical history, dietary intake, anthropometric and biochemical parameters, and vital signs were obtained from each individual in both groups. Blood samples were collected after 12 h fasting and were stored at −80°C until further analysis. Blood chemistry included total cholesterol, high-density lipoprotein cholesterol, low-density lipoprotein cholesterol (LDL-C), and triglycerides (TG) assayed by routine laboratory methods, and FPG, fasting insulin, and HbA1c by the Hitachi-7600 analyzer (Hitachi Ltd., Tokyo, Japan). Pancreatic β-cell function and insulin sensitivity were obtained by homeostasis model assessment (HOMA) using the HOMA of pancreatic β-cell function (HOMA-β) calculated as basal insulin (μIU/mL)×20/basal glucose (mmol/L) − 3.5, and the HOMA of insulin resistance (HOMA-IR) calculated as basal insulin (μIU/mL)×glucose (mmol/L)/22.5. Pancreatic β-cell secretory function or insulin reserve was determined from a mixed-meal stimulation test calculated by the increase in insulin level divided by the increase in glucose level over the same period. White blood cell count, red blood cell count, hemoglobin level, hematocrit, and platelet counts were measured with the Coulter LH 750 analyzer (Beckman Coulter, Inc., Fullerton, CA, USA). AST, ALT, albumin, BUN, creatine, and urinary sodium levels were measured with an autoanalyzer (Variant, Bio-Rad, Hercules, CA, USA). Resting blood pressure and heart rate (HR) were measured following a 10-min seated rest, and brachial SBP and DBP, and HR were measured using the Omron T4 digital blood pressure monitor (Omron Corp.). All measurements were repeated after 5-min rest.
Measurement of dietary intake
The food records consisting of two week days and one weekend day were obtained from each subject before the onset of the study. A trained dietitian provided each subject with instructions for completing the food record and interviewed the subject about the completion of the record upon collection of the record. Each subject provided two 3-day diet records for dietary assessment.
The KTD group foods were weighed each day for 12 weeks before and after meals. The dietary intake of the control group was also based on two 3-day dietary records. Each subject in the control group was provided a scale to weigh all the foods and beverages consumed every week. The food records were checked at the clinic visit every fourth week for its completeness. For each subject in both groups, the dietary intake of a total 36 days (3 days per week/during 12 weeks) was used in this study. Dietary intake data were analyzed by one dietitian throughout the study for consistency, using Can-Pro 3.0 software (The Korean Nutrition Society, Seoul, Republic of Korea).
Statistical analysis
All statistical analyses were performed according to the pre-established protocol using SPSS version 18.0 (SPSS, Inc., Chicago, IL, USA). Sample size for the study was estimated based on the mean (SE) percent of HbA1c difference between treatments in the previous study,32 −1.3 (0.2)% for experimental group and +0.2 (0.2)% for the control group. It was estimated to provide 80% power to detect a difference between the groups for HbA1c of 1.5 (SD: 2.4)% with α=0.05, using a two-tailed t-test of the difference between means. The minimum sample size was calculated to be 48 participants (24 per group), to allow for a 10% dropout rate of total 50 participants were selected. t-Tests were carried out for each variable to determine the statistical significance between the two groups. Paired t-tests were performed to test statistical significance between groups from 0 week to 12 weeks. Repeated measures mixed model analysis of variance was performed to determine the effects associated with time (with person variable), treatment (between-group variable), and the interaction of time and treatment. Statistical significance was accepted at P<.05.
Results
Recruitment and study subjects
The sampling and trial schemes of the present study are summarized in Figure 1. Of 50 prescreened subjects at the onset, two subjects were excluded for not meeting the selection criteria, either by laboratory tests and/or by physical examinations. Forty-eight subjects who met all inclusion and exclusion criteria were enrolled, but 43 were allocated for intervention. Forty-one subjects completed the study for 12 weeks. Two subjects from the KTD group (7.0%) and five subjects from the control group (20.0%) failed to complete the study. Seven subjects were disqualified because they received allocated intervention or serious adverse events or did not receive allocated intervention or not participating in other aspects of the study, and two subjects voluntarily withdrew. At the end, 41 subjects (KTD=21, control=20) remained in the study.
General characteristics of the subjects
As shown in Table 2, initially, the KTD and control groups did not differ significantly in age, gender, weight, BMI, body fat mass, and body fat percent. The clinical characteristics of the 41 subjects (n=19 women and 22 men) assigned randomly to the KTD and control groups also did not differ significantly. The use of hypoglycemic drugs, lipid-modifying drugs, and antihypertensive agents was equal in the two groups. No patient in this study was a smoker. Dietary intakes did not change over time and did not differ between the two groups in the course of the 12-week intervention for energy and macronutrients (Table 3).
Table 2.
General Characteristics of Subjects
| Variables | KTD group (n=21) | Control group (n=20) | P value |
|---|---|---|---|
| Age (years) | 63.3±2.0 | 60.2±1.9 | .254 |
| Sex (M/F) | 12/9 | 10/10 | .658a |
| Weight (kg) | 68.8±3.2 | 65.7±2.0 | .419 |
| BMI (kg/m2) | 25.9±0.9 | 25.6±0.7 | .642 |
| SBP (mmHg) | 127.2±2.6 | 128.3±3.7 | .802 |
| DBP (mmHg) | 71.2±1.2 | 75.6±3.0 | .177 |
| Heart rate (bpm) | 77.2±2.2 | 70.6±2.6 | .057 |
| FPG (mg/dL) | 118.6±6.9 | 118.8±6.1 | .958 |
| HbA1c (%) | 6.77±0.2 | 6.77±0.2 | .990 |
| TC (mg/dL) | 165.7±10.8 | 174.9±9.6 | .820 |
| TG (mg/dL) | 100.3±13.3 | 132.1±11.2 | .602 |
| HDL-C (mg/dL) | 43.8±2.1 | 39.3±1.8 | .924 |
| LDL-C (mg/dL) | 96.4±10.1 | 105.9±9.1 | .835 |
| Medication [n (%)] | |||
| Hypoglycemic | 21 (100) | 20 (100) | 1 |
| Antihypertensive | 21 (100) | 20 (100) | 1 |
| Lipid modifying | 21 (100) | 20 (100) | 1 |
| Habitual dietary intake | |||
| Energy (kcal) | 1651.5±72.7 | 1391.7±82.5 | .023* |
| Fat (%) | 18.47±1.1 | 17.08±1.2 | .403 |
| Carbohydrate (%) | 64.8±1.5 | 62.2±1.7 | .859 |
| Protein (%) | 15.9±0.4 | 16.4±0.7 | .556 |
| Fiber (g) | 22.4±1.3 | 20.16±1.3 | .222 |
Data are mean±SE values. P values were determined by independent t-test.
Chi-square test.
P<.05.
KTD, Korean traditional diet; BMI, body mass index; WHR, waist–hip ratio; TC, total cholesterol; HbA1c, glycated hemoglobin; TG, triglyceride; HDL-C, high-density lipoprotein cholesterol; LDL-C, low-density lipoprotein cholesterol; FFA, free fatty acid; ApoA1, apolipoprotein A1; ApoB, apolipoprotein B; SBP, systolic blood pressure; DBP, diastolic blood pressure; FPG, fasting plasma glucose; SE, standard error.
Table 3.
Dietary Intakes of the Korean Traditional Diet Group and Control Group Before and During the Study
| KTD group (n=21) | Control group (n=20) | |||||||||
|---|---|---|---|---|---|---|---|---|---|---|
| Daily dietary intake | Before | Intervention feeding period | Change* | Before | Intervention feeding period | Change* | P valuea | P valueb | P valuec | P valued |
| Calorie (kcal) | 1651.5±72.7 | 1883.1±15.9† | 231.7±66.8 | 1391.7±82.5 | 1547.9±68.3 | 156.2±61.6 | .412 | .347 | .001 | .416 |
| Carbohydrate (%) | 64.8±1.5 | 67.1±0.2 | 2.3±1.4 | 64.3±1.7 | 63.4±1.3 | 0.90±1.1 | .085 | .225 | .289 | .216 |
| Total protein (%) | 15.9±0.4 | 15.8±0.1 | −0.1±0.4 | 16.4±0.7 | 16.6±0.3 | 0.2±0.5 | .567 | .085 | .137 | .800 |
| Animal protein (%) | 6.9±0.5 | 4.2±0.8† | −2.3±0.5 | 6.7±0.7 | 7.4±0.4 | 0.8±0.6 | .001 | .010 | .228 | .004 |
| Plant protein (%) | 9.0±0.3 | 11.5±0.1† | 2.5±0.3 | 9.7±0.4 | 9.2±.0.3 | −0.5±0.4 | .001 | .098 | .017 | .001 |
| Total lipid (%) | 18.5±1.1 | 19.2±0.1 | 0.7±1.1 | 17.1±1.2 | 18.2±0.8 | 1.1±0.8 | .781 | .204 | .223 | .933 |
| Animal fat (%) | 8.9±1.0 | 3.2±0.1† | −5.7±0.9 | 6.8±0.9 | 9.2±0.9 | 2.6±0.9 | .001 | .006 | .026 | .001 |
| Plant lipid (%) | 9.5±0.7 | 16.0±0.1† | 6.5±0.6 | 10.3±0.3 | 9.0±0.5 | −1.3±0.1 | .001 | .752 | .063 | .001 |
| Cholesterol (mg) | 234.0±22.5 | 196.9±4.4 | −37.1±20.9 | 204.6±23.1 | 225.8±19.6 | 21.2±14.6 | .781 | .008 | .746 | .084 |
| Fiber (g) | 22.4±1.3 | 44.0±0.8† | 21.6±1.2 | 20.2±0.6 | 22.3±0.8 | 2.1±1.1 | .001 | .881 | .001 | .001 |
| Na (mg) | 3977.8±217.8 | 5863.3±169.9† | 1885.5±179.4 | 3708.1±311.2 | 4165.3±274.1 | 457.2±206.1 | .001 | .564 | .017 | .001 |
| Food groups (g) | ||||||||||
| Fruits | 104.7±16.4 | 107.5±0.8 | 2.8±16.6 | 119.2±18.6 | 143.4±31.5 | 24.1±33.4 | .564 | .512 | .198 | .583 |
| Vegetables | 293.0±17.4 | 645.6±16.7† | 352.6±17.5 | 269.3±23.6 | 305.5±21.3 | 36.2±19.0 | .001 | .448 | .001 | .001 |
| Total grain | 297.2±16.9 | 272.8±2.9 | −24.4±16.8 | 214.2±12.9 | 252.5±11.8 | 38.3±11.8 | .004 | .943 | .003 | .005 |
| Whole grain | 82.1±9.1 | 269.6±3.0† | 187.5±9.4 | 78.5±22.7 | 98.8±20.6 | 20.2±8.7 | .001 | .794 | .001 | .001 |
| Dairy products | 51.1±13.9 | 0±0† | −51.1±13.9 | 65.7±22.7 | 48.5±18.8 | −17.2±20.8 | .180 | .474 | .341 | .208 |
| Meat | 51.3±7.9 | 14.4±0.9† | −36.9±7.7 | 38.1±13.7 | 48.6±9.9 | 10.5±11.9 | .002 | .312 | .251 | .009 |
| Fish | 58.8±7.2 | 57.4±1.5 | −1.3±6.9 | 73.3±13.9 | 70.9±9.7 | −2.4±13.1 | .941 | .076 | .563 | .161 |
| Legumes | 46.7±5.4 | 67.1±1.6† | 20.4±5.7 | 47.2±8.6 | 31.1±4.7 | −16.0±8.3 | .001 | .376 | .014 | .001 |
| Components of KTD groups (g) | ||||||||||
| Steamed rice | 323.4±27.0 | 629.1±22.3† | 305.7±30.4 | 397.3±41.6 | 467.2±27.7 | 69.9±33.5 | .001 | .492 | .693 | .001 |
| Soup | 295.2±27.0 | 600.3±22.3† | 305.1±30.4 | 328.2±41.6 | 317.4±27.7 | −10.8±13.8 | .001 | .531 | .005 | .001 |
| Kimchi | 88.4±11.7 | 138.1±7.8† | 49.7±10.4 | 83.5±9.4 | 104.2±10.8† | 20.7±8.9 | .042 | .660 | .289 | .089 |
| Soy-based condiments | 26.6±2.5 | 47.9±1.5† | 21.3±2.45 | 30.6±4.1 | 28.6±3.0 | −2.1±3.0 | .001 | .970 | .093 | .001 |
| Vegetables, raw or cooked | 121.5±11.3 | 350.4±7.6† | 228.9±12.6 | 126.7±19.6 | 129.0±10.2 | 2.3±17.5 | .001 | .344 | .001 | .001 |
All values are expressed as means±SE. Boldface indicates statistically significant values (P<.1).
P valuea, t-test between changes of the KTD and control groups; P valueb–d, time, group, and interaction (time×group) effect of two-way repeated-measure ANOVA, after adjusting for age, gender, and weight.
Change=endpoint−baseline.
Paired t-test between baseline and endpoint (P<.05).
Dietary assessment
Table 3 shows that the KTD group consumed about 300 kcal more than the control group, with a higher % energy from carbohydrates (67.1% and 63.4% respectively, P<.001) and from plant lipid intake and significantly lower % energy from animal protein (P<.001).
A significant interaction between time and treatment group was observed in the intake of animal protein, plant protein, animal lipid, plant lipid, fiber, and sodium intake (P<.01). The control group showed no significant changes in intake between before (0 week) and during the intervention period. In contrast, the KTD group increased the intake of vegetables, whole grains, and legumes and decreased that of meat and dairy products during the intervention period. Changes in diet were seen only in the KTD with higher intakes of vegetables and whole grains and lower intakes of fruits, total grain, and dairy products during the intervention period than the control group. For the control group, the intake amounts of KTD showed no significant difference between before study participation and during the intervention period. The KTD group had significantly higher intakes of steamed rice, soup, kimchi, both cooked or uncooked vegetables, and fermented soybean products (all Ps<.001) during intervention than before study participation.
Changes in body weight and components
Body weight and composition data in Table 4 show that after 12 weeks of intervention, the KTD group lost body weight, BMI, body fat mass (kg), % body fat, and waist circumference (P<.05). A significant interaction (time×group) were observed in the body weight, BMI, body fat mass (kg), % body fat, and waist (P<.05).
Table 4.
Change in Cardiovascular Disease Risk Factors in the Intervention Group and Control Group
| KTD group (n=21) | Control group (n=20) | |||||||||
|---|---|---|---|---|---|---|---|---|---|---|
| Daily dietary intake | Baseline | Endpoint | Change* | Baseline | Endpoint | Change* | P valuea | P valueb | P valuec | P valued |
| Anthropometric index | ||||||||||
| Body weight (kg) | 68.8±3.2 | 66.6±3.0† | −2.3±0.7 | 65.7±2.0 | 66.1±2.2 | 0.3±0.4 | .002 | .303 | .011 | .011 |
| BMI (kg/m2) | 25.9±0.9 | 25.0±0.9† | −0.83±0.2 | 25.6±0.7 | 25.7±0.7 | 0.13±0.2 | .002 | .337 | .048 | .009 |
| Body fat mass (kg) | 21.0±1.7 | 18.9±1.6† | −2.1±0.5 | 21.0±1.4 | 21.6±1.4 | 0.6±0.4 | .001 | .969 | .011 | .001 |
| Body fat (%) | 30.0±1.4 | 27.7±1.5† | −2.2±0.6 | 32.0±2.0 | 32.8±2.0 | 0.8±0.5 | .001 | .489 | .006 | .001 |
| Waist (cm) | 92.8±2.3 | 88.9±2.1† | −3.8±0.8 | 91.3±1.7 | 89.7±1.9 | −1.5±0.8 | .050 | .350 | .041 | .044 |
| WHR | 0.98±0.01 | 0.95±0.01† | −0.03±0.01 | 0.96±0.05 | 0.95±0.01† | −0.02±0.01 | .202 | .830 | .432 | .355 |
| Blood pressure | ||||||||||
| SBP (mmHg) | 127.2±2.6 | 128.4±1.4 | 1.2±2.8 | 128.3±3.7 | 127.4±3.4 | −0.9±2.5 | .583 | .453 | .549 | .461 |
| DBP (mmHg) | 71.2±1.2 | 73.4±1.4 | 2.2±1.6 | 75.6.±3.0 | 77.7±2.5 | 2.1.±1.3 | .957 | .294 | .044 | .612 |
| Heart rate (bpm) | 77.2±2.2 | 70.1±2.2† | −7.1±1.8 | 70.6±2.6 | 72.2±2.5 | 1.6±1.9 | .002 | .003 | .018 | .610 |
| Lipid profile index | ||||||||||
| Total cholesterol (mg/dL) | 165.7±10.8 | 141.2±7.8† | −24.4±7.0 | 174.9±9.6 | 161.7±7.2 | −13.2±9.1 | .328 | .652 | .219 | .430 |
| TG (mg/dL) | 100.3±13.3 | 104.4±12.9 | 4.1±11.7 | 132.1±11.2 | 152.4±13.0† | 20.4±8.7 | .277 | .897 | .003 | .277 |
| HDL-C (mg/dL) | 43.8±2.1 | 42.4±2.3 | −1.3±1.6 | 39.3±1.8 | 39.1±2.2 | −0.2±1.8 | .634 | .395 | .300 | .711 |
| LDL-C (mg/dL) | 96.4±10.1 | 78.7±6.6† | −17.7±6.2 | 105.9±9.1 | 95.6±6.2 | −10.3±8.3 | .474 | .612 | .194 | .595 |
| Glycemic control index | ||||||||||
| FPG (mg/dL) | 119.8±7.1 | 113.3±5.5 | −6.5±7.4 | 119.3±6.4 | 117.9±6.6 | −1.4±6.3 | .606 | .752 | .894 | .523 |
| HbA1c (%) | 6.77±0.2 | 6.05±0.15† | −0.72±0.1 | 6.77±0.2 | 6.52±0.20† | −0.25±0.1 | .003 | .440 | .369 | .003 |
| C-peptide (ng/mL) | 2.03±0.2 | 2.02±0.2 | −0.01±0.1 | 2.24±0.2 | 2.45±0.3 | 0.20±0.2 | .368 | .123 | .031 | .540 |
| Fasting insulin (mU/L) | 7.62±1.3 | 8.13±1.2 | 0.52±0.7 | 8.46±1.2 | 8.57±1.1 | 0.11±0.9 | .732 | .068 | .125 | .455 |
| HOMA-IR | 2.51±0.6 | 2.31±0.4 | −0.19±0.4 | 2.45±0.3 | 2.58±0.40 | 0.13±0.4 | .562 | .047 | .326 | .904 |
| HOMA-β | 52.4±7.2 | 74.0±15.9 | 21.6±11.6 | 70.5±13.8 | 72.8±13.6 | 2.24±8.6 | .192 | .863 | .223 | .209 |
All values are expressed as means±SE. Boldface indicates statistically significant values (P<.05).
P valuea, t-test between changes of the KTD and control group; P valueb–d, time, group and interaction (time×group) effect of two-way repeated measure ANOVA, after adjusting for age, gender and weight.
Change=endpoint−baseline.
Paired t-test between baseline and endpoint (P<.05).
WHR, waist–hip ratio; HOMA, homeostasis model assessment; HOMA-IR, HOMA of insulin resistance; HOMA-β, HOMA of pancreatic β-cell function.
The effect on glycemic control factor
The indicators of glycemic control and insulin sensitivity summarized in Table 4 show that HbA1c decreased significantly from 6.77 to 6.05 (P<.003) only in the KTD group. No significant changes were, however, seen in the plasma concentration of glucose, C-peptide, fasting insulin, HOMA-IR or HOMA-β in either group. HbA1c in the KTD group was significantly lower than that of the control group (P<.003); however, there was no statistically significant interactions (time×group). The slightly higher HOMA-β, an indicator of insulin sensitivity, was not statistically significant.
The effects on blood pressure
No changes in blood pressure were observed in the control group before and during intervention. The KTD group, however, showed a significant reduction in heart pulse compared to the control group (P<.002), with no changes in SBP and DBP.
The effects on lipid profile
As shown in Table 4, total serum cholesterol and LDL-C decreases in the KTD group from baseline to the intervention period; endpoints were −24.2 and −17.7, respectively, in the KTD group compared with −13.2 and −10.3, respectively, in the control group. A significant difference in the TG (P<.003) level was observed between the two groups, whereas no significant interaction (time×group) was found in triglyceride (TG) levels.
Discussion
We hypothesized that the consumption of KTD would contribute to the management of diabetes and hypertension when combined with standard medications. We observed that the consumption of KTD, in contrast to contemporary diets in Korea (control group), for 12 weeks improved blood pressure, glycemic control, and CVD risk factors. At the end of the study, the KTD group had significantly lower anthropometric indicators, including body weight, BMI, body fat mass, body fat (%), waist–hip ratio, and waist circumference and significantly better HbA1c and HR than the control group. Moreover, retrospective studies confirmed that if the KTD pattern is adhered to, the disease risks of obesity,12,19,20 T2D,5 CVD,33 and MS12,22,24 are decreased; also, high consumptions of red and processed meat have been associated with the increase of coronary heart disease, T2D, and MS.10,21 Our study also confirmed that the high carbohydrate diet including steamed rice for three meals per day using whole grains and the high rate of continuous side dishes with plenty of plant foods were features of the KTD,6,7 and their intakes contributed to controlling diabetes, obesity, and hypertension risk.
The risk for stroke and myocardial infarction (MI) increases with the risk for hypertension. The KTD group had lower DBP at week 4 of the intervention, whereas the control group experienced higher DBP at week 4 compared to those at the baseline. These changes along with decreased TG in the KTD group can decrease the risk for atherosclerosis. Also, the decreased HR along with DBP in the KTD group can reduce the risks for MI and hypertension indirectly.
Several recent studies reported that if whole grain, legumes, vegetables, low fat dairy, and fish, which are major components of the Mediterranean style18,34–36 and dietary approaches to stop hypertension (DASH), were consumed abundantly, SBP and DBP were lowered,37,38 and MS39 and impaired glucose tolerance40 were improved. It is possible that whole grain intake and vegetables has a strongly effective impact on decreasing abdominal obesity, insulin resistance, dyslipidemia, and the incidence of MS.
In the KTD group, cardiovascular risk factors, such as HR, TG, HbA1c, and obesity index, were improved. We assert that the health benefits of KTD are partially due to the high content of whole grains, fermented soy products, and kimchi, all of which are high in dietary fiber. Schulze et al.41 reported that the prevalence of diabetes is inversely associated with intake of whole grains that are rich in dietary fiber, and also, dietary fiber intake improved controlling blood glucose in T2D patients.42 When a KTD that is rich in whole grains and dietary fiber is consumed, blood glucose peak and AUC, (area under the curve) are maintained at lower levels and thus HbA1c levels are low43 and HR remains low due to a controlled autonomic nervous system.
Adherence to the Mediterranean diet did not produce enough evidence to support its efficacy against T2D and HbA1c levels,16 but our results found that KTD dietary patterns may decrease HbA1c when rich in whole grain rice, fermented foods, and fiber. Recently, studies have shown that HbA1c is a high risk factor and predictor of morbidity and mortality due to CVD.44,45
Fermented soy products are rich in aglycon forms of isoflavone, such as genistein and daidzein. Several investigators46–48 have reported that genistein and daidzein stimulate β-oxidation of fatty acids and thus decrease visceral adipose tissue, conversion of cholesterol to bile acid that can be excreted, and inhibition of de novo synthesis of cholesterol and progression of atherosclerosis by inhibiting tyrosine kinase activities. Capsaicin, which is rich in the red pepper paste called gochujang in the KTD, has also been reported to increase metabolic rate and reduce the accumulation of visceral fat.49,50 We also assert that fermented soy products, which are rich in the KTD may explain a part of the health benefits that we observed with KTD in our study.
Kim et al.51 reported that kimchi was effective for reducing weight, body fat, blood pressure, fasting blood glucose, and blood cholesterol in obese individuals. These effects were more prominent following the consumption of fermented kimchi than nonfermented kimchi. These health benefits of kimchi have been explained by its content of capsaicin, probiotics, and dietary fiber that control insulin resistance.52 We suspect that kimchi in KTD explains part of the anti-obesogenic and blood glucose controlling effects.
High dietary fiber intake has been reported to be effective for preventing CVD by decreasing risk factors for T2D and obesity.53 In our study, dietary fiber intake did not change in the control group between the beginning and end of the study. In contrast, dietary fiber intake of the KTD group increased by 22 g more than that of the control and is speculated to be partially responsible for the positive health outcomes. Interestingly, the KTD group in the present study consumed 1883 kcal/day, which is about 335 kcal/day higher during intervention than at the baseline. However, the KTD group showed a decrease in BMI, body fat mass, and body fat. We speculate that three regular meals with brown rice, fermented soy bean products, and large amount of plant-based food increased the metabolic function.
Isoflavones in soy and fermented soy products have been reported to prevent the accumulation of body fat and visceral fat,46,47 and capsaicin in kimchi51,52 and gochujang49,50 has been reported to increase the metabolic rate and reduce the accumulation of visceral fat. The KTD group consumed about 20.4 g soy, 21.3 g fermented soy products, and 49.7 g kimchi, which were significantly more than the control group. We assert that the isoflavones in fermented soy products increased partially the metabolic function. Furthermore, fermentation of dietary fiber by gut flora produces short-chain fatty acids, which activate GPR43 and thus control insulin-mediated accumulation of adipose tissue while increasing energy expenditure.54,55 We speculate that the increased dietary fiber intake by 21.8 g/day in the KTD group during the intervention period increased energy expenditure and reduced body fat accumulation that led to abdominal obesity and weight gain.
In this study, a direct effect on blood pressure decrease could not be confirmed. However, interestingly, the KTD group was lower in HR than the control group. Blood pressure is usually determined by cardiac output and peripheral resistance, but more often by peripheral resistance. Cardiac output is determined by HR and stroke volume (HR×stroke volume). Since the parasympathetic vagus nerve is innervated in the atrium only, HR can be decreased without affecting ventricular contractility directly.56 When HR decreases, cardiac filling time and consequently the stroke volume increases. This is due to the increase in systolic contraction following Frank-Starling's law.57 The decrease in HR in the KTD group with increased diastolic coronary perfusion time is expected to decrease the risk for MI caused by hypertension.
The limitations of this study may include the following: The control group was not provided a strict “controlled diet” per se nor monitored closely for their dietary intake as was done for the KTD group. The KTD group consumed foods that were carefully prepared while visiting the Clinical Trial Center every day for 12 weeks. This could have potentially led to different levels of physical activities between the two groups. The results of the present study differ from those of preceding studies in which high carbohydrate diets were adversary to glycemic control. Future follow-up studies need to consider increasing sample sizes and monitoring of the diet and all other lifestyle factors in depth for the control group.
Regular consumption of KTD for 12 weeks by hypertensive and diabetic patients resulted in favorable changes in glycemic control, body composition, HR, and CVD risk factors. We conclude that hypertensive and diabetic patients will benefit from consuming regularly meals following the KTD pattern along with medications, regular exercise, and healthy lifestyles to reduce the risks related to the long-term CVD.
Acknowledgments
This work was supported by grants from the Ministry for Food, Agriculture, Forestry and Fisheries, Korean Food Foundation (2010-2011-01). All authors participated in this work with their substantive contributions. S.-J.J. carried out the article preparation and statistical analyses. S.-H.P., E.-K.C., B.-H.C., Y.-G.K., M.-G.K., B.-O.S., T.-S.P., and J.-K.K. had the responsibility of data collection and interaction with the subjects for the RCT projects. S.-W.C., W.O.S., and Y.-S.C. participated in biochemical analysis, interpretation of data, and review of the article.
Author Disclosure Statement
None of the authors have conflicts of interest.
References
- 1.Isomaa B, Almgren P, Tuomi T, et al. : Cardiovascular morbidity and mortality associated with the metabolic syndrome. Diabetes Care 2001;24:683–689 [DOI] [PubMed] [Google Scholar]
- 2.Potenza MV, Mechanick JI: The metabolic syndrome: definition, global impact, and pathophysiology. Nutr Clin Pract 2009;24:560–577 [DOI] [PubMed] [Google Scholar]
- 3.Ford ES, Giles WH, Dietz WH: Prevalence of the metabolic syndrome among US adults: findings from the third National Health and Nutrition Examination Survey. JAMA 2002;287:356–359 [DOI] [PubMed] [Google Scholar]
- 4.Lim S, Shin H, Song JH, et al. : Increasing prevalence of metabolic syndrome in Korea: the Korean National Health and Nutrition Examination Survey for 1998–2007. Diabetes Care 2011;34:1323–1328 [DOI] [PMC free article] [PubMed] [Google Scholar]
- 5.Lim JH, Lee YS, Chang HC, Moon MK, Song Y: Association between dietary patterns and blood lipid profiles in Korean adults with type 2 diabetes. J Korean Med Sci 2011;26:1201–1208 [DOI] [PMC free article] [PubMed] [Google Scholar]
- 6.Lee SK, Sobal J: Socio-economic, dietary, activity, nutrition and body weight transitions in South Korea. Public Health Nutr 2003;6:665–674 [DOI] [PubMed] [Google Scholar]
- 7.Kim S, Moon S, Popkin BM: The nutrition transition in South Korea. Am J Clin Nutr 2000;71:44–53 [DOI] [PubMed] [Google Scholar]
- 8.Kim DJ, Kim HM, Park SW, et al. : Trends in the prevalence and management status of diabetes in Korea: Korean National Health and Nutrition Examination Survey. Diabetes Res Clin Pract 2008;79:S21–S22 [Google Scholar]
- 9.Mann JI, De Leeuw I, Hermansen K, et al. : Evidence-based nutritional approaches to the treatment and prevention of diabetes mellitus. Nutr Metab Cardiovasc 2004;14:373–394 [DOI] [PubMed] [Google Scholar]
- 10.van Dam RM, Rimm EB, Willett WC, Stampfer MJ, Hu FB: Dietary patterns and risk for type 2 diabetes mellitus in US men. Ann Intern Med 2002;136:201–209 [DOI] [PubMed] [Google Scholar]
- 11.Zhao GX, Ford ES, Li CY, Mokdad AH: Weight control behaviors in overweight/obese US adults with diagnosed hypertension and diabetes. Cardiovasc Diabetol 2009;8:13. [DOI] [PMC free article] [PubMed] [Google Scholar]
- 12.Song Y, Joung H: A traditional Korean dietary pattern and metabolic syndrome abnormalities. Nutr Metab Cardiovasc Dis 2012;22:456–462 [DOI] [PubMed] [Google Scholar]
- 13.Lee MJ, Popkin BM, Kim S: The unique aspects of the nutrition transition in South Korea: the retention of healthful elements in their traditional diet. Public Health Nutr 2002;5:197–203 [DOI] [PubMed] [Google Scholar]
- 14.Leibbrandt AJ, Kiefte-de Jong JC, Hogenelst MHE, Snoek FJ, Weijs PJM: Effects of the PRo-active Interdisciplinary Self-MAnagement (PRISMA, Dutch DESMOND) program on dietary intake in type 2 diabetes outpatients: a pilot study. Clin Nutr 2010;29:199–205 [DOI] [PubMed] [Google Scholar]
- 15.Amini M, Esmaillzadeh A, Shafaeizadeh S, Behrooz J, Zare M: Relationship between major dietary patterns and metabolic syndrome among individuals with impaired glucose tolerance. Nutrition 2010;26:986–992 [DOI] [PubMed] [Google Scholar]
- 16.Diez-Espino J, Buil-Cosiales P, Serrano-Martinez M, Toledo E, Salas-Salvado J, Martinez-Gonzalez MA: Adherence to the Mediterranean Diet in Patients with Type 2 Diabetes Mellitus and HbA1c Level. Ann Nutr Metab 2011;58:74–78 [DOI] [PubMed] [Google Scholar]
- 17.Ferrara LA, Ricci F, Viola S, et al. : Dietary pattern and blood pressure control in a hypertension outpatient clinic. Hypertens Res 2007;30:1043–1050 [DOI] [PubMed] [Google Scholar]
- 18.Rumawas ME, Meigs JB, Dwyer JT, McKeown NM, Jacques PF: Mediterranean-style dietary pattern, reduced risk of metabolic syndrome traits, and incidence in the Framingham Offspring Cohort. Am J Clin Nutr 2009;90:1608–1614 [DOI] [PMC free article] [PubMed] [Google Scholar]
- 19.Cho YA, Shin A, Kim J: Dietary patterns are associated with body mass index in a Korean Population. J Am Diet Assoc 2011;111:1182–1186 [DOI] [PubMed] [Google Scholar]
- 20.Song Y, Park MJ, Paik HY, Joung H: Secular trends in dietary patterns and obesity-related risk factors in Korean adolescents aged 10–19 years. Int J Obesity 2010;34:48–56 [DOI] [PubMed] [Google Scholar]
- 21.Pettersen B, Anousheh R, Fraser G: Dietary pattern, blood pressure and hypertension. Results from the Adventist Health Study-2. Am J Epidemiol 2010;171:S76–S76 [Google Scholar]
- 22.Kim J, Jo I: Grains, vegetables, and fish dietary pattern is inversely associated with the risk of metabolic syndrome in South Korean adults. J Am Diet Assoc 2011;111:1141–1149 [DOI] [PubMed] [Google Scholar]
- 23.Shin A, Lim SY, Sung J, Shin HR, Kim J: Dietary intake, eating habits, and metabolic syndrome in Korean men. J Am Diet Assoc 2009;109:633–640 [DOI] [PubMed] [Google Scholar]
- 24.Cho YA, Kim J, Cho ER, Shin A: Dietary patterns and the prevalence of metabolic syndrome in Korean women. Nutr Metab Cardiovasc 2011;21:893–900 [DOI] [PubMed] [Google Scholar]
- 25.Kim J, Jo I, Joung H: A rice-based traditional dietary pattern is associated with obesity in Korean adults. J Acad Nutr Diet 2012;112:246–253 [DOI] [PubMed] [Google Scholar]
- 26.Boucher JL, Evert A, Daly A, et al. : American dietetic association revised standards of practice and standards of professional performance for registered dietitians (generalist, specialty, and advanced) in diabetes care. J Am Diet Assoc 2011;111:156–166 [DOI] [PubMed] [Google Scholar]
- 27.Hong JS, Kang HC, Kim J: Continuity of care for elderly patients with diabetes mellitus, hypertension, asthma, and chronic obstructive pulmonary disease in Korea. J Korean Med Sci 2010;25:1259–1271 [DOI] [PMC free article] [PubMed] [Google Scholar]
- 28.Lee KW, Cho MS: The development and vailidation of the Korean Dietary Pattern Score (KDPS). Korean J Food Culture 2010;25:652–660 [Google Scholar]
- 29.The Korean Nutrition Society: Dietary Reference Intakes for Koreans Seoul, Korea, 2010 [Google Scholar]
- 30.Korean Diabetes Association: Treatment Guideline for Diabetes (4th revision) Seoul, Korea, 2011, pp. 52–56 [Google Scholar]
- 31.Ministry of Health and Welfare: Analysis of the 5th Korea National Health and Nutrition Examination Survey (KNHANES 5th). Seoul, Korea, 2011 [Google Scholar]
- 32.Ramos-Zavala MG, Gonzalez-Ortiz M, Martinez-Abundis E, Robles-Cervantes JA, Gonzalez-Lopez R, Santiago-Hernandez NJ: Effect of diacerein on insulin secretion and metabolic control in drug-naive patients with type 2 diabetes: a randomized clinical trial. Diabetes Care 2011;34:1591–1594 [DOI] [PMC free article] [PubMed] [Google Scholar]
- 33.Park SH, Lee KS, Park HY: Dietary carbohydrate intake is associated with cardiovascular disease risk in Korean: Analysis of the third Korea National Health and Nutrition Examination Survey (KNHANES III). Int J Cardiol 2010;139:234–240 [DOI] [PubMed] [Google Scholar]
- 34.Esposito K, Ciotola M, Giugliano D: Mediterranean diet and the metabolic syndrome. Mol Nutr Food Res 2007;51:1268–1274 [DOI] [PubMed] [Google Scholar]
- 35.Babio N, Bullo M, Basora J: Adherence to the Mediterranean diet and risk of metabolic syndrome and its components. Nutr Metab Cardiovasc Dis 2009;19:563–570 [DOI] [PubMed] [Google Scholar]
- 36.Richard C, Couture P, Desroches S, Charest A, Lamarche B: Effect of the Mediterranean diet with and without weight loss on cardiovascular risk factors in men with the metabolic syndrome. Nutr Metab Cardiovasc Dis 2011;21:628–635 [DOI] [PubMed] [Google Scholar]
- 37.Fung TT, Chiuve SE, McCullough ML, Rexrode KM, Logroscino G, Hu FB: Adherence to a DASH-style diet and risk of coronary heart disease and stroke in women. Arch Intern Med 2008;168:713–720, errata 168:1276 [DOI] [PubMed] [Google Scholar]
- 38.de Paula TP, Steemburgo T, de Almeida JC, Dall'alba V, Gross JL, de Azevedo MJ: The role of dietary approaches to stop hypertension (DASH) diet food groups in blood pressure in type 2 diabetes. Br J Nutr 2012;108:155–162 [DOI] [PubMed] [Google Scholar]
- 39.Shenoy SF, Poston WS, Reeves RS, et al. : Weight loss in individuals with metabolic syndrome given DASH diet counseling when provided a low sodium vegetable juice: a randomized controlled trial. Nutr J 2010;9:8. [DOI] [PMC free article] [PubMed] [Google Scholar]
- 40.Liese AD, Nichols M, Sun XZ, D'Agostino RB, Haffner SM: Adherence to the DASH diet is inversely associated with incidence of type 2 diabetes: the insulin resistance atherosclerosis study. Diabetes Care 2009;32:1434–1436 [DOI] [PMC free article] [PubMed] [Google Scholar]
- 41.Schulze MB, Schulz M, Heidemann C, Schienkiewitz A, Hoffmann K, Boeing H: Fiber and magnesium intake and incidence of type 2 diabetes: a prospective study and meta-analysis. Arch Intern Med 2007;167:956–965 [DOI] [PubMed] [Google Scholar]
- 42.Chandalia M, Garg A, Lutjohann D, von Bergmann K, Grundy SM, Brinkley LJ: Beneficial effects of high dietary fiber intake in patients with type 2 diabetes mellitus. N Engl J Med 2000;342:1392–1398 [DOI] [PubMed] [Google Scholar]
- 43.Lee C, Shin J: Effects of different fiber content of rice on blood glucose and triglyceride levels in normal subject. J Korean Soc Food Sci Nutr 2002;31:1048–1051 [Google Scholar]
- 44.Syed IAA, Khan WA: Glycated haemoglobin—a marker and predictor of cardiovascular disease. J Pak Med Assoc 2011;61:690–695 [PubMed] [Google Scholar]
- 45.Seitz P, Rosemann T, Gensichen J, Huber CA: Interventions in primary care to improve cardiovascular risk factors and glycated haemoglobin (HbA1c) levels in patients with diabetes: a systematic review. Diabetes Obes Metab 2011;13:479–489 [DOI] [PubMed] [Google Scholar]
- 46.Kwak CS, Park SC, Song KY: Doenjang, a fermented soybean paste, decreased visceral fat accumulation and adipocyte size in rats fed with high fat diet more effectively than nonfermented soybeans. J Med Food 2012;15:1–9 [DOI] [PubMed] [Google Scholar]
- 47.Cha YS, Yang JA, Back HI, et al. : Visceral fat and body weight are reduced in overweight adults by the supplementation of doenjang, a fermented soybean paste. Nutr Res Pract 2012;6:520–526 [DOI] [PMC free article] [PubMed] [Google Scholar]
- 48.Back HI, Kim SR, Yang JA, Kim MG, Chae SW, Cha YS: Effects of chungkookjang supplementation on obesity and atherosclerotic indices in overweight/obese subjects: a 12-week, randomized, double-blind, placebo-controlled clinical trial. J Med Food 2011;14:532–537 [DOI] [PubMed] [Google Scholar]
- 49.Koo B, Seong SH, Kown DY, Sohn HS, Cha YS: Fermented kochujang supplement shows anti-obesity effects by controlling lipid metabolism in C57BL/6J mice fed high fat diet. Food Sci Biotechnol 2008;17:336–342 [Google Scholar]
- 50.Cha YS, Kim SR, Yang JA, et al. : Kochujang, fermented soybean-based red pepper paste, decreases visceral fat and improves blood lipid profiles in overweight adults. Nutr Metab 2013;10:24. [DOI] [PMC free article] [PubMed] [Google Scholar]
- 51.Kim EK, An SY, Lee MS, et al. : Fermented kimchi reduces body weight and improves metabolic parameters in overweight and obese patients. Nutr Res 2011;31:436–443 [DOI] [PubMed] [Google Scholar]
- 52.An SY, Lee MS, Jeon JY, et al. : Beneficial effects of fresh and fermented kimchi in prediabetic individuals. Ann Nutr Metab 2013;63:111–119 [DOI] [PubMed] [Google Scholar]
- 53.Cho SS, Qi L, Fahey GC, Klurfeld DM: Consumption of cereal fiber, mixtures of whole grains and bran, and whole grains and risk reduction in type 2 diabetes, obesity, and cardiovascular disease. Am J Clin Nutr 2013;98:594–619 [DOI] [PubMed] [Google Scholar]
- 54.Kimura I, Ozawa K, Inoue D, et al. : The gut microbiota suppresses insulin-mediated fat accumulation via the short-chain fatty acid receptor GPR43. Nat Commun 2013;4:1829. [DOI] [PMC free article] [PubMed] [Google Scholar]
- 55.Tolhurst G, Heffron H, Lam YS, et al. : Short-chain fatty acids stimulate glucagon-like peptide-1 secretion via the G-protein-coupled receptor FFAR2. Diabetes 2012;61:364–371 [DOI] [PMC free article] [PubMed] [Google Scholar]
- 56.Guyton AC, Hall JE: Nervous regulation of the circulation, and rapid control of arterial pressure (parasympathetic control of heart function, especially heart). In: Textbook of Medical Physiology. Elsevier Saunders, Philadelphia, PA, USA, 2004, pp. 204–205 [Google Scholar]
- 57.Fukuda N, Granzier H: Role of the giant elastic protein titin in the Frank-Starling mechanism of the heart. Curr Vasc Pharmacol 2004;2:135–139 [DOI] [PubMed] [Google Scholar]