

Abstract
Nitric oxide is a pro-natriuretic and pro-diuretic factor. The highest renal nitric oxide synthase (NOS) activity is found in the inner medullary collecting duct (IMCD). The collecting duct (CD) is the site of daily fine-tune regulation of sodium balance, and led us to hypothesize that a CD specific deletion of NOS1 would result in an impaired ability to excrete a sodium load leading to a salt-sensitive blood pressure phenotype. We bred AQP2-CRE mice with NOS1 floxed mice to produce flox control and CD-specific NOS1 knockout (CDNOS1KO) littermates. Collecting ducts from CDNOS1KO mice produced 75% less nitrite and urinary nitrite+nitrate (NOx) excretion was significantly blunted in the knockout genotype. When challenged with high dietary sodium, CDNOS1KO mice showed significantly reduced urine output, sodium, chloride and NOx excretion, and increased mean arterial pressure relative to flox control mice. In humans, urinary NOx is a newly identified biomarker for the progression of hypertension. These findings reveal that NOS1 in the CD is critical in the regulation of fluid-electrolyte balance, and this new genetic model of CD NOS1 gene deletion will be a valuable tool to study salt-dependent blood pressure mechanisms.
Keywords: NOS1, Collecting Duct, Blood pressure, Salt-sensitivity, Sodium excretion
Introduction
Understanding renal control of sodium excretion is not only important for management of fluid-electrolyte disorders, but perhaps as important, is critical for elucidating defects in a wide array of diseases such as hypertension and diabetes. Clinically, hypertensive patients have reduced urinary NO metabolite excretion (NOx, nitrite+nitrate, a measure of NO production) compared to age-matched normotensive patients1–3. Furthermore, it was recently determined that urinary NOx excretion is a biomarker for predicting the progression of hypertension in normotensive men4.
NO is produced during the conversion of L-arginine to L-citrulline by NO synthase (NOS). In the rat kidney, the inner medullary collecting duct (IMCD) has the highest total NOS activity5 as well as expressing NOS1 (neuronal NOS; nNOS) and NOS3 (endothelial NOS; eNOS)5–7. Infusion of NOS1 anti-sense oligonucleotides or a NOS1 specific inhibitor, 7-nitroindazole, into the renal medulla of rats on a high salt diet resulted in an approximate 15 mmHg increase in mean arterial pressure8, thus highlighting the importance of renal NOS1 signaling in blood pressure control. By using rodent models, the physiology and mechanisms of the renal NOS/NO system in the regulation of blood pressure can be elucidated.
The NOS1 gene is complex, with multiple promoters, first exons, and start codons, as shown in humans9–11 and rodents12–15. At least three NOS1 protein splice variants are expressed in the rat kidney14,15 and mouse brain12,13. These have been termed NOS1α (the full-length protein), NOS1β and NOS1γ, which have truncated N-termini compared with NOS1α12,13. Purified NOS1β has about 80% the activity of NOS1α while NOS1γ only has 3% of the activity12. In the commercially available NOS1KO mouse, the NOS1 gene was targeted for deletion in exon 2, an exon only expressed in NOS1α (Figure S1). Surprisingly, this NOS1αKO mouse is normotensive, even on a high salt diet16. A total NOS1 gene knockout mouse, generated by targeting exon 6 for deletion, with exon 6 being conserved among the NOS1 splice variants17. These mice have a severe phenotype, whereby they are infertile with hypogonadism, and only survive on a liquid diet 17. Currently these mice have not been studied with regard to renal excretory function or blood pressure control.
Tissue or cell-specific gene knockout mice using the Loxp/Cre system18–21 have been instrumental in our understanding of cell signaling. Aquaporin-2 (AQP2) is exclusively expressed in the renal collecting duct (CD) principal cells, vas deferens, and seminiferous tubules within testis22. Studies using AQP2-Cre positive mice have been helpful in our understanding of renal CD physiology and pathophysiology23–25. We hypothesized that deletion of all the NOS1 variants in the CD will lead to a defect in salt handling and blood pressure regulation. To test our hypothesis, we generated CD principal cell NOS1 KO mice (CDNOS1KO) using the flox exon 6 NOS1/AQP2-Cre system. Deletion of NOS1 in the CD results in a rightward shift of the pressure natriuresis relationship when challenged with a high salt diet, thus displaying a salt-sensitive blood pressure phenotype. We have identified a novel and necessary physiological function for NOS1 in the CD in fluid-electrolyte homeostasis, and blood pressure regulation.
Methods
All animal breeding, housing, and protocols were approved by the Institutional Animal Care and Use Committee in facilities accredited by American Association for the Accreditation of Laboratory Animal Care at Georgia Regents University.
Generation of the CDNOS1KO mouse
NOS1αKO mice and wild type (WT; C57BL/6J) control mice were purchased from Jackson Laboratories (Bar Harbor, ME). Transgenic mice were bred as previously described26. In short, male homozygous NOS1 exon 6 flox mice17 were mated with hemizygous, AQP2-Cre female mice. Female offspring that were AQP2-Cre positive and heterozygous for NOS1 floxed transgene were then mated with homozygous NOS1 floxed male mice17. Female offspring from this mating which were homozygous for the flox NOS1 transgene and AQP2-Cre positive were then mated with homozygous NOS1 floxed male mice to produce 50% homozygous NOS1 flox transgene/AQP2-Cre positive (i.e. CDNOS1KO mouse) or only homozygous NOS1 flox transgene (flox control mouse). The genotyping protocol can be found in the Data Supplement.
Tissue and collecting duct isolation
Inner medullae and cerebella were dissected from wild type and NOS1αKO mice for Western blotting analyses. IMCDs were isolated as previously described27. Isolated CDs were immediately processed for Western blotting or incubated with Hank’s Balanced Salt solution + 250 μM L-arginine + 200U/ml superoxide dismutase for 1 h for nitrite measurements. Western blots were performed as previously described6, and antibodies are listed in Table S1.
Dietary salt intervention
After weaning, animals were provided normal salt (Na = 0.3%, NaCl = 0.4%) standard pellet chow (Teklad, Madison, WI). For histological analyses, mice were fed a normal or high salt (Na = 1.6%, NaCl = 4.0%) standard pellet chow diet for 7 days (Teklad). For metabolic cage studies, in order to prevent pellet chow contamination of urine, mice were fed a gel diet (Micro stabilized Rodent Liquid Diet, TestDiet, Richmond, IN) plus 6.3% agar, with a normal salt (0.24 g NaCl/ 100 g food, thus Na = 0.12% or NaCl = 0.24%) and water ad libitium. During the low salt intervention, mice were fed the same gel diet but with 0.005g NaCl /100g (Na = 0.0025% or NaCl = 0.005%) food for 7 days, and then changed to a high salt (2.4 g NaCl/ 100g food, thus Na = 1.2% or NaCl = 2.4%) and water ad libitium for 7 days. All experiments were performed on male animals, 10–16 weeks old, with the average mass for the flox control mice was 28.8 ± 0.73 g and 29.2 ± 1.1 g for the CDNOS1KO mice.
Blood pressure and Metabolic Cages
Telemetry devices (Data Sciences, PA-C10, St. Paul, MN) were implanted into the left carotid artery of isoflurane anesthetized mice. Mice were allowed 10 days to recover before collection of telemetry data. For metabolic studies, mice were acclimatized in the cages for 3 days prior to measurements. Mice had access to water ad libitium while in the metabolic cages. Urine was collected twice daily (12 hr collection periods) under sterile, water-saturated mineral oil, from mice on normal salt (NS) diet for 6 days, followed by low salt (LS) diet for 6 days, and then 6 days of high salt (HS) diet. Urine was centrifuged at 1000 g for 5 min, aliquoted and stored at −80°C until further analysis.
Urinary NOx, albumin, PGE metabolite, ion excretion, and CD nitrite production
Nitrite and nitrate (NOx) concentration in urine and nitrite in the HBSS from the CD incubations was analyzed using the E-NO20 HPLC system (Eicom, Kyoto, Japan) as previously described28. Albumin concentration was determined by ELISA (Exocell, Philadelphia, PA). Urinary PGE metabolites were measured by PGE metabolite-enzyme immunoassay following manufacturer’s instruction (Cayman Chemcial, Ann Arbor, MI). Urinary potassium and chloride concentration rates were determined by ion selective electrode (MedicaEasylyte, Bedford, MA), sodium by the Analyst 200 Atomic Absorption Spectrometer (Perkin Elmer, Waltham, MA), and osmolality by the Micro-Osmometer 3300 (Advanced Instruments, Norwood, MA).
Histology and immunohistochemistry
Five kidney sections, of 5 μm thickness, per animal were analyzed as previously described6. Kidney sections were stained with Gomori’s Blue trichrome (Richard Allan Scientific, Kalamazoo, MI) or hematoxylin and eosin. An expert mouse renal pathologist, blinded to the genotype of the mice, analyzed kidneys for renal structural anomalies. For immunohistochemical analyses, detection of NOS1, CD3 and F4/80 was accomplished by incubating the tissue sections overnight at 4°C (Table S1). Immunoreactivity was visualized with the Olympus BX40 microscope, affixed with an Olympus DP70 camera. Full kidney section scans were obtained from a PathScan Enabler IV (Meyer Instruments, Houston, TX). Brightness and contrast of the images was adjusted with Microsoft PowerPoint (v. 12.1.5).
Statistics
All data are expressed as Mean ± SEM. When assessing the effect of diet on the flox and CDNOS1KO mice, two-way ANOVA was performed (diet and genotype), followed by one-Factor ANOVA and Tukey’s post hoc test. Comparison of CD nitrite production or urinary NOx excretion on a NS diet was evaluated with unpaired, two-tailed, Student’s t-Test. P> 0.05 was considered significant.
Results
NOS1 expression
NOS1 splice variants are formed through alternative splicing of exon 2 (Figure S1). This alternative splicing results in truncation of the N-terminus; however the C-termini are 100% identical12. Thus, tissue and cellular distribution of these variants can be distinguished by using N-terminus specific NOS1 antibodies, which detects only NOS1α, versus C-terminus specific NOS1 antibodies, which detects all splice variants. To characterize NOS1 expression, inner medulla (IM) and cerebellum were homogenized, and immunoblotted with C-terminus anti-NOS1 antibody. Specificity of the C-terminus NOS1 immunoreactivity was confirmed by peptide antigen blockade of the antibody (Figure S2). The WT mouse cerebellum homogenate expressed a predominant immunoreactive band at 155 kD, which was not present in the cerebellum homogenate from the NOS1αKO mouse. In the homogenate from IM of WT miceas well as NOS1αKO mice, a NOS1 variant of 130 kD was observed (Figure 1A). These bands correspond to NOS1α (155 kD) and NOS1β (130 kD)12. The 130 kD band in the IM homogenate was distinct from the NOS3-specific band of 135 kD (Figure 1B). Finally, from a Western blot of freshly isolated IMCDs from WT and NOS1αKO mice, we found expression of the NOS1β splice variant exclusively (Figure 1C).
Figure 1.
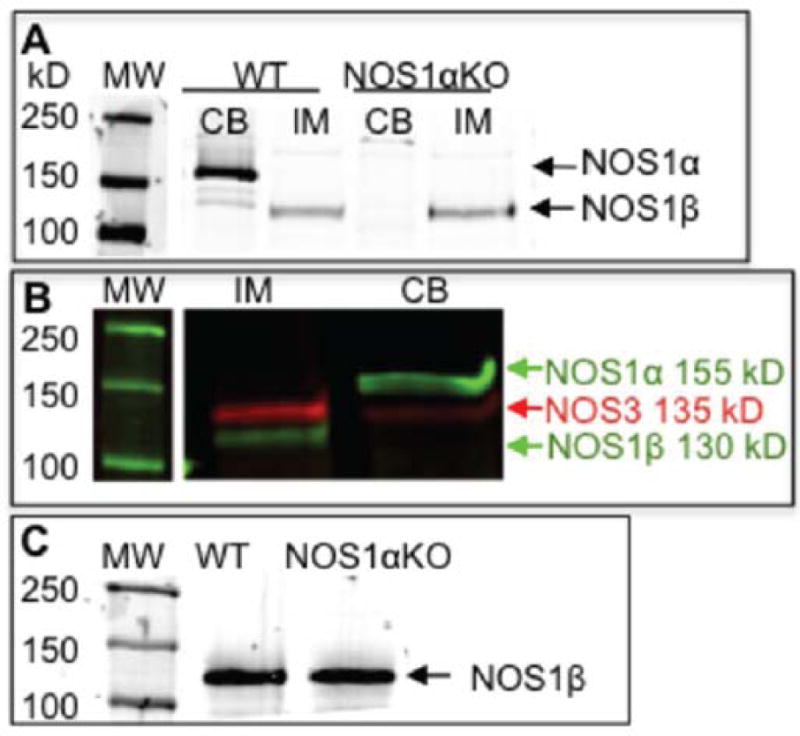
NOS1 splice variant expression of the inner medulla (IM) and cerebellum (CB) from wild type mouse (WT) and NOS1αKO mouse as determined by Western blotting with anti-NOS1 (C-terminus). (A) NOS1α is expressed in the cerebellum of the WT mouse but is not in the cerebellum of NOS1αKO mice. NOS1β is expressed in the IM of WT and NOS1αKO mice. The molecular weight marker (MW) was run on the same gel, but it was noncontiguous. (B) NOS1β and NOS3 co-expressed in the IM and NOS1α and NOS3 co-expressed in the cerebellum of the WT mouse. The molecular weight marker (MW) was run on the same gel, but it was noncontiguous. (C) Collecting duct expression of NOS1β in the WT and NOS1αKO mice.
Confirmation of deletion of NOS1 from the collecting duct
We isolated CDs from flox control and CDNOS1KO mice and found NOS1β expression in the flox control mice, but none in the CDNOS1KO mice (Figure 2A). Moreover, freshly isolated IMCDs from CDNOS1KO mice on a NS diet produced ~75% less nitrite than flox control mice (P = 0.003, n = 3) (Figure 2B), and CDNOS1KO mice excrete ~50% nitrite/nitrate (NOx) compared to flox mice (P< 0.01, n = 13) (Figure 2C).
Figure 2.
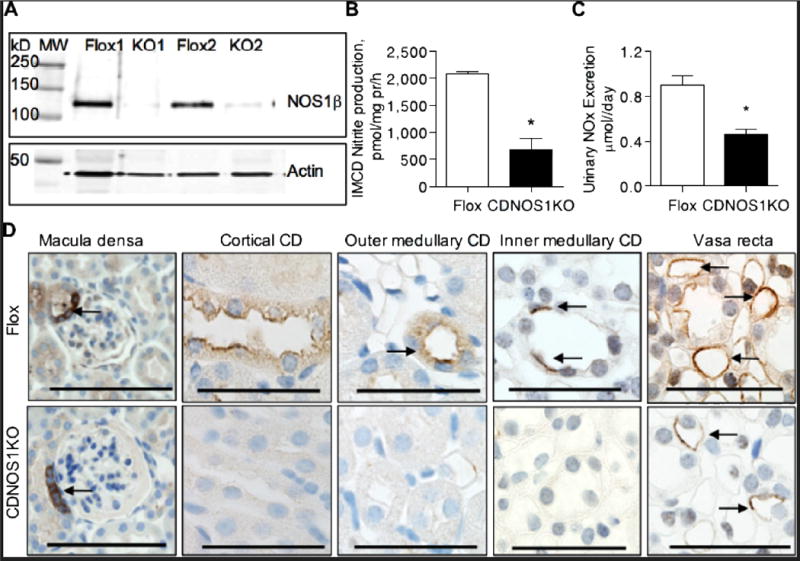
NOS1 is absent in the principal cells of the collecting duct (CD) of the CDNOS1KO mouse. (A) Representative immunoblot of isolated CDs from flox and CDNOS1KO mice labeled with anti-C-terminus NOS1 (top) and β-actin (bottom). (B) Freshly isolated inner medullary CDs (IMCD) from CDNOS1KO mice produce 75% less nitrite than IMCDs from flox control mice (N = 3). (C) Urinary nitrite/nitrate (NOx) excretion is reduced in the CDNOS1KO mouse on a normal salt diet (N = 13). (D) Representative micrographs of kidneys from flox control and CDNOS1KO mice. NOS1 was expressed in the macula densa, cortical CD, outer medullary CD (OMCD), IMCD and vasa recta of the flox mouse. No CDs were immunoreactive for NOS1 in the CDNOS1KO mouse. Anti-C terminus NOS1 antibodies were utilized. Arrows point to NOS1 positive structures. Scale bar = 50 μm. * P < 0.05.
NOS1 gene deletion from the CD was also confirmed by immunohistochemistry. As seen in Figure 2D, NOS1 positive immunostaining is apparent in the macula densa and vasa recta from both flox control and CDNOS1KO mice. In addition, we observed positive NOS1 immunostaining in cortical CDs, outer medullary CDs (OMCD) and IMCD in flox control with no apparent staining in cortical CDs, OMCDs, and IMCDs in CDNOS1KO mice (Figure 2D).
Effects of CD NOS1 deletion on the kidney
No obvious renal structural pathologies were noted in the CDNOS1KO mice and papilla development was normal (Figure 3A, 3B, 3C). Glomeruli and tubules all appeared normal, and indistinguishable between the two genotypes (Figure 2C). Because renal inflammation is involved in the pathogenesis of a variety of renal diseases, including salt-sensitive hypertension29, we determined the number of CD3+ cells (T-cell marker) and F4/80+ cells (monocyte/macrophage marker) in the renal cortex, outer and inner medulla of each genotype. There were similar numbers of CD3+ immunoreactive cells (Figure 3D) and F4/80+ immunoreactive cells (Figure 3E) in the cortex and outer medulla between the flox and CDNOS1KO mice. No CD3+ or F4/80+ cells were found in the inner medulla of either genotype (Figure 3D, 3E).
Figure 3.
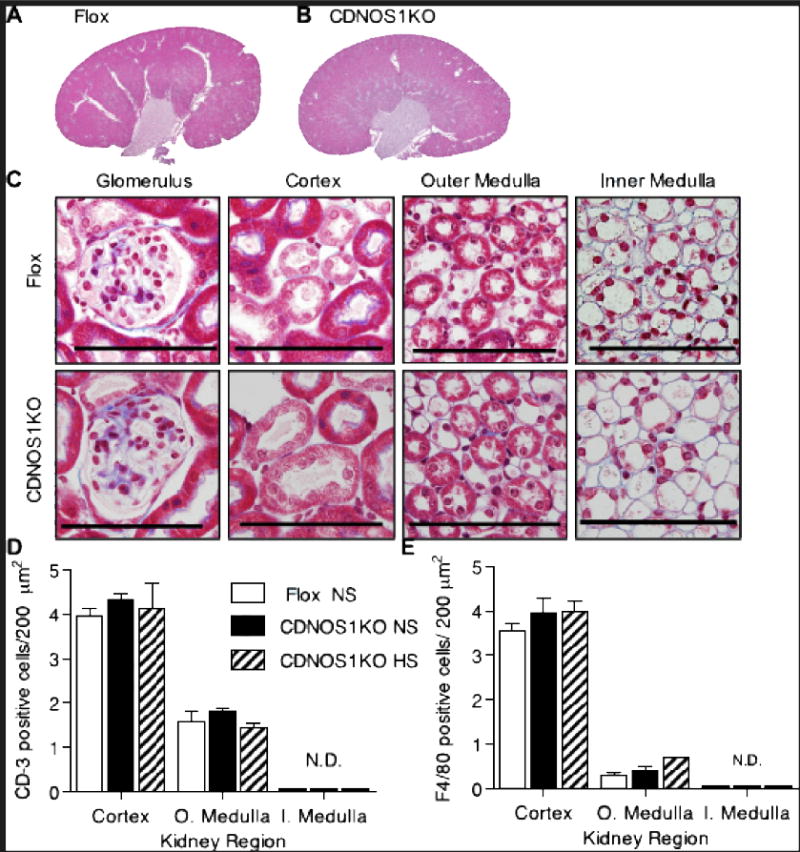
No overt renal pathologies were apparent in the CDNOS1KO mice. (A–C) Representative Gomori’strichrome histological staining of kidneys from flox and CDNOS1KO mice on a normal salt diet.(A)whole kidney section scan of from a flox control mouse and (B) CDNOS1KO mouse. (C) Magnification of kidney structures. (D, E) T-cell (CD3) and macrophage (F4/80) cells are equally expressed in the flox and CDNOS1KO mice. (D) T-cell counts and (E) macrophage cell counts from the cortex, outer medulla, and inner medulla from mice on a NS or 7-day high salt diet (Teklad pellet diet, see methods). O. Medulla – outer medulla, I. medulla – inner medulla. N.D. – not detected. Scale bar = 50 μm.
CDNOS1KO mice displaya salt-sensitive blood pressurephenotype
Mean arterial pressure (MAP), systolic blood pressure (SBP), and diastolic blood pressure (DBP) were determined by telemetry in flox control (n = 9) and CDNOS1KO mice (n = 11). While on a LS diet, CDNOS1KO and flox control mice had similar MAP, SBP, and DBP (Figure 4A, S3A, S3B). When the flox control mice were placed on a HS diet, there were no significant changes in MAP, SBP, and DBP (Figure 4A, S3A, S3B). The CDNOS1KO mice on a HS diet had significantly higher MAP, SBP, and DBP compared to flox control mice on a HS diet (Figure 4A, S3A, S3B). When the CDNOS1KO mice were changed from a LS diet to a HS diet, MAP and SBPsignificantly increased and remained elevated for the 6 days of HS diet compared to LS diet (Two-Way ANOVA MAP: genotype P< 0.16, diet P< 0.009, interaction P = 0.006) (Two-Way ANOVA SBP: genotype P = 0.04, diet P< 0.02, interaction P = 0.02) (Figure 4A, S3A). After 6 days of HS diet, DBP was significantly increased in CDNOS1KO mice compared to LS diet (Two-Way ANOVA DBP: genotype P = 0.89, diet P = 0.61, interaction P = 0.03) (Figure S3B). Heart rates were similar between the genotypes and each mouse genotype heart rate was not significantly affected by diet (Figure S3C). Pulse-pressure was also not significantly different between the genotypes during LS or HS diet interventions (Figure S3D). Although notable is thatthe CDNOS1KO mice have a pulse-pressure greater than 40 mmHg during HS feeding (average over the diet interventions: LS = 39 ± 0.3 mmHg, HS = 42 ± 0.3 mmHg; Figure S3D).
Figure 4.
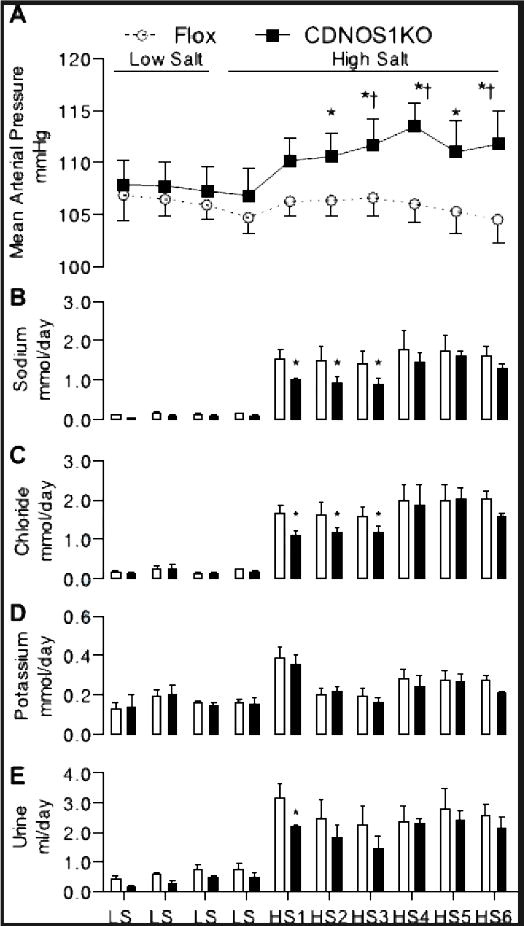
When changed from a low salt (LS) to HS diet, CDNOS1KO mice had a significant increase in mean arterial pressure compared to flox mice (N = 8–11) (A). (B) For 3 days after the change to HS diet, CDNOS1KO mice excrete less sodium and (C) less chloride (N = 6). (D) Potassium excretion was similar between the genotypes (N = 6). (E) Urine excretion was significantly blunted in the CDNOS1KO mouse after 1 day of HS diet (N = 6).* P< 0.05 CDNOS1KO compared to Flox. † P < 0.05 compared to low salt (LS).
Deletion of CDNOS1 results in sodium retention
In a separate group of mice (N = 6/genotype), urine volume, urinary sodium, chloride, and potassium excretion was determined. On a LS diet, CDNOS1KO and flox control mice excreted similar amounts of sodium (Figure 4B), chloride (Figure 4C), potassium (Figure 4D) and urine (Figure 4E). In addition while on the LS diet, CDNOS1KO and flox control mice ate the same amount of food and drank similar amounts of water (Figure S4). Similarly, during the 6 days of HS diet, both flox control and CDNOS1KO mice ate similar amounts of food and drank comparable amounts of water (Figure S4). However, during the first 3 days of HS diet CDNOS1KO mice excreted significantly less sodium and chloride when compared to the flox control mice(Figure 4B, 4C). On day 4 and continuing to day 6 of the HS diet, both genotypes excreted similar amounts of sodium and chloride (Two-Way ANOVA sodium: genotype P< 0.004, diet P< 0.001, interaction P = 0.917; Two-Way ANOVA chloride: genotype P< 0.036, diet P< 0.001, interaction P = 0.92) (Figure 4B, 4C). Potassium excretion was similar between the genotypes on LS and HS diets, and increased significantly after 1 day of HS diet (Figure 4D) (Two-Way ANOVA potassium: genotype P = 0.26, diet P< 0.001, interaction P = 0.99). Urine volume was similar in both genotypes on LS and HS diet, although reduced during the first day of HS diet in the CDNOS1KO mouse compared to flox control mice (Two-Way ANOVA volume: genotype P< 0.005, diet P< 0.001, interaction P = 0.98) (Figure 4E). Creatinine, protein, albumin, and electrolyte excretion rates as well as urine osmolality were similar between the two genotypes on LS diet, NS diet, and day 6 of HS diet (Table 1).
Table 1.
Intake and Urinary Excretion Measurements From Flox (n=6–8, Unless Noted) and CDNOS1KO (n=6–8) Mice on a Low-Salt Diet (0.005% NaCl), Normal-Salt Diet (0.24% NaCl), or High-Salt Diet (2.4% NaCl) far 6 Days
| Dietary NaCl Parameter Genotype |
0.005%
|
0.24%
|
2.40%
|
|||
|---|---|---|---|---|---|---|
| Flox | CDNOS1KO | Flox | CDNOS1KO | Flox | CDNOS1KO | |
| Water intake, mL/d | 2.2±0.8 | 2.1±0.3 | 1.3±0.1 | 1.4±0.1 | 6.0±0.4*† | 5.1±0.9*† |
| Food intake, mL/d | 8.3±0.2 | 8.4±0.26 | 8.2±0.4 | 7.9±0.3 | 7.9±0.6 | 7.2±0.3 |
| Sodium intake, mL/d | 0.2±0.01 | 0.2±0.01 | 9.9±0.5* | 9.5±0.4* | 94.8±6.8*† | 86.7±3.9*† |
| Urine production. mL/d | 1.0±0.2 | 0.8±0.2 | 1.0±0.2 | 1.4±0.4 | 2.8±0.5*† | 2.3±0.4* |
| Protein excretion, mg/d | 2.0±0.1 | 1.4±0.3 | 1.2±0.2 | 0.9±0.1 | 1.4±0.9 | 1.4±0.5 |
| Albumin excretion, μg/d (n=4) | ND | ND | 24.0±5.6 | 26.7±5.2 | 35.1 ±4.7 | 36.1±1.4 |
| Urine osmolality mOsm/kg H2O | 3526±686 | 2632±423 | 3495±603 | 2847±257 | 2446±180 | 2750±427 |
| Sodium excretion, mmol/d | 0.05±0.0l | 0.05±0.02 | 0.3±0.06* | 0.3±0.04* | 1.5±0.2*† | 1.2±0.1*† |
| Chloride encretion, mmol/d | 0.2±0.04 | 0.2±0.05 | 0.5±0.04 | 0.5±0.05 | 1.5±0.2† | 1.1±0.1† |
| Potassium excretion, mmol/d | 0.2±0.02 | 0.1±0.03 | 0.2±0.02 | 0.2±0.03 | 0.2±0.03 | 0.2±0.04 |
No statistically significant differences between flox and CDNOS1KO mice. ND indicates not determined.
P<0.05 tor flox or CDNOS1KO compared with 0.005% NaCl diet, respectively.
P<0.05 far flox or CDNOS1KO compared with 0.24% NaCl diet, respectively.
CDNOS1KO mice displaya rightward shift in the pressure-natriuresis relationship
We generated a pressure-natriuresis relationship from the MAP and sodium excretion data. CDNOS1KO mice display a significant rightward shift in the pressure natriuresis relationship compared to flox control mice (Figure 5A). This rightward shift in the curve is driven by a significant increase in MAP experienced by the CDNOS1KO mice on HS diet (Figure 5B, P = 0.02).
Figure 5.
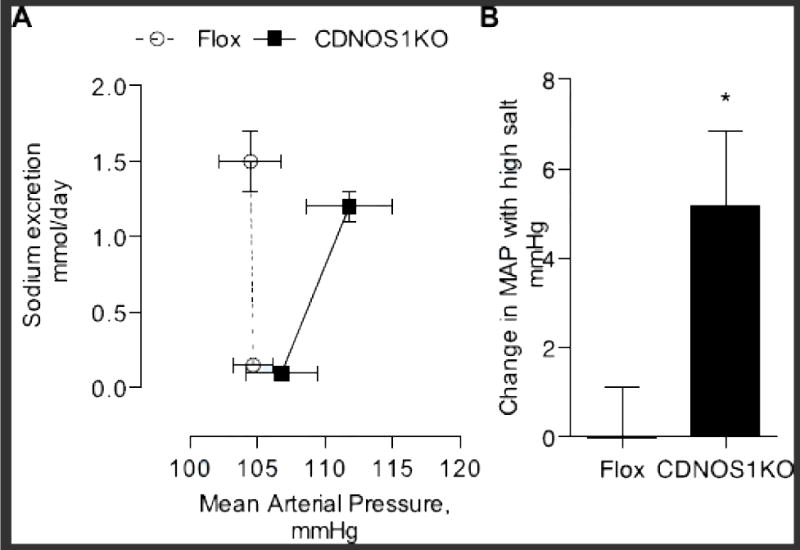
Pressure-natriuresis relationship and the change in mean arterial pressure between a low salt (LS) and 6 day high salt diet (HS). (A) There was a rightward shift in the pressure-natriuresis relationship from CDNOS1KO mice (closed symbols, solid) compared to flox control mice (open symbol, dashed line) on day 6 of HS diet intervention. This was driven by, (B) a significant change in mean arterial pressure from LS to day 6 HS diet in the CDNOS1KO mice. * P = 0.02, n = 8−11).
CDNOS1KO mice have blunted HS-induced NOx excretion
Although CDNOS1KO and flox control mice on LS diet excrete comparable amounts of NOx (Figure 6A), when the diet is changed to HS the NOx excretion significantly increased only in the flox control mice (P<0.05, n = 8–10). After 6 days of HS diet, both flox control and CDNOS1KO mice had significantly higher NOx excretion compared to that on LS diet; however, the NOx excretion was significantly blunted in the CDNOS1KO mice compared to the flox control mice (Two-Way ANOVA NOx: genotype P< 0.001, diet P< 0.001, interaction P = 0.09; Figure 6A). Flox control and CDNOS1KO mice excreted similar levels of PGE metabolites on LS diet, and this was significantly increased after 1 day of HS diet without any differences between the genotypes (Two-Way ANOVA: genotype P< 0.24, diet P< 0.001, interaction P = 0.64) (Figure 6B).
Figure 6.
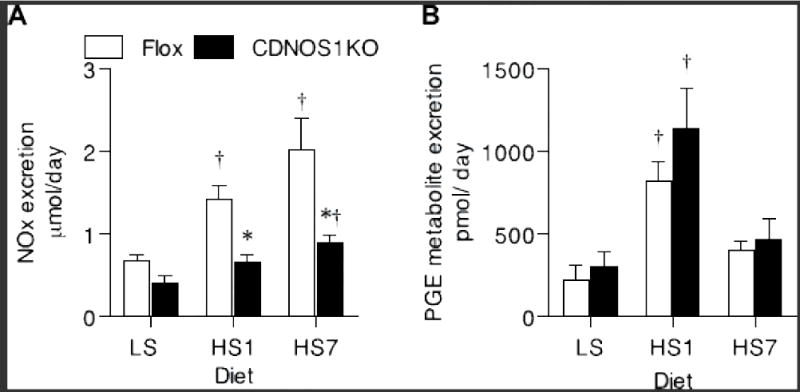
When challenged with high salt diet for 1 day (HS1) or 7 days (HS7) CDNOS1KO mice have (A) blunted NOx excretion compared to flox control mice (N = 6). (B) Urinary PGE metabolite excretion was similar between the genotypes, but significantly higher after 1 day of high salt diet (N = 6). * P< 0.05 CDNOS1KO compared to Flox. † P < 0.05 compared to low salt (LS).
Discussion
The major finding from this study is that deletion of NOS1, specifically from the principal cells of CDs, results in an impaired ability to handle a salt load with a rightward shift in the pressure-natriuresis relationship and a salt-sensitive blood pressure phenotype. These data elucidated the functional relevance of NOS1-derived NO production in the CD to maintain sodium homeostasis and blood pressure control. We demonstrated that the mouse CD does not express NOS1α, but exclusively expresses NOS1β. We show that NOS1β expression is present in the CD of the commercially available NOS1αKO mouse providing an explanation for the lack of a salt-sensitive phenotype in these mice16. This study now clarifies the controversial role of NOS1 regulation of blood pressure.
Humans have multiple NOS1 splice variants9–11 and NOS1 single nucleotide polymorphisms have been associated with hypertension30,31. Humans express comparatively high levels of NOS1α in the cortex and outer medulla, with relatively less NOS1α expression observed in the IMCD32, as determined by immunohistochemistry and Western blots with an N-terminus NOS1 specific antibody that only detects NOS1α. Further analysis with quantitative RT-PCR using primers designed to amplify between exons 17 and 20, which would be a measure of all NOS1 splice variants, showed significant expression of NOS1 in the human renal cortex and medulla32. These data suggest that renal NOS1 expression in humans maybe similar to mice where there is lower expression of NOS1α in the renal medulla. However, further work with normal human and hypertensive patient kidney samples are needed to fully characterize and distinguish NOS1 splice variant expression in the human kidney.
Much of the work related to NOS1 in the kidney has utilized rat models. Most studies used N-terminus specific antibodies, thus not allowing for a complete analysis of the NOS1 splice variants. Although recently Lu et al.33 reported that all NOS1 splice variants are expressed in the rat macula densa, and that these are differentially regulated by dietary sodium; NOS1α was down-regulated after a 10-day HS diet, while NOS1β was induced. In agreement with this finding, rats on a HS diet had an increase in macula densa-derived NO (presumably NOS1β-mediated) that attenuated the tubuloglomerular feedback mechanism33. Similar to Lu et al.33, we recently reported that Sprague Dawley rats on a HS diet have a significant increase in IMCD NOS1β expression; however IMCD NO production was not enhanced34. On the other hand, HS diet significantly increased NO production in IMCD from WT mice without a change in NOS1β expression34. Taken together, although there is distinct regulation of NOS1 splice variants between mice and rats, the commonality is that HS feeding is a physiological regulator of NOS1β in the kidney.
The NOS1 gene deletion in CDNOS1KO mice resulted in significantly less nitrite/nitrate (NOx) excretion compared to flox control animals. Although a majority of NOx in the body is derived from the diet (eating foods enriched in nitrite and/or nitrate), another source is the oxidation of NO35. We found that CDNOS1KO mice ate similar amounts of food as the flox control mice, thus indicating that changes in urinary NOx most likely reflect changes in CD-derived NO production. In agreement with this finding, others have suggested that urinary NOx is reflective of renal NO production in both mice36,37 and humans3. Likewise, our data indicate that a significant portion (about 50%) of urinary NOx is actually derived from the CD and from NOS1. Mattson’s laboratory found that the rat IMCD was the major source of NOS activity in the kidney5, therefore we measured IMCD nitrite production, and found that the loss of NOS1 results in ~75% less nitrite than control. This finding supports our hypothesis that urinary NOx excretion is, in part, a measure of CD-derived NO production. For humans, urinary NOx excretion has recently been identified as a diagnostic marker for predicting the progression of hypertension4, with hypertensive patients excreting significantly less NOx than normotensive-matched controls1–3.
One of the important mechanistic insights of this study was revealed when the mice were challenged with a HS diet. A HS challenge resulted in reduced sodium, chloride, NOx, and urine excretion with an increase in blood pressure in CDNOS1KO mice despite similar food and water intake compared to flox controls. The Guyton model of long-term control of arterial pressure predicts that the kidney alters sodium and water excretion to maintain fluid balance and arterial pressure38,39, and is commonly referred to as the pressure-natriuresis/diuresis relationship(s). Previous work has suggested that the NO pathway modulates the pressure-natriuresis relationship40,41 although little was understood about the cellular source or NOS isoform mediating this response. The current study defines CD NOS1 as a mediator of pressure-natriuresis/diuresis, as CDNOS1KO mice display a significant rightward shift in the pressure-natriuresis relationship, even when sodium excretion returned to comparable levels as the flox control mice.
The increase in MAP experienced by CDNOS1KO mice on a HS diet was largely driven by a significant increase in systolic pressure. Diastolic pressure was shown to be significantly different on day 6 of the HS diet. Consequently, we found that pulse pressure was not significantly different between flox and CDNOS1KO mice on either a LS or HS diet. Although, CDNOS1KO mice did have a pulse pressure increase of ~4 mmHg on a HS diet compared to that on a LS diet. In clinical studies, pulse pressure is used as a predictor for cardiovascular disease42–45, where differences as little as 4 mmHg in pulse pressure have been shown to lead to increases in mortality42,44. Salt-sensitivity (clinically defined as a >10 mmHg drop in blood pressure due to sodium restriction for 24 h46) and pulse pressure were associated with an increase in mortality in both normotensive and hypertensive patients, especially for patients older than 60 years42. Given these clinical studies and the finding that young CDNOS1KO male mice on HS diet have a slightly elevated pulse pressure but a significant elevation in systolic pressure, we predict that as the CDNOS1KO mice age with consuming a HS diet will lead to significant increases in pulse pressure, vessel remodeling, decreases in baroreflex sensitivity and increases in mortality, as experienced by humans. Future research will test this possible hypothesis.
The CD produces PGE247, a natriuretic and diuretic factor, and PGEmetabolite excretion is increased with HS diet (50). We found that HS diet increased PGEmetabolite excretion similarly between CDNOS1KO and flox control mice. This suggests that the reduced sodium and chloride excretion observed in the CDNOS1KO mouse was not due to a significant reduction in PGE excretion and indicates that CD-derived NO does not regulate PGE excretion. We propose that flox control mice maintained sodium homeostasis through a direct tubular action of NOS1-dependent inhibition of sodium and water reabsorption, independent of PGE, although we cannot rule out that CD NOS1-derived NO regulates vasa recta resistance and medullary blood flow40,48.
The importance of the CD in final control of sodium excretion and blood pressure regulation has been elaborated in previous studies with the use of CD specific knockout mice, especially with that of the endothelin (ET-1) system that may be the upstream regulator of NOS1 activity25,26,49–52. The CD is one of the major sources of renal ET-126,36 as well as renal NOS activity5. ET-1 via the endothelin B receptor (ETB) stimulates mouse CD NOS1-derived NO production53 andprevious reports suggested that CD ETB receptor signaling via NO production mediates ET-1-dependent control of sodium excretion36,54,55. Both CDET1KO26 and CDETBKO50 mice display salt-sensitive hypertension that is to a similar level as the CDNOS1KO mouse. Interestingly, CDET1KO mice demonstrate attenuated NOx excretion in response to increased pressure or a HS challenge36. ET-1 via the ETB receptor decreases the open probability of CD epithelial sodium channels (ENaC) via direct tubular actions56,57, although it is unknown whether this is via the NOS1/NO pathway. Therefore, future experiments will determine whether the HS-induced increase in blood pressure in CDNOS1KO mice is via the loss of the CD ET-1/ETB/ENaC signaling pathway.
Perspectives
Collecting duct NOS1 is a novel pathway involved in fluid-electrolyte balance and has received little attention within this complex regulatory system. Evidence for the importance of renal NO pathways to human physiology recently came from Baumann et al.4 who reported that urinary NOx is a biomarker for predicting the progression of hypertension in 75% of normotensive patients over a 4–5 year period. Moreover, hypertensive patients have reduced NOx excretion1–3. CDNOS1KO mice display a significantly low level of urinary NOx excretion with increased salt consumption leading to a salt-sensitive blood pressure phenotype. Thus, NOS1 derived-NO in the CD regulates fluid-electrolyte balance and blood pressure. These basic studies highlight the importance of the CD NOS1 pathway and the necessity to translate these mechanistic findings to humans. The CDNOS1KO mouse model will facilitate testing future hypotheses focused on the NOS1-dependent mechanisms of cardiovascular and renal consequences of salt-sensitive hypertension.
Supplementary Material
Novelty and Significance.
-
What is New?
Collecting duct NOS1 is critical for fluid-electrolyte balance
Deletion of all NOS1 variants in the CD results in a rightward shift in the pressure natriuresis relationship and a salt-sensitive blood pressure phenotype
NOS1β is exclusively expressed in the collecting duct of the mouse
Deletion of CD NOS1 does not affect renal development
A significant portion of urinary NOx excretion is derived from CD NOS1
-
What is relevant
This study clarifies a controversy in the literature, where infusion of anti-sense NOS1 oligonucleotides increased blood pressure in rats on a high salt diet, but NOS1KO mice were normotensive even on a high salt diet. The commercial NOS1KO mouse is misnamed and is a NOS1αKO. This study determined that deletion of all NOS1 splice variants results in blood pressure increases when challenged with high salt diet.
Deletion of CD NOS1 results in a significant increase in MAP with high salt diet and it remains elevated even when sodium and water excretion return to control levels. Humans express multiple NOS1 splice variants, thus therapies targeted to the expression or activation of NOS1 splice variants may lead to novel interventions for salt-sensitive hypertension and/or renal diseases.
-
Summary
Renal collecting duct NOS1 is critical in fluid-electrolyte balance when challenged with high dietary sodium and regulates blood pressure.
Acknowledgments
We thank Dr. Tatsuo Yamamoto (Second Department of Medicine, Numazu City Hospital, Numazu, Japan) for his renal pathology expertise. We appreciate the outstanding technical support from Ms. Janet Hobbs, Mrs. Jackie Musall, Mrs. Amy Dukes, and Mrs. Melissa Durley-Giles.
Sources of Funding
This work was supported in part by The National Institutes of Health (HL60653 to J.S.P); Cardiovascular Discovery Institute (to D.M.P.); The National Kidney Foundation Post Doctoral Fellowship (to K.A.H.). This work was also supported by the NIH Program Project Grant on Endothelin Control of Renal Excretory and Hemodynamic Function (HL95499; to D.M.P., J.S.P., D.E.K.).
Footnotes
Publisher's Disclaimer: This is a PDF file of an unedited manuscript that has been accepted for publication. As a service to our customers we are providing this early version of the manuscript. The manuscript will undergo copyediting, typesetting, and review of the resulting proof before it is published in its final citable form. Please note that during the production process errors may be discovered which could affect the content, and all legal disclaimers that apply to the journal pertain.
Conflicts of Interest/Disclosures: None
References
- 1.Lyamina NP, Dolotovskaya PV, Lyamina SV, Malyshev IY, Manukhina EB. Nitric oxide production and intensity of free radical processes in young men with high normal and hypertensive blood pressure. Med Sci Monit. 2003;9:CR304–310. [PubMed] [Google Scholar]
- 2.Lyamina NP, Lyamina SV, Senchiknin VN, Mallet RT, Downey HF, Manukhina EB. Normobaric hypoxia conditioning reduces blood pressure and normalizes nitric oxide synthesis in patients with arterial hypertension. J Hypertens. 2011;29:2265–2272. doi: 10.1097/HJH.0b013e32834b5846. [DOI] [PubMed] [Google Scholar]
- 3.Armas-Padilla MC, Armas-Hernandez MJ, Sosa-Canache B, Cammarata R, Pacheco B, Guerrero J, Carvajal AR, Hernandez-Hernandez R, Israili ZH, Valasco M. Nitric oxide and malondialdehyde in human hypertension. Am J Ther. 2007;14:172–176. doi: 10.1097/01.pap.0000249914.75895.48. [DOI] [PubMed] [Google Scholar]
- 4.Baumann M, Schmaderer C, Kuznetsova T, Bartholome R, Smits JF, Richart T, Struijker-Boudier H, Staessen JA. Urinary nitric oxide metabolites and individual blood pressure progression to overt hypertension. Eur J Cardiovasc Prev Rehabil. 2011;18:656–663. doi: 10.1177/1741826710389419. [DOI] [PubMed] [Google Scholar]
- 5.Wu F, Park F, Cowley AW, Jr, Mattson DL. Quantification of nitric oxide synthase activity in microdissected segments of the rat kidney. Am J Physiol. 1999;276:F874–881. doi: 10.1152/ajprenal.1999.276.6.F874. [DOI] [PubMed] [Google Scholar]
- 6.Sullivan JC, Pardieck JL, Hyndman KA, Pollock JS. Renal nos activity, expression, and localization in male and female spontaneously hypertensive rats. Am J Physiol Regul Integr Comp Physiol. 2010;298:R61–69. doi: 10.1152/ajpregu.00526.2009. [DOI] [PMC free article] [PubMed] [Google Scholar]
- 7.Sullivan JC, Smart EJ, Pollock DM, Pollock JS. Influence of salt on subcellular localization of nitric oxide synthase activity and expression in the renal inner medulla. Clin Exp Pharmacol Physiol. 2008;35:120–125. doi: 10.1111/j.1440-1681.2007.04802.x. [DOI] [PubMed] [Google Scholar]
- 8.Mattson DL, Bellehumeur TG. Neural nitric oxide synthase in the renal medulla and blood pressure regulation. Hypertension. 1996;28:297–303. doi: 10.1161/01.hyp.28.2.297. [DOI] [PubMed] [Google Scholar]
- 9.Saur D, Paehge H, Schusdziarra V, Allescher HD. Distinct expression of splice variants of neuronal nitric oxide synthase in the human gastrointestinal tract. Gastroenterology. 2000;118:849–858. doi: 10.1016/s0016-5085(00)70171-5. [DOI] [PubMed] [Google Scholar]
- 10.Wang Y, Newton DC, Robb GB, Kau CL, Miller TL, Cheung AH, Hall AV, VanDamme S, Wilcox JN, Marsden PA. Rna diversity has profound effects on the translation of neuronal nitric oxide synthase. Proc Natl Acad Sci U S A. 1999;96:12150–12155. doi: 10.1073/pnas.96.21.12150. [DOI] [PMC free article] [PubMed] [Google Scholar]
- 11.Bros M, Boissel JP, Godtel-Armbrust U, Forstermann U. Transcription of human neuronal nitric oxide synthase mrnas derived from different first exons is partly controlled by exon 1-specific promoter sequences. Genomics. 2006;87:463–473. doi: 10.1016/j.ygeno.2005.11.013. [DOI] [PubMed] [Google Scholar]
- 12.Brenman JE, Xia H, Chao DS, Black SM, Bredt DS. Regulation of neuronal nitric oxide synthase through alternative transcripts. Dev Neurosci. 1997;19:224–231. doi: 10.1159/000111211. [DOI] [PubMed] [Google Scholar]
- 13.Eliasson MJ, Blackshaw S, Schell MJ, Snyder SH. Neuronal nitric oxide synthase alternatively spliced forms: Prominent functional localizations in the brain. Proc Natl Acad Sci U S A. 1997;94:3396–3401. doi: 10.1073/pnas.94.7.3396. [DOI] [PMC free article] [PubMed] [Google Scholar]
- 14.Oberbaumer I, Moser D, Bachmann S. Nitric oxide synthase 1 mrna: Tissue-specific variants from rat with alternative first exons. Biol Chem. 1998;379:913–919. [PubMed] [Google Scholar]
- 15.Smith C, Merchant M, Fekete A, Nyugen HL, Oh P, Tain YL, Klein JB, Baylis C. Splice variants of neuronal nitric oxide synthase are present in the rat kidney. Nephrol Dial Transplant. 2009;24:1422–1428. doi: 10.1093/ndt/gfn676. [DOI] [PMC free article] [PubMed] [Google Scholar]
- 16.Sallstrom J, Carlstrom M, Jensen BL, Skott O, Brown RD, Persson AE. Neuronal nitric oxide synthase-deficient mice have impaired renin release but normal blood pressure. Am J Hypertens. 2008;21:111–116. doi: 10.1038/ajh.2007.16. [DOI] [PubMed] [Google Scholar]
- 17.Gyurko R, Leupen S, Huang PL. Deletion of exon 6 of the neuronal nitric oxide synthase gene in mice results in hypogonadism and infertility. Endocrinology. 2002;143:2767–2774. doi: 10.1210/endo.143.7.8921. [DOI] [PubMed] [Google Scholar]
- 18.Gu H, Marth JD, Orban PC, Mossmann H, Rajewsky K. Deletion of a DNA polymerase beta gene segment in t cells using cell type-specific gene targeting. Science. 1994;265:103–106. doi: 10.1126/science.8016642. [DOI] [PubMed] [Google Scholar]
- 19.Sauer B, Henderson N. Site-specific DNA recombination in mammalian cells by the cre recombinase of bacteriophage p1. Proc Natl Acad Sci U S A. 1988;85:5166–5170. doi: 10.1073/pnas.85.14.5166. [DOI] [PMC free article] [PubMed] [Google Scholar]
- 20.Sauer B, Henderson N. Cre-stimulated recombination at loxp-containing DNA sequences placed into the mammalian genome. Nucleic Acids Res. 1989;17:147–161. doi: 10.1093/nar/17.1.147. [DOI] [PMC free article] [PubMed] [Google Scholar]
- 21.Tsien JZ, Chen DF, Gerber D, Tom C, Mercer EH, Anderson DJ, Mayford M, Kandel ER, Tonegawa S. Subregion- and cell type-restricted gene knockout in mouse brain. Cell. 1996;87:1317–1326. doi: 10.1016/s0092-8674(00)81826-7. [DOI] [PubMed] [Google Scholar]
- 22.Nelson RD, Stricklett P, Gustafson C, Stevens A, Ausiello D, Brown D, Kohan DE. Expression of an aqp2 cre recombinase transgene in kidney and male reproductive system of transgenic mice. Am J Physiol. 1998;275:C216–226. doi: 10.1152/ajpcell.1998.275.1.C216. [DOI] [PubMed] [Google Scholar]
- 23.Stricklett PK, Nelson RD, Kohan DE. The cre/loxp system and gene targeting in the kidney. Am J Physiol. 1999;276:F651–657. doi: 10.1152/ajprenal.1999.276.5.F651. [DOI] [PubMed] [Google Scholar]
- 24.Stricklett PK, Nelson RD, Kohan DE. Targeting collecting tubules using the aquaporin-2 promoter. Exp Nephrol. 1999;7:67–74. doi: 10.1159/000020587. [DOI] [PubMed] [Google Scholar]
- 25.Kohan DE. Biology of endothelin receptors in the collecting duct. Kidney Int. 2009;76:481–486. doi: 10.1038/ki.2009.203. [DOI] [PubMed] [Google Scholar]
- 26.Ahn D, Ge Y, Stricklett PK, Gill P, Taylor D, Hughes AK, Yanagisawa M, Miller L, Nelson RD, Kohan DE. Collecting duct-specific knockout of endothelin-1 causes hypertension and sodium retention. J Clin Invest. 2004;114:504–511. doi: 10.1172/JCI21064. [DOI] [PMC free article] [PubMed] [Google Scholar]
- 27.Kohan DE. Interleukin-1 regulation of prostaglandin e2 synthesis by the papillary collecting duct. J Lab Clin Med. 1989;114:717–723. [PubMed] [Google Scholar]
- 28.Foster JM, Carmines PK, Pollock JS. Pp2b-dependent no production in the medullary thick ascending limb during diabetes. Am J Physiol Renal Physiol. 2009;297:F471–480. doi: 10.1152/ajprenal.90760.2008. [DOI] [PMC free article] [PubMed] [Google Scholar]
- 29.Rodriguez-Iturbe B. Renal infiltration of immunocompetent cells: Cause and effect of sodium-sensitive hypertension. Clin Exp Nephrol. 2010;14:105–111. doi: 10.1007/s10157-010-0268-1. [DOI] [PubMed] [Google Scholar]
- 30.Padmanabhan S, Menni C, Lee WK, Laing S, Brambilla P, Sega R, Perego R, Grassi G, Cesana G, Delles C, Mancia G, Dominiczak AF. The effects of sex and method of blood pressure measurement on genetic associations with blood pressure in the pamela study. J Hypertens. 2010;28:465–477. doi: 10.1097/HJH.0b013e32833594d7. [DOI] [PubMed] [Google Scholar]
- 31.Iwai N, Tago N, Yasui N, Kokubo Y, Inamoto N, Tomoike H, Shioji K. Genetic analysis of 22 candidate genes for hypertension in the japanese population. J Hypertens. 2004;22:1119–1126. doi: 10.1097/00004872-200406000-00012. [DOI] [PubMed] [Google Scholar]
- 32.Jarry A, Renaudin K, Denis MG, Robard M, Buffin-Meyer B, Karam G, Buzelin F, Paris H, Laboisse CL, Vallette G. Expression of nos1 and soluble guanylyl cyclase by human kidney epithelial cells: Morphological evidence for an autocrine/paracrine action of nitric oxide. Kidney Int. 2003;64:170–180. doi: 10.1046/j.1523-1755.2003.00078.x. [DOI] [PubMed] [Google Scholar]
- 33.Lu D, Fu Y, Lopez-Ruiz A, Zhang R, Juncos R, Liu H, Manning RD, Jr, Juncos LA, Liu R. Salt-sensitive splice variant of nnos expressed in the macula densa cells. Am J Physiol Renal Physiol. 2010;298:F1465–1471. doi: 10.1152/ajprenal.00650.2009. [DOI] [PMC free article] [PubMed] [Google Scholar]
- 34.Hyndman KA, Xue J, Macdonell A, Speed JS, Jin C, Pollock JS. Distinct regulation of inner medullary collecting duct no production from mice and rats. Clin Exp Pharmacol Physiol. doi: 10.1111/1440-1681.12057. in Press. [DOI] [PMC free article] [PubMed] [Google Scholar]
- 35.van Faassen EE, Bahrami S, Feelisch M, Hogg N, Kelm M, Kim-Shapiro DB, Kozlov AV, Li H, Lundberg JO, Mason R, Nohl H, Rassaf T, Samouilov A, Slama-Schwok A, Shiva S, Vanin AF, Weitzberg E, Zweier J, Gladwin MT. Nitrite as regulator of hypoxic signaling in mammalian physiology. Med Res Rev. 2009;29:683–741. doi: 10.1002/med.20151. [DOI] [PMC free article] [PubMed] [Google Scholar]
- 36.Schneider MP, Ge Y, Pollock DM, Pollock JS, Kohan DE. Collecting duct-derived endothelin regulates arterial pressure and na excretion via nitric oxide. Hypertension. 2008;51:1605–1610. doi: 10.1161/HYPERTENSIONAHA.107.108126. [DOI] [PMC free article] [PubMed] [Google Scholar]
- 37.Tiwari S, Sharma N, Gill PS, Igarashi P, Kahn CR, Wade JB, Ecelbarger CM. Impaired sodium excretion and increased blood pressure in mice with targeted deletion of renal epithelial insulin receptor. Proc Natl Acad Sci U S A. 2008;105:6469–6474. doi: 10.1073/pnas.0711283105. [DOI] [PMC free article] [PubMed] [Google Scholar]
- 38.Guyton AC. Blood pressure control--special role of the kidneys and body fluids. Science. 1991;252:1813–1816. doi: 10.1126/science.2063193. [DOI] [PubMed] [Google Scholar]
- 39.Guyton AC. Renal function curves and control of body fluids and arterial pressure. Acta Physiol Scand Suppl. 1990;591:107–113. [PubMed] [Google Scholar]
- 40.O’Connor PM, Cowley AW., Jr Modulation of pressure-natriuresis by renal medullary reactive oxygen species and nitric oxide. Curr Hypertens Rep. 2010;12:86–92. doi: 10.1007/s11906-010-0094-6. [DOI] [PMC free article] [PubMed] [Google Scholar]
- 41.Majid DS, Navar LG. Nitric oxide in the mediation of pressure natriuresis. Clin Exp Pharmacol Physiol. 1997;24:595–599. doi: 10.1111/j.1440-1681.1997.tb02098.x. [DOI] [PubMed] [Google Scholar]
- 42.Weinberger MH, Fineberg NS, Fineberg SE, Weinberger M. Salt sensitivity, pulse pressure, and death in normal and hypertensive humans. Hypertension. 2001;37:429–432. doi: 10.1161/01.hyp.37.2.429. [DOI] [PubMed] [Google Scholar]
- 43.Lorenzo C, Aung K, Stern MP, Haffner SM. Pulse pressure, prehypertension, and mortality: The san antonio heart study. Am J Hypertens. 2009;22:1219–1226. doi: 10.1038/ajh.2009.151. [DOI] [PubMed] [Google Scholar]
- 44.Norman GJ, Hawkley L, Ball A, Berntson GG, Cacioppo JT. Perceived social isolation moderates the relationship between early childhood trauma and pulse pressure in older adults. Int J Psychophysiol. 2013 doi: 10.1016/j.ijpsycho.2012.12.008. in press. [DOI] [PubMed] [Google Scholar]
- 45.Weiss A, Boaz M, Beloosesky Y, Kornowski R, Grossman E. Pulse pressure predicts mortality in elderly patients. J Gen Intern Med. 2009;24:893–896. doi: 10.1007/s11606-009-1008-7. [DOI] [PMC free article] [PubMed] [Google Scholar]
- 46.Weinberger MH, Miller JZ, Luft FC, Grim CE, Fineberg NS. Definitions and characteristics of sodium sensitivity and blood pressure resistance. Hypertension. 1986;8:II127–134. doi: 10.1161/01.hyp.8.6_pt_2.ii127. [DOI] [PubMed] [Google Scholar]
- 47.Ge Y, Strait KA, Stricklett PK, Yang T, Kohan DE. Role of prostaglandins in collecting duct-derived endothelin-1 regulation of blood pressure and water excretion. Am J Physiol Renal Physiol. 2007;293:F1805–1810. doi: 10.1152/ajprenal.00307.2007. [DOI] [PubMed] [Google Scholar]
- 48.Mattson DL, Lu S, Nakanishi K, Papanek PE, Cowley AW., Jr Effect of chronic renal medullary nitric oxide inhibition on blood pressure. Am J Physiol. 1994;266:H1918–1926. doi: 10.1152/ajpheart.1994.266.5.H1918. [DOI] [PubMed] [Google Scholar]
- 49.Ge Y, Ahn D, Stricklett PK, Hughes AK, Yanagisawa M, Verbalis JG, Kohan DE. Collecting duct-specific knockout of endothelin-1 alters vasopressin regulation of urine osmolality. Am J Physiol Renal Physiol. 2005;288:F912–920. doi: 10.1152/ajprenal.00432.2004. [DOI] [PubMed] [Google Scholar]
- 50.Ge Y, Bagnall A, Stricklett PK, Strait K, Webb DJ, Kotelevtsev Y, Kohan DE. Collecting duct-specific knockout of the endothelin b receptor causes hypertension and sodium retention. Am J Physiol Renal Physiol. 2006;291:F1274–1280. doi: 10.1152/ajprenal.00190.2006. [DOI] [PubMed] [Google Scholar]
- 51.Ge Y, Bagnall A, Stricklett PK, Webb D, Kotelevtsev Y, Kohan DE. Combined knockout of collecting duct endothelin a and b receptors causes hypertension and sodium retention. Am J Physiol Renal Physiol. 2008;295:F1635–1640. doi: 10.1152/ajprenal.90279.2008. [DOI] [PMC free article] [PubMed] [Google Scholar]
- 52.Ge Y, Stricklett PK, Hughes AK, Yanagisawa M, Kohan DE. Collecting duct-specific knockout of the endothelin a receptor alters renal vasopressin responsiveness, but not sodium excretion or blood pressure. Am J Physiol Renal Physiol. 2005;289:F692–698. doi: 10.1152/ajprenal.00100.2005. [DOI] [PubMed] [Google Scholar]
- 53.Hyndman KA, MacDonell AH, Pollock JS. Extracellular signal-regulated kinases1/2 signaling pathways are not involved in endothelin regulation of mouse inner medullary collecting duct nitric oxide production. Life Sciences. 2012 doi: 10.1016/j.lfs.2012.01.014. [DOI] [PMC free article] [PubMed] [Google Scholar]
- 54.Nakano D, Pollock JS, Pollock DM. Renal medullary etb receptors produce diuresis and natriuresis via nos1. Am J Physiol Renal Physiol. 2008;294:F1205–1211. doi: 10.1152/ajprenal.00578.2007. [DOI] [PMC free article] [PubMed] [Google Scholar]
- 55.Pollock JS, Pollock DM. Endothelin and nos1/nitric oxide signaling and regulation of sodium homeostasis. Curr Opin Nephrol Hypertens. 2008;17:70–75. doi: 10.1097/MNH.0b013e3282f34b02. [DOI] [PubMed] [Google Scholar]
- 56.Bugaj V, Mironova E, Kohan DE, Stockand JD. Collecting duct-specific endothelin b receptor knockout increases enac activity. Am J Physiol Cell Physiol. 2012;302:C188–194. doi: 10.1152/ajpcell.00301.2011. [DOI] [PMC free article] [PubMed] [Google Scholar]
- 57.Bugaj V, Pochynyuk O, Mironova E, Vandewalle A, Medina JL, Stockand JD. Regulation of the epithelial na+ channel by endothelin-1 in rat collecting duct. Am J Physiol Renal Physiol. 2008;295:F1063–1070. doi: 10.1152/ajprenal.90321.2008. [DOI] [PMC free article] [PubMed] [Google Scholar]
Associated Data
This section collects any data citations, data availability statements, or supplementary materials included in this article.