

Abstract
Pretreatment of mice with a low hepatotoxic dose of acetaminophen (APAP) results in resistance to a subsequent, higher dose of APAP. This mouse model, termed APAP autoprotection was used here to identify differentially expressed genes and cellular pathways that could contribute to this development of resistance to hepatotoxicity. Male C57BL/6J mice were pretreated with APAP (400 mg/kg) and then challenged 48 hr later with 600 mg APAP/kg. Livers were obtained 4 or 24 hr later and total hepatic RNA was isolated and hybridized to Affymetrix Mouse Genome MU430_2 GeneChip. Statistically significant genes were determined and gene expression changes were also interrogated using the Causal Reasoning Engine (CRE). Extensive literature review narrowed our focus to methionine adenosyl transferase-1 alpha (MAT1A), nuclear factor (erythroid-derived 2)-like 2 (Nrf2), flavin-containing monooxygenase 3 (Fmo3) and galectin-3 (Lgals3). Down-regulation of MAT1A could lead to decreases in S-adenosylmethionine (SAMe), which is known to protect against APAP toxicity. Nrf2 activation is expected to play a role in protective adaptation. Up-regulation of Lgals3, one of the genes supporting the Nrf2 hypothesis, can lead to suppression of apoptosis and reduced mitochondrial dysfunction. Fmo3 induction suggests the involvement of an enzyme not known to metabolize APAP in the development of tolerance to APAP toxicity. Subsequent quantitative RT-PCR and immunochemical analysis confirmed the differential expression of some of these genes in the APAP autoprotection model. In conclusion, our genomics strategy identified cellular pathways that might further explain the molecular basis for APAP autoprotection.
Keywords: acetaminophen, liver, autoprotection, gene array, hepatotoxicity
Introduction
Although acetaminophen (APAP) is one of the most commonly used over-the-counter analgesic and antipyretic agents in the world, it accounts for more than 50% of all acute liver failure cases in the U.S. and Great Britain (Larson et al., 2005). For this reason, there is concern that has prompted extensive research aimed at elucidating the mechanism of APAP hepatotoxicity and how it may be prevented. Due to the similarities in injury and recovery between rodents and humans, rodent models have proven useful in studying signaling pathways involved in APAP hepatotoxicity (Park et al., 2005).
One experimental approach to modulate APAP hepatotoxicity in rodents is through auto/heteroprotection. Autoprotection is defined as resistance to toxicant re-exposure following acute, mild injury with the same toxicant, whereas heteroprotection is achieved when different toxicants are used for pretreatment and treatment. Carbon tetrachloride (CCl4) is one compound that has been used extensively as a chemical model of autoprotection. Mehendale and co-workers speculated in the early 1990’s that compensatory hepatocellular proliferation is of critical importance to CCl4-induced autoprotection (Thakore and Mehendale, 1991). This hypothesis was supported by use of the antimitotic agent colchicine, which blocked autoprotection by preventing hepatocellular proliferation after the initial dose of CCl4, demonstrating that compensatory cell division following initial dosing with CCl4 is at least in part, responsible for the heightened tolerance and ability of the liver to recover from toxicant re-exposure (Rao and Mehendale, 1991).
Our laboratory has previously conducted studies using chemical treatments and conditions that reduce the severity of APAP toxicity in mice (Moffit et al., 2007c; Aleksunes et al., 2008a). Peroxisome proliferators such as clofibrate (CFB) are known to diminish APAP toxicity in mice (Manautou et al., 1994). Using knockout mice, we determined that protection by CFB is reversed in the absence of the PPARα receptor, demonstrating that its activation is necessary for hepatoprotection (Chen et al., 2000). Gene array analysis on livers from these rodents identified vanin-1 as a gene of interest. Vanin-1 (Vnn1) mRNA is significantly up-regulated in wild-type mice exhibiting protection from APAP toxicity, but not in PPARα-null mice (Moffit et al., 2007b). Increases in Vnn1 expression augment the levels of hepatic cystamine, which is an antioxidant capable of protecting against APAP hepatotoxicity (Miners et al., 1984; Moffit et al., 2007c). This increase in cystamine may explain why CFB protects the mouse liver from APAP toxicity. Vnn1 also modulates immune function by contributing to the extravasation of inflammatory cells to sites of injury (Meghari et al., 2007).
A mouse model of APAP autoprotection has been established in our laboratory to investigate the role and regulation of hepatobiliary drug transporters during development of resistance to APAP hepatotoxicity. We have determined that APAP autoprotection in mice is not due to differences in bioactivation or detoxification of APAP (Aleksunes et al., 2008a). These studies focused on the differential expression of members of the multidrug resistance-associated protein (Mrp) superfamily and their role in APAP autoprotection. These proteins are ATP-dependent membrane transporters responsible for the efflux of chemicals from the liver. mRNA and protein expression of the sinusoidal efflux transporter Mrp4 is elevated following APAP pretreatment, and its increased expression is localized to hepatocytes in centrilobular areas where compensatory cellular proliferation following pretreatment with mildly hepatotoxic doses of APAP is confined (Aleksunes et al., 2008a). Our studies also showed that colchicine treatment following administration of the priming dose of APAP reverses tolerance to hepatotoxicity, much like in the CCl4 model. The reversal in tolerance by colchicine is associated with a lack of induction in Mrp4 gene and protein expression that is usually seen with APAP. This suggests that Mrp4 expression is increased in proliferating hepatocytes as a mechanism for efflux of toxic by-products and to lower the chemical burden on hepatocytes, which in turn should lead to faster and more efficient recovery from APAP re-exposure (Aleksunes et al., 2008a).
While a role for Mrp4 in APAP autoprotection is well supported, we were interested in identifying other molecular pathways that might also contribute to the development of resistance to APAP hepatotoxicity resulting from pre-treatment to this toxicant. Therefore, C57BL/6J liver samples from our previous APAP autoprotection study (Aleksunes et al., 2008a) were subjected to gene array analysis. Statistically significant genes were analyzed individually and using the Causal Reasoning Engine (CRE) to gain further insight into the molecular mechanisms of autoprotection. CRE is a recently developed computational platform that provides hypotheses on the upstream molecular events that best explain gene expression profiles by interrogating prior biological knowledge (Enayetallah et al., 2011). Indeed, this approach did identify additional mechanisms that might further explain the molecular basis for autoprotection.
Methods and Materials
Chemicals
Acetaminophen, propylene glycol, and colchicine were purchased from Sigma-Aldrich (St Louis, MO). Zinc formalin was obtained from Fisher Scientific (Pittsburgh, PA). All other reagents were of reagent grade or better.
Animals
10–12 week old male C57BL/6J mice were obtained from Jackson Laboratories (Bar Harbor, ME). Upon arrival, mice were acclimated for one week. Mice were housed in a 12-hr dark/light cycle in a temperature and humidity controlled environment. Mice were fed laboratory rodent diet 2018 (Harlan Teklad, Madison, WI) ad libitum.
Dosing regimen 1
Following overnight fast, mice were treated with APAP (400 mg/kg) in 50% propylene glycol or vehicle, 48 hr later, APAP and vehicle pretreated animals were treated with either APAP (600 mg/kg) in 50% propylene glycol or vehicle (5 mL/kg i.p). Liver and plasma were collected 4 or 24 hr later.
Dosing regimen 2
Following overnight fast, mice were treated with APAP (400 mg/kg) in 50% propylene glycol or vehicle (5 mL/kg i.p.). Liver and plasma were collected 2, 4, 8, 12, 24 and 48 hr later.
Dosing regimen 3
Following overnight fast, mice were treated with APAP (400 mg/kg) in 50% propylene glycol or vehicle (5 mL/kg i.p.). To block compensatory hepatocyte proliferation, 2 mg/kg colchicine or vehicle (saline; 5 mL/kg i.p.) was given 24 and 49 hr later. A second dose of APAP (600 mg/kg) or vehicle (50% propylene glycol, 5 mL/kg i.p.) was administered 48 hr after the initial APAP dose. Plasma and livers were collected 24 hr after the second dose of APAP.
All animal studies were performed in accordance with National Institute of Health standards and the Guide for the Care and Use of Laboratory Animals. This work was approved by the University of Connecticut’s Institutional Animal Care and Use Committee.
Gene Array Analysis
Snap frozen liver samples were sent to Gene Logic (Gaithersburg, MD) where RNA was isolated and hybridized to the MU430_2 GeneChips. Affymetrix Cel files were imported using Gene Spring software (Agilent, Santa Clara, CA) and data were Robust Multichip Average (RMA) normalized. Chip normalization was to the 50th percentile and gene normalization was to control samples. Variances were assumed equal and Welch’s t-tests were performed on the data. A p-value cut-off for significance of 0.05 was used, as was a fold change of ± 2.
Interrogation of the gene expression changes using the Causal Reasoning Engine (CRE)
CRE is a recently developed computational platform that provides hypotheses on the upstream molecular events that best explain gene expression profiles by interrogating prior biological knowledge. The CRE model is similar to that of Pollard et al. (Pollard et al., 2005) using novel statistical measures and biological modeling tools (Chindelevitch et al., 2012). Briefly, CRE generates hypotheses with predicted polarity based on a number of statistical measures, including Enrichment and Correctness testing. For Enrichment we used Fisher’s exact test to evaluate the significance of a hypothesis, whereas Correctness tests the direction of the hypothesis (predicted decreased or increased). For example, a hypothesis of MAT1A is a CRE prediction of change in MAT1A enzymatic activity where a relatively significant number of the observed gene expression changes are known to be downstream of MAT1A, and the polarity of such gene expression changes supports a decreased directionality. In the CRE, the MeSH tag cloud is a visual approach that provides insight into the context of the generated hypotheses. Evidence for a particular molecular hypothesis is linked to one or more references in the literature. Most articles are indexed in Medline with Medical Subject Headings (MeSH terms) that describe key aspects of the article (e.g., “cardiac arrhythmia,” “blood,” “diabetes,” and “liver”). For each MeSH term the number of occurrences in the set of articles supporting the selected hypotheses is counted and compared to the general frequency of occurrence of the particular MeSH term in all articles underlying the causal network and statistical significance assessed by Fisher’s exact test. To visualize the results, a MeSH term tag cloud is displayed in which font size corresponds to statistical significance.
Alanine Aminotransferase (ALT) Assay
Plasma ALT activity was determined as an indicator of liver injury. Infinity ALT reagent (Thermotrace, Melbourne, Australia) was used according to manufacturer’s protocol.
RNA Isolation and Quantitative Real-Time Polymerase Chain Reaction (qRT-PCR)
RNAzol B reagent (Tel-test Inc., Friendswood, TX) was used to extract total mouse liver RNA according to the manufacturer’s protocol. cDNA was then made using an M-MLV RT kit (Invitrogen, Carlsbad, CA) according to the manufacturer’s protocol. Fmo3 and Lgals3 mRNA expression was quantified using β-actin for normalization. Primer pairs were synthesized by Integrated DNA Technologies (Coralville, IA) and are as follows: Fmo3 forward: 5′-GGA AGA GTT GGT GAA GAC CG-3′, reverse: 5′-CCC ACA TGC TTT GAG AGG AG-3′; Lgals3 forward: 5′-CGG ATA TCC TTG AGG GTT TG-3′, reverse: 5′-GTA CAG CTA GCG GAG CGG-3′. Amplification was carried out in a 10 μL reaction volume containing 4 μL diluted cDNA, SYBR Green PCR Master Mix (Applied Biosystems, Foster City, CA) and 0.5 μM of each primer. Amplification was performed with an Applied Biosystems 7500 Fast Real-Time PCR System.
Preparation of Homogenate, Crude Membrane and Cytosol Fractions
Liver homogenate, crude membrane and cytosol fractions were prepared as described previously (Aleksunes et al., 2006). Protein concentrations were determined using Bio Rad protein assay reagents (Bio-Rad Laboratories, Hercules, CA) according to the manufacturer’s instructions.
Western Blot Analysis
Cytosolic proteins were electrophoretically resolved using polyacrylamide gels and transblotted overnight at 4°C onto PVDF-Plus membrane (Micron Separations, Westborough, MA). Immunochemical detection of Lgals3 was carried out using an antibody against mouse Lgals3 protein (Santa Cruz Biotechnologies, Santa Cruz, CA) at a dilution of 1:1000 in 1% non-fat powdered milk. Membranes were blocked with 1% non-fat powdered milk in PBS-T for 1 hr and incubated with primary antibody for 1 hr. An anti rat peroxidase-labeled secondary antibody (Sigma Chemical Co., St. Louis, MO) was diluted (1:2000) in blocking buffer and incubated with blots for 1 hr. Protein-antibody complexes were detected using an ECL chemiluminescent kit (Amersham Life Sciences) and exposed to Fuji Medical X-ray film (Fisher Scientific, Pittsburgh, PA). Equal protein loading was confirmed using β-actin as loading control (ab8227, Abcam). Protein bands were detected and quantified using Quantity One ® 1-D Analysis Software (Bio-Rad Laboratories, Hercules, CA).
Immunohistochemistry
Immunohistochemical detection of Lgals3 protein was performed on sections of formalin-fixed, paraffin-embedded livers. Sections were deparaffinized in xylene, then rehydrated through a graded alcohol series. Endogenous peroxidase activity was blocked with a 10-min incubation in 3% H2O2 and antigen retrieval was performed for 10 min at 95°C using a sodium citrate buffer (10 mM). Avidin/Biotin blocking was performed with a commercial kit available through Vector Laboratories (Burlingame, CA). Sections were then incubated overnight with the Lgals3 primary antibody (Santa Cruz Biotechnologies, Santa Cruz, CA) at a dilution of 1:100. Vector Laboratories biotinylated rabbit anti-rat secondary antibody was then added for 30 min. Protein-antibody complexes were detected with the Vector Elite ABC reagent and developed using a DAB peroxidase substrate. Slides were counterstained with hematoxylin (Zymed) and then dehydrated using ethanol followed by xylene.
Statistical Analysis
Quantitative results were expressed as the mean ±SE. Statistical significance for results other than gene array was determined by a student’s t-test or a one-way ANOVA followed by a Newman-Keuls post-test when more than two groups were being compared. P-value cutoff was set to 0.05.
Results
APAP autoprotection in mice is a phenomenon that has been previously documented (Aleksunes et al., 2008b). In this model, mice are first pretreated with vehicle (controls) or 400 mg/kg APAP and then challenged 48 hr later with a higher dose of APAP (600 mg/kg) or vehicle. The severity of APAP liver injury was assessed by plasma alanine aminotransferase (ALT) and histopathological analysis. In vehicle-pretreated mice, plasma ALT values at 24 hr after APAP challenge were 1780 U/l whereas ALT values for APAP-pretreated mice receiving the same challenge dose of APAP were significantly reduced to 260 U/l. Other groups of mice were similarly treated and sacrificed 4 hr after APAP challenge. Historically, we have not seen elevations in plasma ALT values at this early time point and doses of APAP used. Liver samples from this previously published study were profiled using Affymetrix GeneChips to identify additional mechanisms of autoprotection.
Gene changes in mice protected from APAP hepatotoxicity by APAP pre-treatment
When comparing liver gene expression between vehicle controls and animals receiving both doses of APAP, or mice just receiving the second toxic dose of APAP, many genes were differentially regulated at both 4 and 24 hr after APAP or vehicle re-exposure. Four hours after the second dose of APAP, 617 genes were differentially expressed in animals that received both doses of APAP (AA4, autoprotected mice), and 470 genes were differentially expressed in mice receiving vehicle followed by APAP challenge (VA4). Twenty-four hours after APAP or vehicle re-exposure, 156 genes were differentially expressed in mice receiving both APAP treatments (AA24), while 1,788 genes were differentially expressed in mice receiving vehicle followed by APAP challenge (VA24; Table 1).
Table 1.
Genes Differentially Expressed in the APAP Autoprotection Model
| Comparison | Rationale | Number of differentially expressed genes at 4-hr after APAP or vehicle challenge (second dose) | Number of differentially expressed genes at 24-hr after APAP or vehicle challenge (second dose) |
|---|---|---|---|
| AA vs. VV | Genes differentially expressed in APAP autoprotection | 617 | 156 |
| VA vs. W | Gene differentially expressed by challenge dose only | 470 | 1788 |
Note: Numbers represent genes that were differentially regulated in each treatment group compared to their controls. Statistical significance was determined by a fold change higher than 2 or less thon 2 (p<0.05). A A: APAP pretreated, APAP challenged; W: vehicle pretreated, vehicle challenged; VA: vehicle pretreated, APAP challenged mice.
We initially attempted to identify genes involved in autoprotection by removing those genes that were in common between the AA24 and VA24 groups, and the AA4 and VA4 groups (Figure 1). These genes were considered to be mostly associated with the toxic response from the second dose of APAP rather than being potentially involved in protective compensatory responses produced by the protective dose of APAP. A total of 215 common genes was differentially expressed between mice receiving vehicle followed by a single toxic dose of 600 mg/kg APAP (VA4) and autoprotected mice (APAP 400 mg/kg + APAP 600 mg/kg; AA4). This gene cluster was eliminated from the initial list of differentially expressed genes (617) in the 4-hr autoprotected mice, leaving 402 genes unique to this dosing regimen (Figure 1A). The same comparison eliminated 80 differentially expressed genes from the total of 156 identified in the 24-hr autoprotected mice, leaving 76 genes (Table 1, Figure 1B). A comparison of the autoprotection-associated gene sets at 4 (402 genes) and 24 hours (76 genes) yielded 13 “autoprotection genes” in common (Figure 1c). Genes within these lists were then compared and reviewed to determine the potential significance and involvement of genes in APAP autoprotection. The identity of these genes and the directionality of gene expression changes are presented in Table 2. The full list of gene names from Table 1 used for the analysis presented in Figure 1 is presented in Supplemental Table 1. The same gene list was also used to generate the CRE hypotheses heatmap described below.
Figure 1. Venn diagrams showing overlaps in differential expression of hepatic genes for the treatment groups in the APAP autoprotection mouse model.
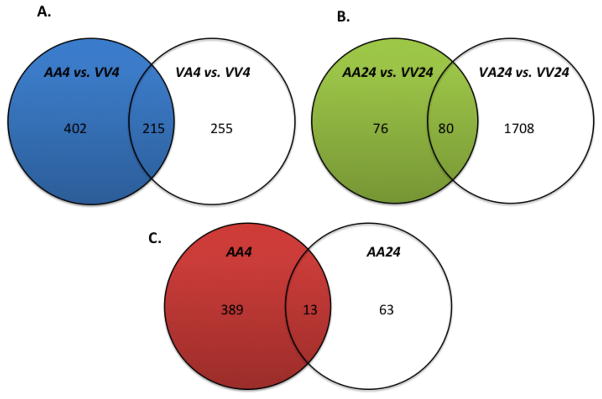
A cluster of 215 common genes differentially expressed between mice receiving vehicle followed by a single toxic dose of 600 mg/kg APAP (VA4) and autoprotected mice (APAP 400 mg/kg + APAP 600 mg/kg; AA4) was eliminated from the initial list of differentially expressed genes (617 genes) in the 4-hr autoprotected mice (A). This narrowed the number of unique genes in the AA4 group to 402. The same comparison removed 80 differentially expressed genes from a total of 156 identified in the AA24 group (B). Lastly, the 402 genes identified in the 4-hr autoprotection group (AA4) were compared to the 76 genes whose expression significantly changed in the 24-hr autoprotected mice (AA24) (C). This comparison identified 13 genes in common for both APAP autoprotection groups (AA4 and AA24).
Table 2.
Genes Differentially Expressed in the APAP Autoprotected Mice
| Fold Change | Gene Symbol | Gene Title |
|---|---|---|
| 3.73↓ | Hba-a1/Hba-a2 | hemoglobin alpha, adult chain 1 / hemoglobin alpha, adult chain 2 |
| 3.66↓ | Hbb-b1/Hbb-b2 | hemoglobin, beta adult major chain / hemoglobin, beta adult minor chain |
| 3.25↓ | Egfr | epidermal growth factor receptor |
| 2.43↓ | Oligl | oligodendrocyte transcription factor 1 |
| 2.76↓ | Retsat | retinol saturase (all trans retinol 13.14 reductase) |
| 2.60↓ | 5730414N17Rik | RIKEN cDNA 5730414N17 gene |
| 2.38↓ | Gpd2 | glycerol phosphate dehydrogenase 2. mitochondrial |
| 2.19↓ | GenBank ID:40014714 | |
| 2.15↓ | Hmgcs2 | 3-hydroxy-3-methy1glutaryl-Coenzyme A synthase 2 |
| 2.03↑ | Rrm2 | ribonucleotide reductase M2 |
| 3.53↑ | Anxa2 | annexin A2 |
| 3.19↑ | Fmo3 | flavin containing monooxygenase 3 |
| 2.11↑ | S 100a 11 | S100 calcium bindinq protein A11 (calqizzarin) |
Note: A comparison of gene sets in the APAP autoprotection groups at 4 and 24 hours (AA-4 and AA24) yielded 13 genes in common. The directionality of the change in gene expression is depicted by up or down arrows and the gene symbols and names and are also provided, except for one gene whose identity is not know (***).
Among the 13 genes in the common “autoprotection” group, there were several that were noteworthy. One of them was flavin-containing monooxygenase 3 (Fmo3), a gene that is normally not considered to be inducible, but in our studies was found to be up-regulated in mice receiving initial treatment with APAP (pre-treatment) as well as autoprotected mice. Fmo3 mRNA expression between autoprotected (AA4) and APAP-pretreated animals (AV4) sacrificed 4 hr after the second APAP dose is slightly higher than in 24 hr autoprotected mice (AA24) (Figure 2). Quantitative RT-PCR analysis using mouse Fmo3-specific primers also demonstrated increases in Fmo3 mRNA expression levels in autoprotected (AA4 and AA24) and in APAP pretreated (at 4 hr after receiving vehicle only as second dose, (AV4) mice (Figure 3). In comparison to controls, Fmo3 mRNA expression increased approximately 20-fold in autoprotected mice sacrificed 4 hr after the second dose of APAP (AA4), and 29-fold in APAP-pretreated mice sacrificed 4 hr after the second dose of vehicle (AV4). Fmo3 mRNA levels also increased by approximately 7-fold in autoprotected animals sacrificed 24 hr after the second APAP dose (AA24).
Figure 2. Scatter plot showing relative Fmo3 mRNA expression based on gene array data.
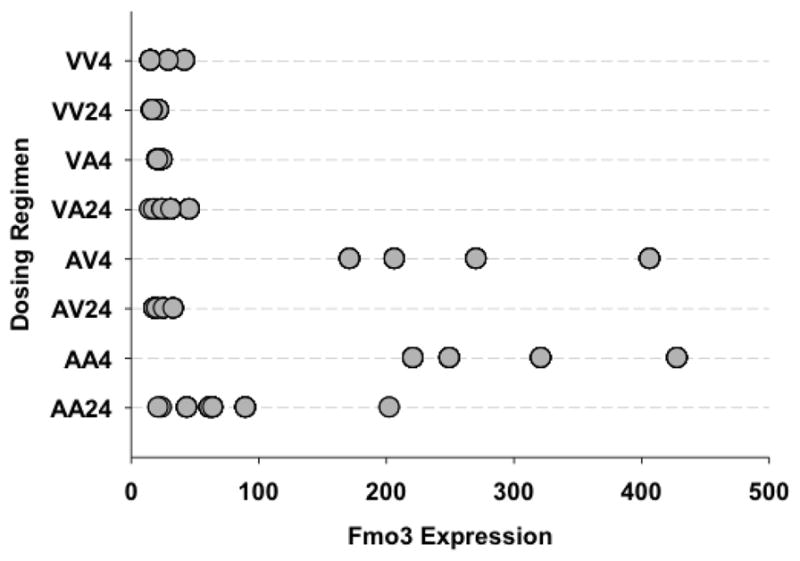
Individual animals and their relative Fmo3 mRNA expression are displayed according to dosing regimen.
VV4 – Vehicle pretreatment, vehicle challenge; sample analysis 4 hr after challenge.
VV24 – Vehicle pretreatment, vehicle challenge; sample analysis 24 hr after challenge
VA4 – Vehicle pretreatment, APAP challenge; sample analysis 4 hr after challenge
VA24 – Vehicle pretreatment, APAP challenge; sample analysis 24 hr after challenge
AV4 – APAP pretreatment, vehicle challenge; sample analysis 4 hr after challenge
AV24 – APAP pretreatment, vehicle challenge; sample analysis 24 hr after challenge
AA4 – APAP pretreatment, APAP challenge; sample analysis 4 hr after challenge
AA24 – APAP pretreatment, APAP challenge; sample analysis 24 hr after challenge
Figure 3. Fmo3 Quantitative Real Time-Polymerase Chain Reaction (qRT-PCR).
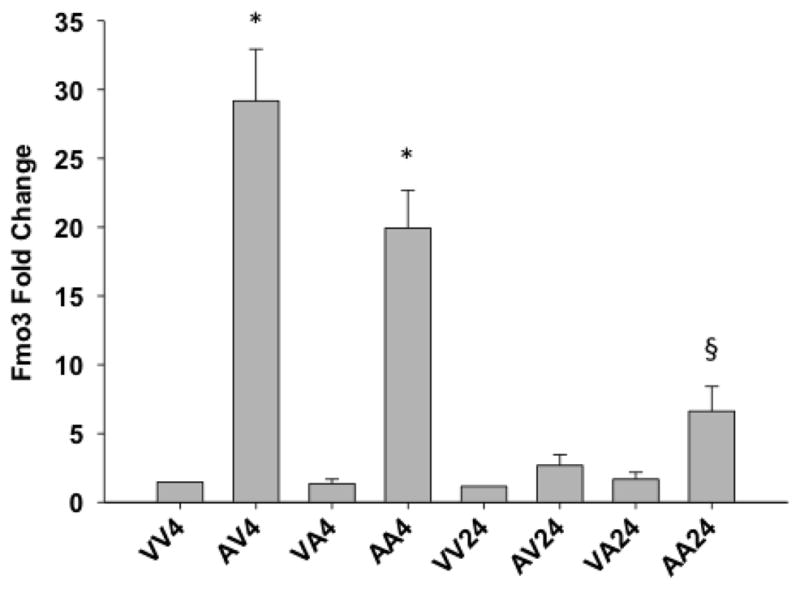
mRNA expression as measured by qRT-PCR using mouse primers specific for Fmo3. Error bars are expressed as standard error of the mean (SEM). One-way ANOVA was performed followed by the Newman Keuls post-test (* - significant with respect to VV4 and VA4 p < 0.001, § - significant with respect to VA24 p < 0.05; n = 4–8). See Figure 2 for description of treatment groups.
In order to examine the temporal changes in gene expression of Fmo3, a more detailed APAP time course study was performed. Animals were treated with APAP (400 mg/kg), as this is equivalent to the pre-treatment dose in the autoprotection model, and sacrificed 2, 4, 8, 12, 24 and 48 hr later. Figure 4A shows that ALT levels begin to increase 8 hr after APAP treatment, reaching statistical significance at 12 hr (164 U/L ± 47), and remaining significantly elevated at both 24 (120.87 U/L ± 52.65) and 48 hr (169 U/L ± 91). A time-dependent analysis of changes in liver Fmo3 mRNA levels was also carried out in mice receiving APAP (400 mg/kg) to determine the onset of changes in Fmo3 gene expression and to also determine its expression levels at 48 hr, which is the time point when mice would be receiving the second dose of APAP in the autoprotection model. The results in Figure 4B show that Fmo3 levels began to increase at 8 hr after APAP and by 48 hr, Fmo3 levels were 1,262-fold higher than in vehicle-treated control mice.
Figure 4. Plasma alanine aminotransferase (ALT) activity and quantitative RT-PCR analysis of liver Fmo3 transcripts following APAP (400 mg/kg) treatment.

After overnight fasting, mice received a single dose of either vehicle (controls) or 400 mg/kg APAP. Mice were sacrificed at different time-points over a 48-hr period. (A) Blood was collected and plasma prepared for determination of ALT activity as indicator of hepatotoxicity. Values are means + S.E.M. (B) Livers were also collected, RNA was isolated and cDNA was then made by using PowerScript Reverse Transcriptase. The cDNA samples were analyzed by RT-PCR using Fmo3 mouse-specific primers. Values are expressed as mean fold change + S.E.M. One-way ANOVA was performed followed by the Newman Keuls post-test (*p < 0.05, n = 4).
Fmo3 protein expression analysis was not possible due to the lack of commercially available antibodies that recognize mouse Fmo3. An anti-human FMO3 antibody provided by Dr. Ernest Hodgson (NC State University) was tested but did not recognize the mouse protein (data not shown). We recently developed an anti-Fmo3 antibody to specifically recognize the mouse product. Ongoing work in our laboratory is characterizing the conditions for use of this custom-made rabbit anti-mouse Fmo3 antibody.
Another gene found to be differentially expressed in the autoprotection group that was not part of the 13 genes identified above was protein disulfide isomerase like, testis expressed (Pdilt). This gene is downregulated by approximately 60% in livers of autoprotected mice (AA4 and AA24) in comparison to vehicle controls (Supplemental Figure 1). While the function of the protein encoded by this gene is not known, it is speculated that this novel protein disulfide isomerase (PDI) performs a specialized chaperone function in testicular cells. In addition, melanoma-associated transmembrane glycoprotein (Gpnmb) gene expression was increased by 2–4 fold in both groups of APAP autoprotected mice (AA4 and AA24) relative to the VV4 and VV24 controls (Supplemental Figure 2). Li et al. (2010) recently demonstrated a novel function for Gpnmb as a pro-repair gene.
Results of Causal Reasoning Engine (CRE) Analysis
Other than for Fmo3, there were no obvious biological explanations linking the remaining 12 genes listed in Table 2 to the APAP autoprotection response. Therefore, to gain further insight into the differential expression responses generated in the toxic and autoprotection models, the gene lists from Table 1 were also analyzed utilizing the CRE. CRE is a recently developed computational platform that provides hypotheses on the upstream molecular events that best explain gene expression profiles by interrogating prior biological knowledge (Enayetallah et al., 2011). The CRE hypotheses can be further integrated into molecular networks/pathways. The overall hypotheses generated from the AA4, AA24, VA4 and VA24 differentially expressed gene lists, implicated similar pathways/signals. The most statistically significant hypotheses were increased inflammation and increased response to oxidative stress. The major difference at the pathway level is between the AA24 and VA24 groups, where VA24 shows a strong signal for DNA damage supported by hypotheses such as response to DNA damage stimulus, TP53 and TP63. Additionally, several differences were observed with regard to the context of similar molecular perturbation in different comparisons (e.g. Nrf2 in AA4 versus VA4) as well as individual hypothesis differences (e.g., POR and MAT1A were the top ranking hypotheses in AA24 only). The list of all the significant hypotheses is shown in Supplemental Figure 3.
Nrf2 Hypothesis
Although there was significant overlap in the pathways and hypotheses activated in all four differential gene lists, the CRE analysis revealed potential differences in the biological context of similar hypotheses in the different comparisons. One example is the comparison of the evidence supporting Nrf2 at earlier time points (AA4 vs VA4). Nrf2, a transcription factor that binds to anti-oxidant response elements in response to oxidative stress, has a significantly different profile in the two comparisons: it ranks 7th and is supported by 38 correct gene expression changes in AA4, but is 18th and is supported by 17 correct gene expression changes in VA4. To evaluate the biological context for the observed gene expression changes associated with the Nrf2 inferences, we analyzed the MeSH terms associated with the changing genes. In the AA4 vs. VA4 group Nrf2 was supported by potentially adaptive/protective gene expression changes (Figure 5A), such as upregulation of the first rate-limiting enzyme of glutathione synthesis (glutamate-cysteine ligase catalytic subunit, GCLC), upregulation of glutathione transferases (e.g., GSTM3, GSTA5) and suggested hepatoprotectant enzymes such as NADPH quinone oxidoreductase 1 (NQO1), which has been proposed to protect against APAP toxicity by converting its toxic byproduct NAPQI to the parent form (Moffit et al., 2007a). This gene pattern is consistent with the ability of APAP-pretreated mice to tolerate toxicant re-exposure. None of these changes is observed under the Nrf2 hypothesis in the VA4 group (Figure 5B); instead, gene expression changes associated with apoptosis, such as upregulation of oxidative stress-induced growth inhibitor 1 (OSGIN1) were observed. This is consistent with the toxic manifestations seen in mice that are not receiving APAP pretreatment. Similarly, the MeSH analysis shows that “metabolic detoxification, drug” was the most significant MeSH term in the AA4 group, whereas “oxidative stress” was the most significant MeSH term in the VA4 group. Furthermore, Nrf2 evidence in the AA4 comparison originated from literature on the protective role of Nrf2 against APAP toxicity (Chan et al., 2001), while Nrf2 evidence in the VA4 comparison originated from literature of severe oxidative stress phenotypes (Leung et al., 2003).
Figure 5. The NFE2L2+ (Nrf2) hypotheses and supporting observed gene expression changes in A) AA4 and B) VA4.
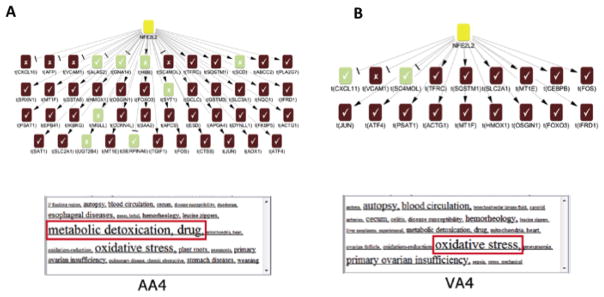
For each hypothesis a corresponding MeSH cloud provides a visualization of the most significantly enriched terms (indicated by font size). (yellow = predicted increase, red = observed increase in transcriptional level, green = observed decrease in transcriptional level)
MAT1A Hypothesis
The CRE analysis also predicts the decrease in methionine adenosyl transferase-1 alpha (MAT1A) enzymatic activity in the early autoprotected group (AA4), a hypothesis that is one of the most significant in the AA24 group (Figure 6). This hypothesis does not appear in the APAP pretreated only group (AV4) until 24 hours (AV24), albeit very weakly. This hypothesis ranks 4th in the AA24 group (Supplemental Figure 1), 48th in AA4 group, 70th in the VA24 group, and is not supported at all in the VA4 group. A reduction in MAT1A gene expression in autoprotected mice was unexpected since its enzyme product is responsible for the synthesis of S-adenosylmethionine (SAMe) from its precursor methionine. SAMe is the main biological methyl donor and is the precursor for polyamines and glutathione (Mato et al., 2002). A protective role for reduced MAT1A function seems counterintuitive since MAT1A null mice are more susceptible to liver injury (Lu et al., 2001). Furthermore, SAMe administration has been shown to protect against APAP hepatotoxicity (Brown et al., 2010). It is worth noting that the literature points out contrasting outcomes in liver function and pathology from transient versus chronic reduction in MAT1A function (Huang et al., 1998; Martinez-Chantar et al., 2002).
Figure 6. A causal reasoning graph of MAT1A- and the observed gene expression changes (evidence) at AA24 that supports this inference.
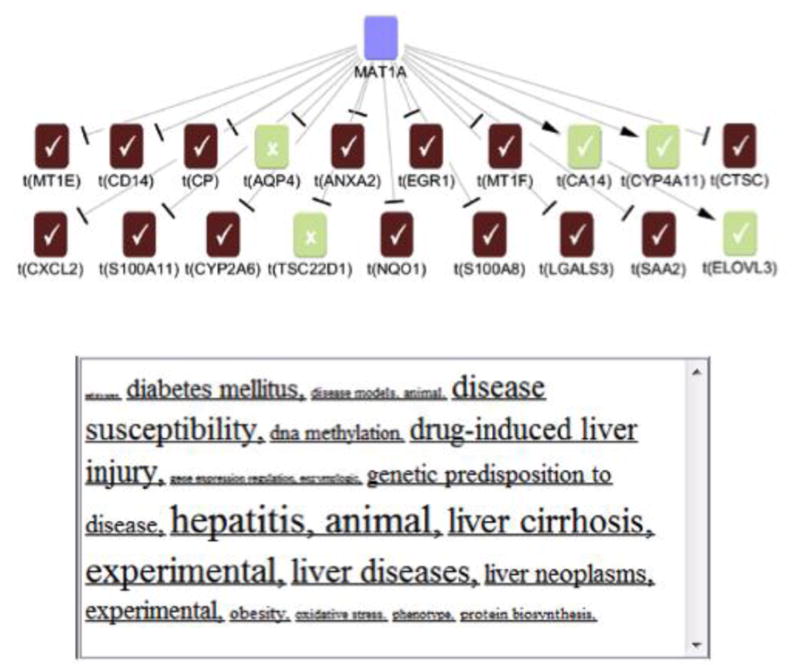
Blue = predicted decrease, red = observed increase, and green = observed decrease in transcriptional level.
Galectin-3 (Lgals3) is also differentially regulated in APAP autoprotected mice
One of the genes supporting the Mat1A hypothesis is Lgals3, a gene involved in a variety of biological functions such as inflammation, cancer progression and apoptosis (Nakahara et al., 2005). Results from the gene array show transient mRNA increases in autoprotected mice at both time points, as well as in mice pre-treated with APAP and sacrificed 4 hr after receiving vehicle (AV4) instead of APAP re-exposure (Figure 7A). Lgals3 mRNA expression was elevated approximately 3.4-fold in mice receiving the initial pretreatment of APAP (400 mg/kg) and sacrificed 4 hr after receiving vehicle only as the second dose (AV4) (Figure 7A). Lgals3 was also up-regulated 4.6- and 6.9-fold in autoprotected mice sacrificed 4 and 24 hr, respectively, after the second dose of APAP (AA4 and AA24). Confirmatory qRT-PCR using Lgals3 mouse-specific primers show similar increases in mRNA levels, which are significantly elevated only in autoprotected mice at 24 hr after administration of the second dose of APAP (AA24, Figure 7B).
Figure 7. (A) Scatter plot showing relative Lgals-3 mRNA expression from gene array data and Quantitative Real Time-Polymerase Chain Reaction (qRT-PCR).
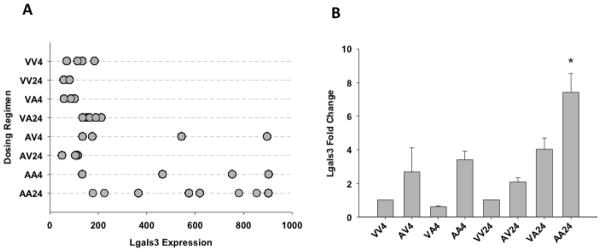
Individual animals and their relative Lgals3 mRNA expression are displayed according to dosing regimen (A). See Figure 2 for description of treatment groups. (B) After overnight fasting, mice received a single dose of either vehicle (controls) or 400 mg/kg APAP. Mice were sacrificed at different times points over a 48-hr period. Livers were collected, RNA was isolated and cDNA was then made by using PowerScript Reverse Transcriptase. The cDNA samples were analyzed by RT-PCR using Lgals3-specific primers. Values are expressed as mean fold change ± S.E.M. One-way ANOVA was performed followed by the Newman Keuls post-test (*p < 0.05; n = 4–8). See Figure 3 for description of treatment groups.
Protein expression of Lgals3 is not normally seen in the adult liver (Cerra et al., 1985). To determine if protein expression correlates with gene expression for Lgals3 after APAP treatment, western blot analysis was performed using the 24-hr liver samples. As expected, no detectable hepatic Lgals3 protein is present in control (non-APAP treated) livers (VV24) (Figure 8). However, Lgals3 protein levels are significantly elevated in livers of mice pretreated with APAP (AV24, 5-fold), as well as in mice receiving only the second dose of APAP (VA24, 3.5-fold). Autoprotected mice show Lgals3 protein elevation that is significantly greater than the other treatment groups (AA24, 6.7-fold). Figure 9 shows immunohistochemical analysis of Lgals3 protein localization. Protein staining is localized to centrilobular regions in both pre-treated and autoprotected livers (Figure 9.B and 9.D, respectively); this distinct staining pattern is not present in livers from vehicle or APAP challenged mice (Figure 9.A and 9.C, respectively). Figure 10 shows a lower magnification (4X) of liver Lgals3 staining representative of the AA24 group (autoprotected livers). This clearly illustrates selective Lgals3 staining in multiple centrilobular regions, with virtually no staining seen in other regions. Most importantly, the higher magnification insert (40X) shows than the majority of Lgals3 staining is localized to the hepatocytes. Some discrete staining can be seen in sinusoidal areas; however, the identity of non-parenchymal cells showing Lgals3 staining was not determined.
Figure 8. Western blots of liver Lgals3 liver expression after APAP treatment.
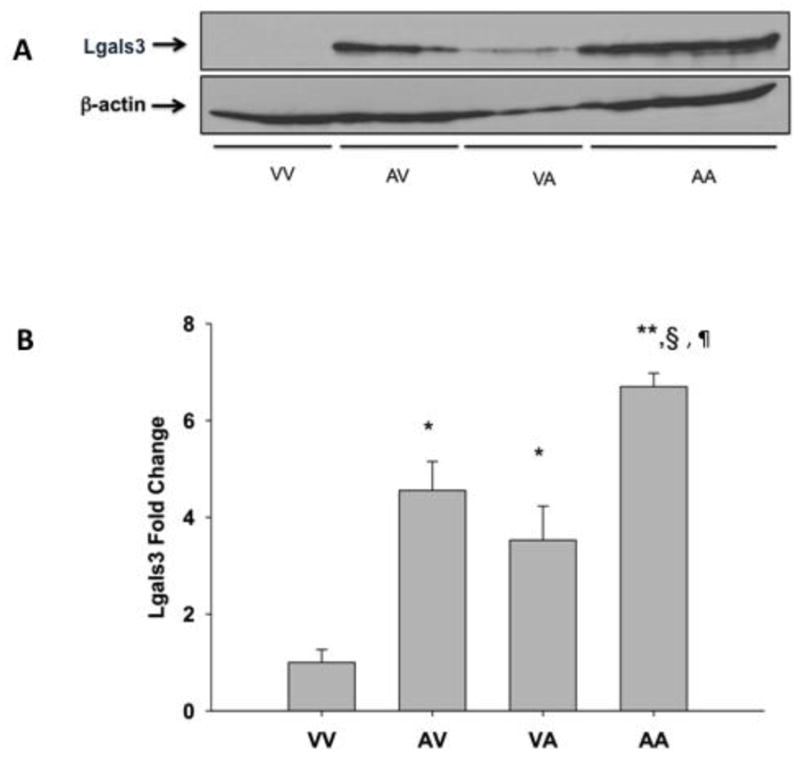
Mice were treated according to the autoprotection protocol described in the Materials and Methods. All liver tissues were obtained and processed 24 hr after treatment. Western blot of liver cytosol obtained from mice pretreated with vehicle and challenged with vehicle (VV), APAP pretreated-vehicle challenged (AV), vehicle pretreated-APAP challenged (VA) and APAP pretreated-APAP challenged mice (AA) were probed with an anti-Lgals3 antibody. Data are presented as blots (A), which each lane containing individual representative sample from mice in each group and as mean relative Lgals3 protein expression + S.E.M. Equal protein loading was confirmed by detection of β-actin. (B). One-way ANOVA was performed followed by the Newman Keuls post-test (* - significantly different from VV § - significantly different from AV and ¶ - significantly different from VA). p < 0.5; n = 3–4).
Figure 9. Immunohistochemical analysis of Lgals3 protein expression and localization after APAP treatment.

Twenty-four hr after treatment, livers from mice in the different treatment groups were fixed in zinc formalin and paraffin embedded. Immunochemical staining to detect Lgals3 was performed with the same antibody used for Western blotting. Antibody presence was detected using the DAB reagent. Panels (A) VV24, (B) AV24, (C) VA24 and (D) AA24; representative images are shown at a 20x magnification.
Figure 10. Immunohistochemical analysis of Lgals3 zonal localization depicted at low magnification.
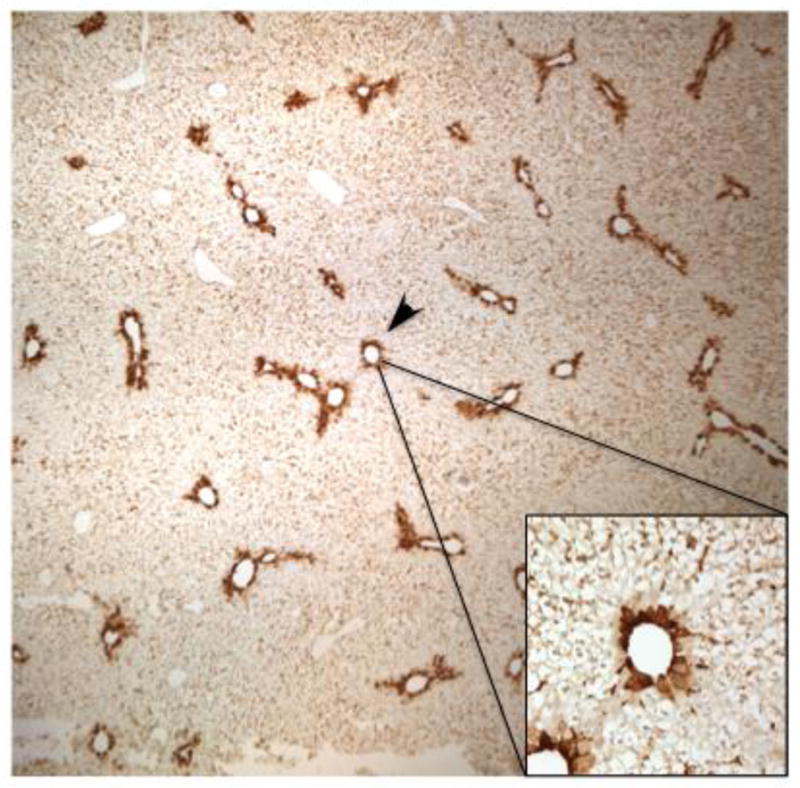
Lgals3 protein staining representative of the AA24 group is shown at a lower magnification (4X) to illustrate the selective centrilobular staining throughout the liver lobule with minimal staining in other regions. The higher magnification insert (40X) demonstrates than the virtually all Lgals3 staining is localized to hepatocytes.
Colchicine blocks APAP autoprotection as well as induction of Lgals3 protein expression
We previously showed that treatment with the anti-mitotic agent colchicine restores susceptibility to APAP re-exposure following APAP pre-treatment, presumably by preventing compensatory hepatocellular proliferation in areas of injury (Aleksunes et al., 2008a). To determine if induction of Lgals3 protein is dependent on hepatocellular proliferation, immunohistochemical analysis was performed using livers from the different APAP treatment regimens. The results show that APAP-induced elevation in Lgals3 protein expression (Figure 11A) is prevented by colchicine treatment (Figure 11B). This indicates that Lgals3 protein induction occurs in association with the hepatocellular proliferation that occurs after APAP pretreatment.
Figure 11. Immunohistochemical analysis of Lgals3 protein expression after APAP treatment in the presence or absence of colchicine co-treatment.
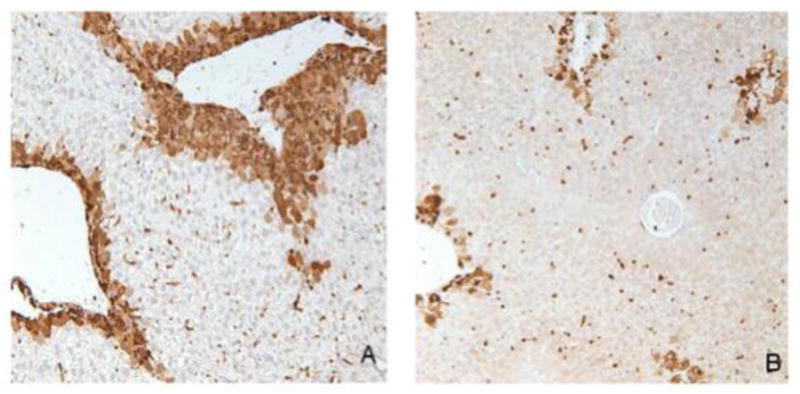
Twenty-four hr after treatment, livers from mice in the different treatment groups were fixed in zinc formalin and paraffin embedded. Immunochemical staining to detect Lgals3 was performed with the same antibody used for Western blotting. Antibody presence was detected using the DAB reagent. Panels (A) AA24 and (B) AA24 + colchicine; representative images are shown at a 20x magnification.
Discussion
Previous work in our laboratory indicates that induction of the liver efflux transporter multidrug resistance-associated protein 4 (Mrp4) and compensatory cellular proliferation after administration of mildly hepatotoxic doses of APAP are potentially involved in the development of tolerance to subsequent APAP administration in mice (Aleksunes et al., 2008a). However, it is possible that other factors also contribute to the development of tolerance to APAP toxicity. This would be consistent with other models of resistance to cytotoxicity by chemicals as seen in cancer multi-drug resistance, which is known to have a multi-factorial phenotype. Genome-wide microarray studies can provide relevant information on altered biological processes in response to xenobiotic treatment or in different pathological conditions. However, analysis and manual interpretation of changes of thousands of gene transcripts can be a painstaking process. Multiple approaches for curating gene expression data are available to facilitate the interpretation of gene expression changes and their biological significance. A prominent challenge with these methodological approaches continues to be the accurate prediction of upstream regulatory pathways controlling patterns in gene expression obtained from microarrays. In the present study the AA4, AA24, VA4 and VA24 differentially expressed gene lists from the APAP autoprotection groups were analyzed individually, and at the pathway level using the Causal Reasoning Engine. The CRE is a recently developed computational algorithm that generates networks of molecular interactions in the context of prior biological knowledge to leverage the observed transcriptional changes and provide hypotheses on the upstream events that likely caused such changes.
In the current studies, after applying a cut-off level for significance at p<0.05 and a fold change greater than +/− 2.0, we found many genes that were differentially expressed after APAP pretreatment only (400 mg/kg) and in the APAP autoprotection treatment regimen (400 mg/kg followed by 600 mg/kg 48 hr later). Further filtering of these genes by eliminating those whose expression was significantly changed following APAP challenge only (600 mg/kg) provided a narrower group of candidate genes that might be associated with development of APAP tolerance.
Across all dosing regimens involving APAP pretreatment and the autoprotection groups, one gene that was markedly up-regulated was Fmo3, a gene that is normally not considered to be inducible (Krueger and Williams, 2005; Cashman and Zhang, 2006; Hines, 2006), but in our studies we found to be upregulated in mice receiving intital treatment by APAP as in the APAP autoprotected mice. Quantitative RT-PCR confirmed these increases in Fmo3 gene expression by APAP. Flavin-containing monooxygenases comprise a family of xenobiotic-metabolizing enzymes that share some characteristics with cytochromes P450 (Lawton et al., 1991). Fmo3 is a NADPH- and O2-dependent microsomal enzyme that oxygenates many nucleophilic heteroatom-containing chemicals. Similar to our findings, Fmo3 was recently shown to be inducible both in vitro in Hepa-1 cells and in vivo in mouse liver by the aryl hydrocarbon receptor (AhR) ligands such as 3-methylcholanthrene and benzo[a]pyrene (Celius et al., 2010). Our follow-up detailed APAP time-course study also showed remarkable elevations in Fmo3 gene expression occurring concurrently with elevations in plasma ALT levels. This suggests that certain degree of hepatocellular injury is necessary for Fmo3 mRNA induction. Furthermore, Fmo3 gene expression in this time-course study reached a 1200-fold increase by 48 hr in comparison to vehicle controls, which should translate into significant increases in protein expression and function. Unfortunately, there are no commercially available antibodies that recognize mouse Fmo3 to enable us to determine the magnitude of changes in protein expression induced by APAP. Due to the absence of scientific evidence showing how Fmo3 induction could alter liver function and susceptibility to toxic xenobiotics, it is difficult to speculate on the relevance and importance of this induction in Fmo3 gene expression. Nevertheless, the profound changes in Fmo3 mRNA levels seen in association with development of tolerance to APAP toxicity (>1,200-fold increase) underscore the potential significance of this response.
Given the fact that Fmo3 is not known to metabolize APAP or its known metabolites, and that most metabolic products of Fmo3 are considered to be non-toxic, it is possible that Fmo3 may be involved in the biosynthesis and/or conversion of an endogenous molecule involved in activating signal transduction pathways leading to APAP autoprotection. It is also worth noting that female mice are much more resistant to APAP hepatotoxicity than males (Dai et al., 2006), and that female mouse liver contains approximately 80 times more Fmo3 mRNA than males (Janmohamed et al., 2004). The reason for this gender-related difference and the potential role of higher hepatic Fmo3 gene expression in conferring tolerance to APAP hepatotoxicity are unknown and warrant further investigation.
Another gene found to be differentially expressed in the autoprotection list was protein disulfide isomerase like, testis expressed (Pdilt). While the function of the protein encoded by this gene is not known, it is speculated that this novel protein disulfide isomerase (PDI) performs a specialized chaperone function in testicular cells (van Lith et al., 2005). PDI belongs to the thioredoxin superfamily of enzymes involved in redox reactions, specifically reducing thiols. PDI also is part of the cluster of proteins involved in endoplasmic reticulum stress response and also possesses protein chaperoning functions (Laurindo et al., 2012). It is unclear why a gene with potential cytoprotective function would be downregulated in mice resistant to APAP hepatotoxicity.
In addition, melanoma-associated transmembrane glycoprotein (Gpnmb) gene expression was increased in both groups of APAP autoprotected mice. Li et al. (Li et al., 2010) recently demonstrated a novel function for Gpnmb as a pro-repair gene. Gpnmb is up-regulated during kidney repair following ischemic damage. The same study also showed that Gpnmb is a phagocytic protein essential for recruitment of the autophagy protein LC3 to the phagosome and for lysosomal fusion with the phagosome, thus contributing to tissue repair by promoting the breakdown of phagocytosed material. Consistent with induction of an autophagy-related gene in the APAP autoprotected mice in the current studies, recent studies have demonstrated the protective role of autophagy activation during APAP toxicity (Igusa et al., 2012; Ni et al., 2012).
Individual gene analysis is a good first approach to understanding the perturbed biology, but is usually limited and/or lacks the ability to provide detailed molecular hypotheses. However, because individual genes also comprise networks and pathways, some of which have overlapping members, we also used a novel causal reasoning approach to compare the responses in the different treatment groups. Causal reasoning is a form of gene set enrichment with two main enhancements. First, this method provides predictions on molecular drivers by using gene sets corresponding to the effects of defined molecular perturbations. Second, it accounts for directionality of the transcriptional changes and hence the directionality of the generated hypothesis can be computed (Enayetallah et al., 2011). Causal reasoning facilitates the analysis of large-scale data sets such as gene microarray experiments with the advantage of inferring biological perturbations that cannot be observed at the transcriptional level. This allows us to infer the actual functional status of genes or proteins (increase or decrease) even if their transcriptional level did not change (e.g., proteins whose functions are regulated non-transcriptionally), or if transcriptional change contradicts functional change due to feedback loops (e.g., increased protein function that subsequently induces a negative feedback loop to lower its transcription level).
The CRE analysis predicted that the changes in gene expression in all four comparisons support an induction of the Nrf2 hypothesis. Nrf2 is a well-studied transcription factor that mediates induction of a large number of detoxification and biotransformation enzymes, as well as efflux transporters (reviewed in (Aleksunes and Manautou, 2007; Bataille and Manautou, 2012). Its activation in response to oxidative or electrophilic stress is well documented and its transcriptional regulatory activity plays a pivotal role in the detoxification and elimination of potentially harmful chemicals and in the development of resistance to toxic xenobiotic exposure. In fact, previous studies document the involvement of Nrf2 in APAP toxicity (Chan et al., 2001; Enomoto et al., 2001; Okawa et al., 2006). In agreement with the Nrf2 hypothesis, our previous studies showed that induction of hepatic Mrp4 expression in association with the APAP autoprotection mouse model is dependent on Nrf2 expression and function (Aleksunes et al., 2008c). Although CRE analysis in the present study clearly established that the Nrf2 hypothesis was significant in all four genes lists, it further identified differences in the biological context of the Nrf2 response in the different treatment groups. For example, in mice receiving vehicle prior to APAP challenge (VA4), the Nrf2 hypothesis was supported by differential expression of genes primarily associated with initiation of oxidative stress and apoptosis. This is consistent with an early response to APAP (4 hr after treatment) in mice that were not pretreated with APAP. By contrast, the Nrf2 hypothesis in autoprotected mice at the same time point (AA4) was supported by a gene expression pattern consistent with a robust antioxidant/protective response, which is an expected compensatory response to the APAP pretreatment.
There are dual implications to the identification of an Nrf2 hypothesis via CRE analysis. First, it provides further validity to this computational approach as a reliable tool for predicting upstream regulatory factors of differential gene expression profiles, and second, it validates our mouse model of autoprotection since a Nrf2 response was anticipated.
The CRE analysis also predicted a decrease in MATA1 expression and function in the early autoprotected mice (AA4). MATA1A is expressed primarily in liver and is responsible for the synthesis of S-adenosylmethionine (SAMe) from its precursor methionine. SAMe is the main biological methyl donor and precursor for polyamines and glutathione synthesis (Mato et al., 2002). Reduced MAT1A expression in mice that are tolerant to APAP re-exposure was unexpected based on what is known about this gene and its function. Not only do MAT1A-null mice have heightened susceptibility to liver injury (Lu et al., 2001), but also treatment with SAMe protects against APAP hepatotoxicity (Brown et al., 2010). An intriguing aspect of this protein is that transient versus chronic reduction in MAT1A function has contrasting phenotypic features (Huang et al., 1998; Martinez-Chantar et al., 2002). Genetic deficiency in MAT1A results in higher incidence of liver injury in mice fed a choline-methionine deficient diet or by carbon tetrachloride treatment. Also, MAT1A-null mice of approximately eight months in age develop spontaneous microvesicular steatosis. Another phenotype of the MAT1A null mice is abnormal hepatic growth leading to hepatocellular carcinomas (Martinez-Chantar et al., 2002).
By contrast, a transient but significant fall in hepatic SAMe has been shown to precede compensatory liver regeneration after partial hepatectomy in rats (Huang et al., 1998). This fall in SAMe levels is seen in association with lower MATA1 gene expression and protein function. Further support to the concept that transient reduction in MAT1A function is critical to proper liver regeneration and recovery is provided by the studies by Valera-Rey et al (Varela-Rey et al., 2009) who demonstrated that normal hepatocellular regeneration following partial hepatectomy is prevented by exogenous SAMe administration. From this information, we propose that a reduction in MAT1A, as predicted by CRE in the AA4 group, is essential for the repair and regeneration in autoprotected mice early after APAP treatment. The mechanisms by which transient reductions in MAT1A function and SAMe levels contribute to compensatory regeneration require further investigation.
One of the genes supporting the MAT1A reduced function hypothesis is Lgals3. The identification of Lgals3 as a significantly up-regulated gene following APAP exposure suggested that in addition to antioxidant, drug-metabolizing enzymes and drug transporters, there are other classes of genes that may play a role in the development of resistance to APAP hepatotoxicity. Lgals3 is an intriguing gene because of its involvement in inflammatory responses, cell proliferation, apoptosis and cancer (Yang et al., 1996; Liu and Hsu, 2007; Radosavljevic et al., 2012). The use of Lgals3-deficient mice has provided evidence for this protein’s contribution to the inflammatory response. While our genomic data support a protective role of Lgals3 in the APAP autoprotection model, Laskin and co-workers (Dragomir et al., 2012a; Dragomir et al., 2012b) published a study documenting the role of Lgals3 in promoting inflammatory liver damage in response to APAP treatment. Their study showed that Lgals3−/− mice have reduced hepatotoxicity in response to APAP treatment. This was associated with fewer neutrophils present in livers of Lgals3−/− mice only at late stages in the progression and resolution of APAP toxicity (72 hr after treatment). Similarly, the expression of several inflammatory proteins was lower in Lgals3−/− mice treated with APAP in comparison to wild-types. In wild-type mice, APAP treatment induced liver Lgals3 expression. Lgals3 protein was absent in livers of vehicle treatment mice. In APAP livers, Lgals3 expression was primarily confined to macrophages that had infiltrated to areas of injury. Overall, the authors concluded that Lgals3 promotes a late pro-inflammatory liver response following toxic APAP exposure.
A significant distinction between our Lgals3 protein expression analysis and that of Laskin’s is the localization of induced Lgasl3 in liver. In contrast to their macrophage-specific expression, our studies showed that induction of Lgals3 protein is localized to hepatocytes in centrilobular regions, which are the areas of active injury and repair following APAP treatment in our autoprotection mouse model. Enhanced Lgals3 expression also correlates with the zonal localization of Mrp4 and PCNA induction seen in our previous studies (Aleksunes et al., 2008a). Lgals3 mRNA expression is increased following a single challenge dose of APAP (600 mg/kg) (Figure 7); however, the level of induction is of lower magnitude than that seen in autoprotected mice and in mice receiving APAP pretreatment only. This suggests that in our autoprotection mouse model, hepatocytes up-regulate Lgals3 to somehow help in the regeneration and recovery from a toxic APAP insult. However, in the case of a single toxic dose of APAP protein up-regulation either does not reach its peak expression 24 hr later or the induction is less pronounced than with the lower dose of APAP used as pretreatment (400 mg/kg). Others have shown that Lgals3 induction correlates with liver tissue repair and cellular proliferation as indicated by immunochemical co-localization of Lgals3 and with proliferating cell nuclear antigen staining (Yamazaki et al., 2001). Other studies have reported that Lgals3 can prevent apoptosis following reactive oxygen species stimulus by preventing caspase signaling and by preserving mitochondrial membrane integrity (Matarrese et al., 2000; Yu et al., 2002). In agreement with the results by Dragomir et al. (Dragomir et al., 2012b) with APAP, targeted disruption of Lgals3 gene heightens resistance of mice to concanavalin-A liver hepatitis (Volarevic et al., 2012). This response was associated with a lower number of activated lymphoid and dendritic cells present in liver in comparison to wild-type mice receiving concanavalin-A. Collectively, these two studies point toward a pro-inflammatory, pro-damaging role of Lgals3 function in activated immune cells.
Lgals3 and its role in inflammatory diseases is conflicting and controversial according to the literature. Illustrative of this is the conflicting findings on the role of Lgals3 in apoptosis signaling. The location of Lgals3 expression influences the type of function and/or effect produced by this protein. Intracellular Lgals3 expression has been shown to prevent apoptosis in various cell systems under different experimental conditions (Nakahara et al., 2005). On the opposite side of the spectrum, extracellular (secreted) Lgals3 expression induces apoptosis of T-cells, for example, through autocrine and/or paracrine mechanisms. The role of Lgals3 in APAP hepatotoxicity warrants further investigation in the context of its function when the protein is primarily expressed in hepatocytes instead of in infiltrating immune cells.
In conclusion, the results of current studies suggest that the mechanism by which tolerance against APAP hepatotoxicity develops in our models of autoprotection is multi-factorial. Compensatory cellular proliferation and increased expression of the efflux transporter Mrp4 have been previously associated with enhanced resistance of the liver to APAP toxicity (Aleksunes et al., 2008a). In the present study, up-regulation of Fmo3 mRNA and Lgals3 mRNA and protein points toward a potential role of both these genes in the development of tolerance to APAP hepatotoxicity. Their precise function and role of these genes during APAP hepatotoxicity and recovery is the subject of current investigations in our laboratory. These studies also show two distinct gene expression patterns supporting contrasting Nrf2 responses; one consistent with the strong antioxidant/protective response seen in mice pretreated and then challenged with APAP, while the second pattern of gene expression supports an Nrf2 response consistent with the initiation of oxidative stress and apoptosis seen early following toxicant treatment. Lastly, these studies point toward a potentially novel role of transient reductions in MAT1A expression in compensatory hepatocellular proliferation following APAP treatment.
Supplementary Material
Highlights.
Differential expression of hepatic genes in mice resistant to acetaminophen hepatotoxicity.
Flavin-containing monooxygenase 3 and galectin-3 gene expression is significantly increased.
Decrease in MAT1A expression in compensatory hepatocellular proliferation may be important
Two distinct gene expression patterns support contrasting Nrf2 responses.
Genomics identification of pathways potentially relevant to resistance to APAP hepatotoxicity.
Acknowledgments
This work was supported by the National Institute of Diabetes and Digestive and Kidney Diseases [DK069557, DK080774], the National Institute of Environmental Health Sciences [ES005022] and by Pfizer Inc.
Abbreviations
- APAP
Acetaminophen
- ALT
alanine aminotransferase
- CCl4
carbon tetrachloride
- CFB
clofibrate
- i.p
intraperitoneal
- Fmo3
flavin-containing monooxygenase 3
- Lgals3
galectin-3
- H202
hydrogen peroxide
- MAT1A
methionine adenosyl transferase-1 alpha
- Mrp
multidrug resistance-associated protein
- MMLV-RT
moloney murine leukemia virus reverse transcriptase
- NFE2L2 or Nrf2
nuclear factor (erythroid-derived 2)-like 2
- PPAR
peroxisome proliferator activated receptor
- qRT-PCR
quantitative Real Time-Polymerase Chain Reaction
- Vnn1
Vanin 1
- WT
wild type
Footnotes
Conflict of Interest Statement
The authors do not have interests which conflict with publication of the data in this manuscript.
Publisher's Disclaimer: This is a PDF file of an unedited manuscript that has been accepted for publication. As a service to our customers we are providing this early version of the manuscript. The manuscript will undergo copyediting, typesetting, and review of the resulting proof before it is published in its final citable form. Please note that during the production process errors may be discovered which could affect the content, and all legal disclaimers that apply to the journal pertain.
Contributor Information
Meeghan A O’Connor, Email: meeghan.oconnor@boehringer-ingelheim.com.
Petra Koza-Taylor, Email: petra.h.koza-taylor@pfizer.com.
Sarah N Campion, Email: sarah.campion@pfizer.com.
Lauren M Aleksunes, Email: aleksunes@eohsi.rutgers.edu.
Xinsheng Gu, Email: xinsheng.gu@uconn.edu.
Ahmed E. Enayetallah, Email: ahmed.enayetallah@pfizer.com.
Michael P Lawton, Email: michael.lawton@pfizer.com.
José E Manautou, Email: jose.manautou@uconn.edu.
References
- Aleksunes LM, Campion SN, Goedken MJ, Manautou JE. Acquired resistance to acetaminophen hepatotoxicity is associated with induction of multidrug resistance-associated protein 4 (Mrp4) in proliferating hepatocytes. Toxicol Sci. 2008a;104:261–273. doi: 10.1093/toxsci/kfn093. [DOI] [PMC free article] [PubMed] [Google Scholar]
- Aleksunes LM, Campion SN, Goedken MJ, Manautou JE. Acquired resistance to acetaminophen hepatotoxicity is associated with induction of multidrug resistance-associated protein 4 (Mrp4) in proliferating hepatocytes. Toxicol Sci. 2008b;104:261–273. doi: 10.1093/toxsci/kfn093. [DOI] [PMC free article] [PubMed] [Google Scholar]
- Aleksunes LM, Manautou JE. Emerging role of Nrf2 in protecting against hepatic and gastrointestinal disease. Toxicol Pathol. 2007;35:459–473. doi: 10.1080/01926230701311344. [DOI] [PubMed] [Google Scholar]
- Aleksunes LM, Scheffer GL, Jakowski AB, Pruimboom-Brees IM, Manautou JE. Coordinated expression of multidrug resistance-associated proteins (Mrps) in mouse liver during toxicant-induced injury. Toxicol Sci. 2006;89:370–379. doi: 10.1093/toxsci/kfi332. [DOI] [PubMed] [Google Scholar]
- Aleksunes LM, Slitt AL, Maher JM, Augustine LM, Goedken MJ, Chan JY, Cherrington NJ, Klaassen CD, Manautou JE. Induction of Mrp3 and Mrp4 transporters during acetaminophen hepatotoxicity is dependent on Nrf2. Toxicol Appl Pharmacol. 2008c;226:74–83. doi: 10.1016/j.taap.2007.08.022. [DOI] [PMC free article] [PubMed] [Google Scholar]
- Bataille AM, Manautou JE. Nrf2: a potential target for new therapeutics in liver disease. Clin Pharmacol Ther. 2012;92:340–348. doi: 10.1038/clpt.2012.110. [DOI] [PMC free article] [PubMed] [Google Scholar]
- Brown JM, Ball JG, Hogsett A, Williams T, Valentovic M. Temporal study of acetaminophen (APAP) and S-adenosyl-L-methionine (SAMe) effects on subcellular hepatic SAMe levels and methionine adenosyltransferase (MAT) expression and activity. Toxicol Appl Pharmacol. 2010;247:1–9. doi: 10.1016/j.taap.2010.04.018. [DOI] [PMC free article] [PubMed] [Google Scholar]
- Cashman JR, Zhang J. Interindividual differences of human flavin-containing monooxygenase 3: genetic polymorphisms and functional variation. Drug Metab Dispos. 2002;30:1043–1052. doi: 10.1124/dmd.30.10.1043. [DOI] [PubMed] [Google Scholar]
- Cashman JR, Zhang J. Human flavin-containing monooxygenases. Annu Rev Pharmacol Toxicol. 2006;46:65–100. doi: 10.1146/annurev.pharmtox.46.120604.141043. [DOI] [PubMed] [Google Scholar]
- Celius T, Pansoy A, Matthews J, Okey AB, Henderson MC, Krueger SK, Williams DE. Flavin-containing monooxygenase-3: induction by 3-methylcholanthrene and complex regulation by xenobiotic chemicals in hepatoma cells and mouse liver. Toxicology and applied pharmacology. 2010;247:60–69. doi: 10.1016/j.taap.2010.05.018. [DOI] [PMC free article] [PubMed] [Google Scholar]
- Cerra RF, Gitt MA, Barondes SH. Three soluble rat beta-galactoside-binding lectins. J Biol Chem. 1985;260:10474–10477. [PubMed] [Google Scholar]
- Chan K, Han XD, Kan YW. An important function of Nrf2 in combating oxidative stress: detoxification of acetaminophen. Proc Natl Acad Sci U S A. 2001;98:4611–4616. doi: 10.1073/pnas.081082098. [DOI] [PMC free article] [PubMed] [Google Scholar]
- Chen C, Hennig GE, Whiteley HE, Corton JC, Manautou JE. Peroxisome proliferator-activated receptor alpha-null mice lack resistance to acetaminophen hepatotoxicity following clofibrate exposure. Toxicol Sci. 2000;57:338–344. doi: 10.1093/toxsci/57.2.338. [DOI] [PubMed] [Google Scholar]
- Chindelevitch L, Ziemek D, Enayetallah A, Randhawa R, Sidders B, Brockel C, Huang ES. Causal reasoning on biological networks: interpreting transcriptional changes. Bioinformatics. 2012;28:1114–1121. doi: 10.1093/bioinformatics/bts090. [DOI] [PubMed] [Google Scholar]
- Dai G, He L, Chou N, Wan YJ. Acetaminophen metabolism does not contribute to gender difference in its hepatotoxicity in mouse. Toxicol Sci. 2006;92:33–41. doi: 10.1093/toxsci/kfj192. [DOI] [PubMed] [Google Scholar]
- Dragomir AC, Sun R, Choi H, Laskin JD, Laskin DL. Role of galectin-3 in classical and alternative macrophage activation in the liver following acetaminophen intoxication. J Immunol. 2012a;189:5934–5941. doi: 10.4049/jimmunol.1201851. [DOI] [PMC free article] [PubMed] [Google Scholar]
- Dragomir AC, Sun R, Mishin V, Hall LB, Laskin JD, Laskin DL. Role of galectin-3 in acetaminophen-induced hepatotoxicity and inflammatory mediator production. Toxicol Sci. 2012b;127:609–619. doi: 10.1093/toxsci/kfs117. [DOI] [PMC free article] [PubMed] [Google Scholar]
- Enayetallah AE, Ziemek D, Leininger MT, Randhawa R, Yang J, Manion TB, Mather DE, Zavadoski WJ, Kuhn M, Treadway JL, des Etages SA, Gibbs EM, Greene N, Steppan CM. Modeling the mechanism of action of a DGAT1 inhibitor using a causal reasoning platform. PLoS One. 2011;6:e27009. doi: 10.1371/journal.pone.0027009. [DOI] [PMC free article] [PubMed] [Google Scholar]
- Enomoto A, Itoh K, Nagayoshi E, Haruta J, Kimura T, O’Connor T, Harada T, Yamamoto M. High sensitivity of Nrf2 knockout mice to acetaminophen hepatotoxicity associated with decreased expression of ARE-regulated drug metabolizing enzymes and antioxidant genes. Toxicol Sci. 2001;59:169–177. doi: 10.1093/toxsci/59.1.169. [DOI] [PubMed] [Google Scholar]
- Hines RN. Developmental and tissue-specific expression of human flavin-containing monooxygenases 1 and 3. Expert Opin Drug Metab Toxicol. 2006;2:41–49. doi: 10.1517/17425255.2.1.41. [DOI] [PubMed] [Google Scholar]
- Huang ZZ, Mao Z, Cai J, Lu SC. Changes in methionine adenosyltransferase during liver regeneration in the rat. Am J Physiol. 1998;275:G14–21. doi: 10.1152/ajpgi.1998.275.1.G14. [DOI] [PubMed] [Google Scholar]
- Igusa Y, Yamashina S, Izumi K, Inami Y, Fukada H, Komatsu M, Tanaka K, Ikejima K, Watanabe S. Loss of autophagy promotes murine acetaminophen hepatotoxicity. J Gastroenterol. 2012;47:433–443. doi: 10.1007/s00535-011-0500-0. [DOI] [PubMed] [Google Scholar]
- Janmohamed A, Hernandez D, Phillips IR, Shephard EA. Cell-, tissue-, sex- and developmental stage-specific expression of mouse flavin-containing monooxygenases (Fmos) Biochemical pharmacology. 2004;68:73–83. doi: 10.1016/j.bcp.2004.02.036. [DOI] [PubMed] [Google Scholar]
- Krueger SK, Williams DE. Mammalian flavin-containing monooxygenases: structure/function, genetic polymorphisms and role in drug metabolism. Pharmacol Ther. 2005;106:357–387. doi: 10.1016/j.pharmthera.2005.01.001. [DOI] [PMC free article] [PubMed] [Google Scholar]
- Larson AM, Polson J, Fontana RJ, Davern TJ, Lalani E, Hynan LS, Reisch JS, Schiodt FV, Ostapowicz G, Shakil AO, Lee WM. Acetaminophen-induced acute liver failure: results of a United States multicenter, prospective study. Hepatology. 2005;42:1364–1372. doi: 10.1002/hep.20948. [DOI] [PubMed] [Google Scholar]
- Laurindo FR, Pescatore LA, de Fernandes DC. Protein disulfide isomerase in redox cell signaling and homeostasis. Free Radic Biol Med. 2012;52:1954–1969. doi: 10.1016/j.freeradbiomed.2012.02.037. [DOI] [PubMed] [Google Scholar]
- Lawton MP, Kronbach T, Johnson EF, Philpot RM. Properties of expressed and native flavin-containing monooxygenases: evidence of multiple forms in rabbit liver and lung. Mol Pharmacol. 1991;40:692–698. [PubMed] [Google Scholar]
- Leung L, Kwong M, Hou S, Lee C, Chan JY. Deficiency of the Nrf1 and Nrf2 transcription factors results in early embryonic lethality and severe oxidative stress. J Biol Chem. 2003;278:48021–48029. doi: 10.1074/jbc.M308439200. [DOI] [PubMed] [Google Scholar]
- Li B, Castano AP, Hudson TE, Nowlin BT, Lin SL, Bonventre JV, Swanson KD, Duffield JS. The melanoma-associated transmembrane glycoprotein Gpnmb controls trafficking of cellular debris for degradation and is essential for tissue repair. FASEB journal: official publication of the Federation of American Societies for Experimental Biology. 2010;24:4767–4781. doi: 10.1096/fj.10-154757. [DOI] [PMC free article] [PubMed] [Google Scholar]
- Liu FT, Hsu DK. The role of galectin-3 in promotion of the inflammatory response. Drug News Perspect. 2007;20:455–460. doi: 10.1358/dnp.2007.20.7.1149628. [DOI] [PubMed] [Google Scholar]
- Lu SC, Alvarez L, Huang ZZ, Chen L, An W, Corrales FJ, Avila MA, Kanel G, Mato JM. Methionine adenosyltransferase 1A knockout mice are predisposed to liver injury and exhibit increased expression of genes involved in proliferation. Proc Natl Acad Sci U S A. 2001;98:5560–5565. doi: 10.1073/pnas.091016398. [DOI] [PMC free article] [PubMed] [Google Scholar]
- Manautou JE, Hoivik DJ, Tveit A, Hart SG, Khairallah EA, Cohen SD. Clofibrate pretreatment diminishes acetaminophen’s selective covalent binding and hepatotoxicity. Toxicol Appl Pharmacol. 1994;129:252–263. doi: 10.1006/taap.1994.1250. [DOI] [PubMed] [Google Scholar]
- Martinez-Chantar ML, Corrales FJ, Martinez-Cruz LA, Garcia-Trevijano ER, Huang ZZ, Chen L, Kanel G, Avila MA, Mato JM, Lu SC. Spontaneous oxidative stress and liver tumors in mice lacking methionine adenosyltransferase 1A. FASEB journal: official publication of the Federation of American Societies for Experimental Biology. 2002;16:1292–1294. doi: 10.1096/fj.02-0078fje. [DOI] [PubMed] [Google Scholar]
- Matarrese P, Tinari N, Semeraro ML, Natoli C, Iacobelli S, Malorni W. Galectin-3 overexpression protects from cell damage and death by influencing mitochondrial homeostasis. FEBS Lett. 2000;473:311–315. doi: 10.1016/s0014-5793(00)01547-7. [DOI] [PubMed] [Google Scholar]
- Mato JM, Corrales FJ, Lu SC, Avila MA. S-Adenosylmethionine: a control switch that regulates liver function. FASEB journal: official publication of the Federation of American Societies for Experimental Biology. 2002;16:15–26. doi: 10.1096/fj.01-0401rev. [DOI] [PubMed] [Google Scholar]
- Meghari S, Berruyer C, Lepidi H, Galland F, Naquet P, Mege JL. Vanin-1 controls granuloma formation and macrophage polarization in Coxiella burnetii infection. Eur J Immunol. 2007;37:24–32. doi: 10.1002/eji.200636054. [DOI] [PubMed] [Google Scholar]
- Miners JO, Drew R, Birkett DJ. Mechanism of action of paracetamol protective agents in mice in vivo. Biochem Pharmacol. 1984;33:2995–3000. doi: 10.1016/0006-2952(84)90599-9. [DOI] [PubMed] [Google Scholar]
- Moffit JS, Aleksunes LM, Kardas MJ, Slitt AL, Klaassen CD, Manautou JE. Role of NAD(P)H:quinone oxidoreductase 1 in clofibrate-mediated hepatoprotection from acetaminophen. Toxicology. 2007a;230:197–206. doi: 10.1016/j.tox.2006.11.052. [DOI] [PMC free article] [PubMed] [Google Scholar]
- Moffit JS, Koza-Taylor PH, Holland RD, Thibodeau MS, Beger RD, Lawton MP, Manautou JE. Differential gene expression in mouse liver associated with the hepatoprotective effect of clofibrate. Toxicol Appl Pharmacol. 2007b;222:169–179. doi: 10.1016/j.taap.2007.04.008. [DOI] [PMC free article] [PubMed] [Google Scholar]
- Moffit JS, Koza-Taylor PH, Holland RD, Thibodeau MS, Beger RD, Lawton MP, Manautou JE. Differential gene expression in mouse liver associated with the hepatoprotective effect of clofibrate. Toxicol Appl Pharmacol. 2007c;222:169–179. doi: 10.1016/j.taap.2007.04.008. [DOI] [PMC free article] [PubMed] [Google Scholar]
- Nakahara S, Oka N, Raz A. On the role of galectin-3 in cancer apoptosis. Apoptosis. 2005;10:267–275. doi: 10.1007/s10495-005-0801-y. [DOI] [PubMed] [Google Scholar]
- Ni HM, Bockus A, Boggess N, Jaeschke H, Ding WX. Activation of autophagy protects against acetaminophen-induced hepatotoxicity. Hepatology. 2012;55:222–232. doi: 10.1002/hep.24690. [DOI] [PMC free article] [PubMed] [Google Scholar]
- Okawa H, Motohashi H, Kobayashi A, Aburatani H, Kensler TW, Yamamoto M. Hepatocyte-specific deletion of the keap1 gene activates Nrf2 and confers potent resistance against acute drug toxicity. Biochem Biophys Res Commun. 2006;339:79–88. doi: 10.1016/j.bbrc.2005.10.185. [DOI] [PubMed] [Google Scholar]
- Park BK, Kitteringham NR, Maggs JL, Pirmohamed M, Williams DP. The role of metabolic activation in drug-induced hepatotoxicity. Annu Rev Pharmacol Toxicol. 2005;45:177–202. doi: 10.1146/annurev.pharmtox.45.120403.100058. [DOI] [PubMed] [Google Scholar]
- Pollard J, Jr, Butte AJ, Hoberman S, Joshi M, Levy J, Pappo J. A computational model to define the molecular causes of type 2 diabetes mellitus. Diabetes Technol Ther. 2005;7:323–336. doi: 10.1089/dia.2005.7.323. [DOI] [PubMed] [Google Scholar]
- Radosavljevic G, Volarevic V, Jovanovic I, Milovanovic M, Pejnovic N, Arsenijevic N, Hsu DK, Lukic ML. The roles of Galectin-3 in autoimmunity and tumor progression. Immunol Res. 2012;52:100–110. doi: 10.1007/s12026-012-8286-6. [DOI] [PubMed] [Google Scholar]
- Rao VC, Mehendale HM. Colchicine antimitosis abolishes CCl4 autoprotection. Toxicol Pathol. 1991;19:597–606. doi: 10.1177/019262339101900405. [DOI] [PubMed] [Google Scholar]
- Thakore KN, Mehendale HM. Role of hepatocellular regeneration in CCl4 autoprotection. Toxicol Pathol. 1991;19:47–58. doi: 10.1177/019262339101900106. [DOI] [PubMed] [Google Scholar]
- van Lith M, Hartigan N, Hatch J, Benham AM. PDILT, a divergent testis-specific protein disulfide isomerase with a non-classical SXXC motif that engages in disulfide-dependent interactions in the endoplasmic reticulum. J Biol Chem. 2005;280:1376–1383. doi: 10.1074/jbc.M408651200. [DOI] [PubMed] [Google Scholar]
- Varela-Rey M, Fernandez-Ramos D, Martinez-Lopez N, Embade N, Gomez-Santos L, Beraza N, Vazquez-Chantada M, Rodriguez J, Luka Z, Wagner C, Lu SC, Martinez-Chantar ML, Mato JM. Impaired liver regeneration in mice lacking glycine N-methyltransferase. Hepatology. 2009;50:443–452. doi: 10.1002/hep.23033. [DOI] [PMC free article] [PubMed] [Google Scholar]
- Volarevic V, Milovanovic M, Ljujic B, Pejnovic N, Arsenijevic N, Nilsson U, Leffler H, Lukic ML. Galectin-3 deficiency prevents concanavalin A-induced hepatitis in mice. Hepatology. 2012;55:1954–1964. doi: 10.1002/hep.25542. [DOI] [PubMed] [Google Scholar]
- Yamazaki K, Kawai A, Kawaguchi M, Hibino Y, Li F, Sasahara M, Tsukada K, Hiraga K. Simultaneous induction of galectin-3 phosphorylated on tyrosine residue, p21(WAF1/Cip1/Sdi1), and the proliferating cell nuclear antigen at a distinctive period of repair of hepatocytes injured by CCl4. Biochem Biophys Res Commun. 2001;280:1077–1084. doi: 10.1006/bbrc.2000.4193. [DOI] [PubMed] [Google Scholar]
- Yang RY, Hsu DK, Liu FT. Expression of galectin-3 modulates T-cell growth and apoptosis. Proc Natl Acad Sci U S A. 1996;93:6737–6742. doi: 10.1073/pnas.93.13.6737. [DOI] [PMC free article] [PubMed] [Google Scholar]
- Yu F, Finley RL, Jr, Raz A, Kim HR. Galectin-3 translocates to the perinuclear membranes and inhibits cytochrome c release from the mitochondria. A role for synexin in galectin-3 translocation. J Biol Chem. 2002;277:15819–15827. doi: 10.1074/jbc.M200154200. [DOI] [PubMed] [Google Scholar]
Associated Data
This section collects any data citations, data availability statements, or supplementary materials included in this article.