

Abstract
Measurement of proteasome activity is fast becoming a commonly used assay in many laboratories. The most common method to measure proteasome activity involves measuring the release of fluorescent tags from peptide substrates in black microplates. Comparisons of black plates used for measuring fluorescence with different properties show that the microplate properties significantly affect the measured activities of the proteasome. The microplate that gave the highest reading of trypsin-like activity of the purified 20S proteasome gave the lowest reading of chymotrypsin-like activity of the 20S proteasome. Plates with medium binding surfaces from two different companies showed an approximately 2 fold difference in caspase-like activity for purified 20S proteasomes. Even standard curves generated using free 7-amino-4-methylcoumarin (AMC) were affected by the microplate used. As such, significantly different proteasome activities, as measured in nmol AMC released/mg/min, were obtained for both purified 20S proteasomes as well as crude heart and liver samples when using different microplates. The naturally occurring molecule betulinic acid activated the chymotrypsin-like proteasome activity in three different plates but did not affect the proteasome activity in the non-binding surface microplate. These findings suggest that the type of proteasome activity being measured and sample type is important when selecting a microplate.
Keywords: proteasome, microplate, proteolytic activity, betulinic acid
Introduction
The microplate is a critical component of many proteolytic assays as well as many high-throughput screens. Understanding the characteristics of different microplates is important for optimal performance when developing assays, as different microplates have different inherent compositions. A comparison of four different black 96 well plates showed that proteasome assay performance is directly influenced by the properties of the microplate. Black microplates are used for fluorescence measurements due to their low auto-fluorescence, reduced well-to-well crosstalk and ability to absorb scattered light, resulting in enhanced fluorescence signals.
A frequently used assay in our lab and one that is becoming common in other laboratories is the measurement of the proteasome proteolytic activity [1; 2; 3]. The proteasome is a large complex that is composed of a 28-subunit 20S core that contains three different proteolytic activities (caspase-like, β1; trypsin-like, β2; and chymotrypsin-like activity, β5) [4; 5]. The 20S core can exist on its own but is normally bound to one or two 19S regulatory complexes, forming the complex commonly referred to as the 26S proteasome. The 26S proteasome is the main proteolytic enzyme responsible for degradation of unwanted intracellular proteins in eukaryotic cells. Measurement of proteasome activity is important because proteasome dysfunction has been implicated in several diseases including Alzheimer’s disease, Parkinson’s disease, cancer, and heart failure [6; 7; 8; 9; 10].
The most common method for determining the activity of the proteasome is by incubating the sample of interest with a fluorescently-labeled proteasome substrate in the presence and absence of a specific proteasome inhibitor in a black 96 well microplate [11]. The most commonly used proteasome substrates are the peptides labeled with fluorescent 7-amino-4-methylcoumarin (AMC). The excitation and emission spectra of free AMC are different from that of bound AMC, allowing AMC released by proteolytic cleavage (free AMC) to be easily measured with a fluorometer. Fluorescence measurements in black 96 well plates are common in applications where greater sensitivity than that achievable by simple absorbance measurements is required. Several kits for measuring chymotrypsin-like proteasome activity only are commercially available, some of which provide the microplate as well. As more labs utilize proteasome assays, an important variable to consider is the microplate used. While the source of the substrate and inhibitor for the proteasome assays are usually stated in publications, the source of the microplate is often not given. There are many manufacturers of black 96 well microplates, and between them they offer a huge variety of plates. As such, many scientists utilize any available black microplate; however there are many features that are important to take into consideration. The orientation of proteins in plate wells is unpredictable, and the binding between enzymes and substrates is a complex process affected by many parameters. Three main types of binding surfaces are available: non-binding or low-binding, medium-binding and high-binding. Many microplates are composed of polystyrene, a polymer composed of a carbon chain with benzene rings placed every other carbon, which provides a hydrophobic binding surface. The untreated polystyrene is referred to as medium-binding. Different treatments are performed to alter the structure of the polystyrene, and hence the binding properties of the plate. The non-binding surface has been treated to create a nonionic, hydrophilic surface that is similar in structure to polyethylene oxide, which has a low affinity for proteins [12]. The high-binding surface has been treated so that some benzene rings have been modified to create hydrophilic groups, which generally increases binding of polar proteins [13]. To investigate whether the microplate chosen significantly affects proteasome activity measurements, four different sets of 96 well black flat-bottomed polystyrene plates were compared: one non-binding, two medium-binding and one high-binding microplate. The four different types of plates were used to determine proteasome activities in heart and liver cytosolic lysates and purified 20S proteasomes, as well as the effect of different plates on standard curves using free AMC. The effect of betulinic acid (BA), a potential anti-tumor small molecule, on purified 20S proteasomes was also investigated and found to be affected by the plate used. Our results suggest that the type of microplate used affects proteasome activity measurements and demonstrate the problems associated with different microplates when comparing proteasome activity between different tissues.
Materials and Methods
Reagents
Betulinic acid (high purity) was purchased from Enzo Life Sciences, NY. Purified 20S murine proteasome was obtained from Boston Biochem, MA. Fluorotrac 200 (medium-binding, Cat # 655076) and Fluorotrac 600 (high binding, Cat # 655077) were from Greiner Bio-One, Germany. Costar non-treated (medium binding Cat # 3915) and Corning non-binding surface (Cat # 3991) were from Corning, NY.
Heart and Liver Lysate Preparation
Livers and hearts from 3 month old rats were obtained from Pelfreez (Rogers, AR). Tissues were minced with a razor blade and then immediately homogenized using a dounce homogenizer with 2 ml buffer/0.1 g tissue of 26S buffer (50 mM Tris, 1 mM EDTA, 150 mM NaCl, 5 mM MgCl2, pH 7.5) and freshly added DTT (0.5 mM), and subsequently centrifuged at 12,000 × g for 30 min at 4°C. The supernatant (cytosolic lysate) was quantified using a Nanodrop 2000C (Thermo Scientific), diluted to 2 μg/μl in 26S buffer, and stored at −80°C in small aliquots. Each aliquot was used for one set of assays only (no freeze-thaw cycles).
Lysate 26S Proteasome Activity Assay
The 26S proteasome assay was carried out in a total volume of 100 μl in 96 well plates with 100 μM ATP in 26S buffer using 20 μg of protein supernatants. Assays were initiated by addition of fluorescently labeled substrate: succinyl-Leu-Leu-Val-Tyr-7-amido-4-methylcoumarin (Suc-LLVY-AMC), Boc-Leu-Ser-Thr-Arg-AMC (Boc-LSTR-AMC, Bachem), and Z-Leu-Leu-Glu-AMC (Z-LLE-AMC) for chymotrypsin- (β5), trypsin- (β2) and caspase- (β1) like activity measurements respectively. The final concentration of substrate in each assay was 100 μM as previously described [1; 3; 14].
These substrates are cleaved by the proteasome, releasing free AMC which was then measured spectrofluorometrically using a Fluoroskan Ascent fluorometer (Thermo Fisher Scientific, Waltham, MA) at an excitation wavelength of 390 nm and an emission wavelength of 460 nm. Fluorescence was measured at 15-min intervals for 2 hrs. All assays were linear in this range. Each assay was conducted in the absence and presence of the specific proteasomal inhibitor bortezomib (LC labs, Woburn, MA), 20 μM for β5 chymotrypsin-like activity, and 100 μM for β2 trypsin-like activity, and β1 caspase-like activity.
To properly compare different plates all the samples and reagents used were aliquoted into small aliquots and kept at −20°C (β1, β2, β5 substrate and AMC standard) or −80°C (heart and liver lysate, 20S proteasomes, bortezomib, ATP) and thawed 30 mins before use.
Lysate 20S Proteasome Activity Assay
The 20S proteasomal activities in heart and liver lysates were determined in a similar fashion to the 26S assays, using the same substrates and inhibitors but a different buffer. Assays were carried out in buffer containing 25 mM HEPES, 0.5 mM EDTA, 0.05 % (v/v) NP-40, 0.001 % (w/v) SDS.
Purified 20S Proteasome Activity
Measurement of purified murine 20S proteasome activities were carried out in a total volume of 100 μl in 96 well plates with 20 mM Tris buffer, pH 7.5. Assays were initiated by addition of fluorogenic substrates as described for tissue lysates. No proteasome inhibitors were used for these assays. All other conditions were similar to the 26S proteasome measurements. For measurements in the presence of BA, BA (10 μg/ml final concentration) was added to the proteasome and incubated for 20 mins before addition of the proteasome substrate.
AMC Standard Curve
AMC standard curves were obtained by making dilutions ranging from 0–500 nM and 0–8 μM. Measurement of free AMC fluorescence values were carried out in a total volume of 100 μl in 96 well plates using 20 mM Tris buffer, pH 7.5.
Protein Concentration Determination
Protein concentrations were determined using four independent methods: 1) the Bradford assay (Bio-Rad Bradford reagent); 2) the detergent-compatible (DC) assay (Bio-Rad DC kit), and 3) absorbance at 280 nm using a bovine serum albumin (BSA) standard curve (A280 BSA). Protein measurements were also determined using an absorbance of 280 nm (A280) without a BSA standard curve.
Statistical Analysis
Results are expressed as mean ± SE. Statistical significance of differences in parameters was assessed by t-test or one-way ANOVA using Sigmaplot (Systat Software, Inc., San Jose, CA), or Microsoft Excel (Redmond, WA). For protein lysates, each result is representative of one set of 3–4 different samples. Each set was repeated at least three times and in most cases experiments were repeated by two different investigators. For purified proteasome samples each result is representative of 6–9 samples. Each set of purified proteasome assays was repeated three times. A p value of less than 0.05 was considered significant. *, p < 0.05; **, p < 0.001.
Results
The Fluorotrac 200 is referred to as GMBS (Greiner medium-binding surface), Fluorotrac 600 as GHBS (Greiner high-binding surface), Costar non-treated as CMBS (Costar medium-binding surface) and Corning non-binding surface as CNBS (Corning non-binding surface). 26S trypsin-like (β2) proteasome activity in heart lysates was unaffected by the type of microplate used (Figure 1). 26S caspase-like (β1) proteasome activity in heart lysates was higher in CNBS plates, while 26S chymotrypsin-like (β5) activity was highest in CMBS plates (Figure 1). The 26S caspase-like activity of liver lysates was also significantly higher in CNBS plates when compared to GHBS and CMBS plates (Figure 2). The 26S trypsin-like activity in liver lysates was significantly lower in CNBS plates, as opposed to heart lysate measurements, while the 26S liver chymotrypsin-like activity was highest in CNBS plates.
Figure 1. 26S proteasome activities from heart lysates in different black microplates.

Caspase- (β1), trypsin- (β2), and chymotrypsin- (β5) like proteasome activities of heart cytosolic lysates were determine in four different microplates. Heart lysates (20 μg) were incubated with different substrates depending on the proteolytic activity of the proteasome that was being measured. Each assay was conducted in the absence and presence of the specific proteasome inhibitor bortezomib. AMC fluorescent tags released from substrates by the specific proteasome activity were measured using a Fluoroskan Ascent fluorometer at an excitation wavelength of 390 nm and an emission wavelength of 460 nm. *, p < 0.05; **, p < 0.001.
Figure 2. 26S proteasome activities from liver lysates in different black microplates.

Caspase- (β1), trypsin- (β2), and chymotrypsin- (β5) like proteasome activities of liver cytosolic lysates were determine in four different microplates. Liver lysates (20 μg) were incubated with different substrates depending on the proteolytic activity of the proteasome that was being measured. Each assay was conducted as described in figure 1 legend and in the methods. *, p < 0.05; **, p < 0.001.
Different assay conditions were used to determine whether results obtained with different plates were affected by the type of activity being measured. 26S proteasome activities are measured in the presence of ATP and in the absence of detergent, while 20S activities are measured in the absence of ATP but in the presence of detergent. Measurement of 20S chymotrypsin-like activity in heart and liver lysates showed that while the activity in liver lysates was similar with the four different microplates, the activity in heart lysates were all significantly different from each other (Figure 3). The heart proteasome chymotrypsin-like activity in CNBS plates was significantly higher than the activity obtained in the other three plates, with the lowest fluorescence intensity obtained in GMBS plates. These results suggest a previously unknown tissue-dependent effect on proteasome activity related to type of microplate used.
Figure 3. 20S chymotrypsin-like proteasome activities in heart and liver lysates using different black microplates.
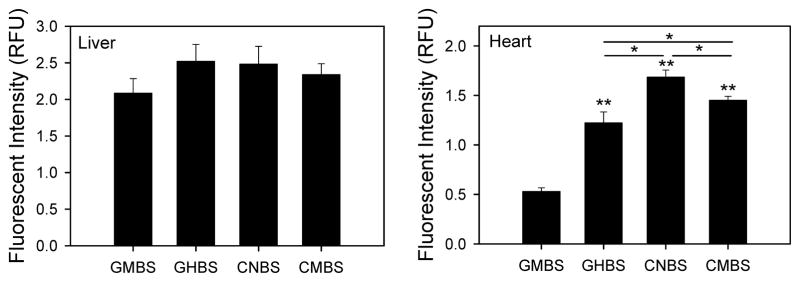
Heart and liver lysates (20 μg) were incubated with LLVY-AMC substrate in the presence of 20S buffer and AMC released from the proteasome substrate was measured using a Fluoroskan Ascent fluorometer as described in the methods. *, p < 0.05; **, p < 0.001.
Purified murine 20S proteasome activity assays in the different plates also showed unexpected results (Figure 4). Caspase-like proteasome activity was highest in the CMBS plates, while the activities in the other three types of plates not significantly different from each other. The trypsin-like proteasome activity was highest in CNBS plates, with GHBS and CMBS plates giving higher activity than GMBS plates. Chymotrypsin-like proteasome activity was lowest for the CNBS plates and similar for the other plates. These results demonstrate that purified 20S proteasomes have distinct differences in activities on different microplates and suggest that some binding of the 20S proteasome to the plate may be beneficial for measuring chymotrypsin-like activity.
Figure 4. Purified 20S proteasome activities measured using different microplates.

Caspase- (β1), trypsin- (β2), and chymotrypsin- (β5) like proteasome activities of purified mouse 20S proteasomes (0.1 μg) were determined as described in the methods. *, p < 0.05; **, p < 0.001.
Standard curves obtained using free AMC showed significant differences between all four plates (Figure 5). This is important because calculations of proteasome activity are all done using standard curves; determination of the specific activity of the proteasome depends on the amount of AMC released per unit time per unit of protein. Measurement of fluorescence from free AMC standard curves showed that CMBS (medium binding surface) gave the highest fluorescence (Figure 5). The GHBS (high binding surface) gave the lowest fluorescence, which was substantially lower than values obtained using the other plates. This is important since the GHBS plates give reasonable caspase-like activity for heart lysates, trypsin-like activity for liver lysates, and chymotrypsin-like activity for purified 20S proteasomes when compared to the other plates. Calculation of proteasome specific activities (nmol/min/mg) for samples in each microplate using the AMC standard curve obtained from similar type plates showed that different results are obtained with respect to which plate gives greatest activity when compared to the fluorescent intensity (RFU) (Table 1). While trypsin-like proteasome activity was not affected by plate type when fluorescent intensity was used (Figure 1), the specific activity of proteasomes in GHBS plates showed significantly higher trypsin-like proteasome activity than the other plates. The higher proteolytic activity in the GHBS plates was due to the lower AMC standard curve obtained with these curves. Based on these findings, it can be deduced that measuring the specific activity of the purified proteasome as well as the heart or liver using the different plates gives different results in part because of the variations between the sample results and the free AMC standard curve results.
Figure 5. Effect of different 96 well black microplates on free AMC standard curves.
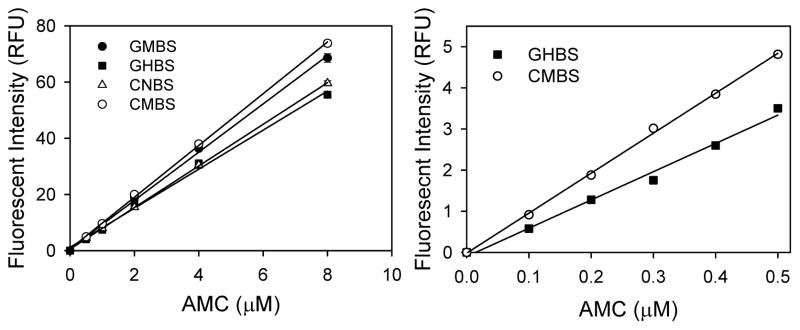
The fluorescence of free AMC (excitation wavelength of 390 nm and emission wavelength of 460 nm) at different concentrations (0–0.5 μM and 0–8 μM) were measured a Fluoroskan Ascent fluorometer.
Table 1.
Proteasome Activities obtained using different microplates.
| Sample | Assay Type | Microplate Type | Proteolytic Activity (mean ± SE, nmol/min/mg) |
|---|---|---|---|
| Heart Lysate | 20S β5 | GMBS | 0.0108 ± 3.93E-04 |
| GHBS | 0.0248 ± 2.75E-03 | ||
| CNBS | 0.0271 ± 1.92E-03 | ||
| CMBS | 0.0156 ± 6.02E-04 | ||
| 26S β1 | GMBS | 0.0036 ± 3.08E-04 | |
| GHBS | 0.0164 ± 1.48E-03 | ||
| CNBS | 0.0153 ± 1.68E-04 | ||
| CMBS | 0.0044 ± 3.00E-04 | ||
| 26S β2 | GMBS | 0.0021 ± 1.11E-04 | |
| GHBS | 0.0102 ± 1.19E-03 | ||
| CNBS | 0.0068 ± 1.03E-03 | ||
| CMBS | 0.0027 ± 2.37E-04 | ||
| 26S β5 | GMBS | 0.0069 ± 2.07E-04 | |
| GHBS | 0.0215 ± 1.43E-03 | ||
| CNBS | 0.0167 ± 8.15E-04 | ||
| CMBS | 0.0150 ± 3.75E-04 | ||
| Liver Lysate | 20S β5 | GMBS | 0.0268 ± 5.30E-03 |
| GHBS | 0.0560 ± 1.29E-02 | ||
| CNBS | 0.0458 ± 1.11E-02 | ||
| CMBS | 0.0317 ± 4.72E-03 | ||
| 26S β1 | GMBS | 0.0292 ± 1.19E-03 | |
| GHBS | 0.0362 ± 3.37E-03 | ||
| CNBS | 0.0430 ± 7.60E-04 | ||
| CMBS | 0.0233 ± 1.47E-03 | ||
| 26S β2 | GMBS | 0.1334 ± 3.83E-03 | |
| GHBS | 0.1806 ± 7.30E-03 | ||
| CNBS | 0.0190 ± 1.95E-03 | ||
| CMBS | 0.1235 ± 8.03E-03 | ||
| 26S β5 | GMBS | 0.0302 ± 3.77E-03 | |
| GHBS | 0.0652 ± 2.35E-03 | ||
| CNBS | 0.0809 ± 7.98E-03 | ||
| CMBS | 0.0273 ± 8.92E-03 | ||
| Purified 20S | 20S β1 | GMBS | 19.875 ± 0.890 |
| GHBS | 29.637 ± 0.149 | ||
| CNBS | 24.402 ± 0.582 | ||
| CMBS | 36.300 ± 2.095 | ||
| 20S β2 | GMBS | 6.527 ± 0.562 | |
| GHBS | 15.378 ± 0.927 | ||
| CNBS | 23.420 ± 0.445 | ||
| CMBS | 8.480 ± 0.530 | ||
| 20S β5 | GMBS | 37.227 ± 0.947 | |
| GHBS | 51.640 ± 3.147 | ||
| CNBS | 20.250 ± 0.495 | ||
| CMBS | 40.272 ± 2.407 |
Since the 20S and 26S proteasome activities in tissue lysates is determined as the proteolytic activity not inhibited by the specific proteasome inhibitor used, it is possible that the differences observed between plates may be due to the proteasome inhibitor concentration and/or functionality being affected by the plate used. Except for trypsin-like activity (β2) measurements of liver lysates, the relative inhibition of lysates was similar for most assays and plates with marginal increases in relative inhibition for a few sample/plate combinations. Marginal decreases (<20%) in relative inhibition did not correlate with lower proteolytic activity. Overall, the changes in relative inhibition were not as significant as the change in total proteasome activity but did partially contribute to some of the differences observed. Even for β2 activity in liver lysates, the significantly lower activity relative to the other plates was due to a combination of lower relative inhibition and lower total activity, with the lower total activity being significantly more important that the decreased inhibition of the lysate.
To determine if addition of bortezomib (a proteasome inhibitor) to the empty well might increase the amount of inhibitor bound to the plate with the high-binding surface (resulting in decreased inhibitor available to inhibit the proteasome) a comparison was done adding inhibitor before the addition of any other components versus addition of the inhibitor after buffer is already present in the plate wells. Adding inhibitor before or after buffer did not affect the proteolytic activity measured using purified 20S proteasome or heart or liver lysates (Figure 6).
Figure 6. Effect of proteasome inhibitor added at different times on purified 20S and heart and liver 26S chymotrypsin-like activity.

Proteasome inhibitor was added before (B) or after (A) buffer was to the microplate to determine if adding the inhibitor to the plate increased the binding of the inhibitor to the plate. Upper left panel shows purified 20S in CMBS plates while the lower left and right panels show liver and heart lysates in GHBS plates.
BA has been suggested to activate the chymotrypsin-like activity of the proteasome in vitro. To determine how a small molecule activator of the proteasome is affected by the microplate used we determined the effects of BA on heart and liver lysate and purified murine 20S chymotrypsin-like activity using the different plates. BA was found to activate the chymotrypsin-like activity of the purified 20S proteasome when the assay was carried out in three different plates (GMBS, GHBS, and CMBS) (Figure 7). The medium binding plates showed greater fold activation of chymotrypsin-like activity by BA (1.7–1.8 fold) than the high-binding plate (1.2 fold). However, when CNBS plates were used to measure the effect of BA on chymotrypsin-like proteasome activity no significant change in the activity of the proteasome was observed. BA (10 μg/ml) did not significantly affect the 26S chymotrypsin-like proteasome activity in heart or liver lysates for any of the plates tested (data not shown). These results strongly suggest that the microplate used can affect the result obtained using small molecules/compounds.
Figure 7. Effect of betulinic acid on purified 20S chymotrypsin-like proteasome activity.

Betulinic acid (10 μg/ml final concentration) was added to purified murine 20S proteasomes and incubated for 20 mins before addition of proteasome substrate. AMC released from the substrate was measured using a Fluoroskan Ascent fluorometer. *, p < 0.05; **, p < 0.001.
Different specific activities of the proteasome may potentially be due to the assay utilized to determine protein concentration. To determine if different protein determination assays significantly affect the amount of protein quantified in heart and liver lysates, we compared three commonly used assays for protein determination: the Bradford assay, the DC assay and the protein absorbance at 280 nm (Figure 8). Protein absorbance has risen in popularity due to speed and small amount of sample required. When using BSA as a standard curve the three assays gave protein concentrations ranging from 0.20 to 0.25 mg/ml for heart lysate and 0.20 to 0.24 mg/ml for liver lysate. When using the default setting for protein concentration determination (Thermo Scientific Nanodrop 2000 software) using absorbance at 280 nm, the protein concentration was significantly higher (>35%) than measurements using BSA as a standard. This was not unexpected since the default setting is based on an average extinction coefficient (10, absorbance at 280 nm of a 1% solution (10 mg/ml)) that is different from the extinction coefficient of BSA (6.6). Given that different methods of measuring protein concentration give different results, it is likely that the method of protein quantification may responsible in part for the different proteasome activities reported by different investigators.
Figure 8. Measurement of protein concentrations in heart and liver lysates using different protein assays.

Protein concentrations of heart and liver lysates (0.2 mg/ml based upon Bradford assay) was determined using DC, Bradford and A280 protein assays. BSA A280 refers to measurement of protein at an absorbance of 280 nm using BSA as a standard curve. BSA was used as a standard for the DC and Bradford assays. *, p < 0.05; **, p < 0.001.
Discussion
Protein and substrate binding to the well is critical to the proteasome activity assay sensitivity and has to be carefully controlled. Overall, the measurements of fluorescence emitted by cleaved AMC were uniquely different from each other when measured in different microplates. No plate was optimal for measuring the three proteolytic activities of the proteasome. The Costar non-treated (CMBS) plates showed the highest fluorescence intensity for heart 26S chymotrypsin-like proteasome activity, while Costar non-binding (CNBS) plates showed the highest fluorescence intensity for heart caspase-like activity. Heart 26S trypsin-like proteasome activity was not significantly different between the four plates. Surprisingly, different results were obtained using liver lysates, with CNBS plates showing the highest fluorescence intensity for 26S chymotrypsin-like proteasome activity, while CNBS plates show the lowest fluorescence intensity for 26S trypsin-like proteasome activity.
All microplates selected were polystyrene and had flat well bottoms, which were chosen because they give a high surface area. Microplates can be low-, medium- or high- protein binding depending on what treatment they have undergone. Non-binding surfaces are generally characterized by their low binding capacity for biomolecules such as peptides and proteins. The repellent property of the non-binding surfaces for biomolecules is usually advantageous in biochemical assays, resulting in increased sensitivity, reduced background and improved signal-to-noise ratio. However, non-binding surfaces are significantly more expensive than non-treated (medium-binding) surfaces. Medium-binding polystyrene surfaces are usually more hydrophobic than the surface of a high-binding microplate, and therefore tend to be more suitable for non-polar proteins and peptides. High-binding microplates are generally recommended for ELISAs. Another potential problem faced when performing proteasome assays is that most plate readers typically lack constant humidity which results in uneven temperature uniformity, causing differential evaporation from outer wells. To avoid artifacts due to uneven evaporation from wells in different regions of the plate [15; 16], all assays were carried out with the samples in identical wells on different plates.
The liver contains a higher concentration of proteasome than the heart [3], so it may be possible that some of the differences observed between the liver and heart samples were due to the amount of proteasome in the lysates. However, we found that the differences between the lysates was not due to amount of proteasome, as increasing the amount of heart sample did not affect the relative activity obtained using the different plates (data not shown). The most likely explanation is the intrinsic differences between heart and liver samples, such as differences in associating partners and post-translational modifications which modulate the activity of the proteasome [2]. The crude sample will contain more proteasome interacting proteins than the purified sample. Some proteasome interacting proteins act as inhibitors while others act as activators of the proteasome. Another possible explanation for the observed differences is that different types of proteins in the lysates bind to the plates and compete with the proteasome for binding. Different post-translational modifications on the proteasome may also affect the stability and ability of the proteasome to interact with the plate.
20S chymotrypsin-like activity measurements also showed significant differences between heart and liver lysates with respect to the different microplates. While the 20S chymotrypsin-like activities in heart lysates were all significantly different from each other, the activities in liver lysates were all similar. These results clearly point to tissue-specific effects that are uniquely different between heart and liver samples. For example, liver samples contain significantly more proteases and/or higher concentrations of proteases than the hearts that are capable of cleaving proteasome substrates, as judged by non-proteasomal activity in these samples (activity not inhibited by the specific proteasome inhibitor, bortezomib).
The most commonly used buffers for determination of 20S proteasomes in crude lysates contain SDS and/or NP-40. However, buffers used for measuring purified 20S proteasomes are numerous. While detergents (SDS and NP-40) increase the activity of the 20S proteasome, they are not needed for proteasome activity measurements. Purified 20S proteasome assays were all carried out in the absence of detergent as a detergent free buffer is now the most commonly used method for these assays [17; 18; 19]. However, it is likely that detergents will affect the binding properties of the non-, medium- and high-binding types of microplates differently. As such, it is highly recommended that the determination of 20S proteasome proteolytic activities in the presence of detergent be initially carried out on all three main types of microplates to determine what plate is best for the detergent type and amount.
Purified murine 20S proteasome activity assays showed that caspase-like activity was highest in the CMBS plates while trypsin-like activity was highest in CNBS plates, and chymotrypsin-like activity was lowest in the CNBS plates. These results suggest that some binding of the proteasome may be beneficial for caspase- and chymotrypsin-like proteolytic activity measurements. It is possible that binding of 20S proteasomes to the microplate may alter the structure of the 20S, resulting in the opening of the cavity into the proteasome and consequently higher activity. It is also possible that peptide substrates binding to the plates reduce the substrate availability for degradation by the proteasome. However, this is unlikely, as the amount of substrate used in these assays (100 μM) is significantly higher than required by the proteasome for optimal activity. Although 100 μM is the most commonly used concentration of proteasome substrate used, lower concentrations have been used, so substrate availability may be a concern for some researchers [20; 21].
Free AMC standard curves showed significant differences between all four plates, with CMBS plates giving the highest fluorescence and GHBS plates giving the lowest fluorescence. The specific activities of the purified proteasome as well as the proteasome in the heart or liver using the different plates are shown in Table 1 and highlight the different results because of the differences between the sample results and the free AMC standard curve results (Table 1). While medium-binding plates seem to be good plates for measuring proteasome activity using fluorescent intensity or relative fluorescent intensity, CNBS and GHBS plates give higher specific activities in ten out of the eleven different proteolytic activities shown in Table 1. The results shown in Table 1 further emphasize the effect that different plates could have on proteasome assays.
BA is a naturally occurring small molecule that have been shown to directly activate the chymotrypsin-like activity of the proteasome in vitro (the only other known small molecule activator of in vitro proteasome activity is oleuropein) [22; 23]. At certain concentrations BA has been shown to increase apoptosis in cancer cells but not in normal cells, making it an attractive anti-cancer compound [24]. The measurement of BA’s effect on the proteasome is critical to properly investigate the potential use of BA as an anti-cancer drug. To determine the effect of BA on purified murine 20S proteasomes, the chymotrypsin-like activity of the proteasome was determined using the four different types of microplates in the absence or presence of BA (10 μg/ml). Interestingly, BA had no significant effect on chymotrypsin-like activity of purified 20S when measured in CNBS plates, while BA significantly activated chymotrypsin-like proteasome activity in the other three plates.
BA (10 μg/ml) did not significantly affect the chymotrypsin-like activity of 26S proteasome in heart or liver lysates (data not shown). These results suggest that BA has other intracellular interacting partners/targets. This conclusion is supported by a recent report suggesting that in addition to stimulating proteasome activity, BA may inhibit some deubiquitinases [25]. We have shown that the same total protein amount used for proteasome activity measurements may give different results for specific proteasome activity in different plates.
The accurate determination of total protein amount is also very important for reliable results. Many assays to determine protein concentration have been developed, with four assays commonly used in research, including the Lowry assay, the Bradford assay, the A280, and the Warburg-Christian method. Each of these methods has their strengths and weaknesses which will not be discussed here. The Bio-Rad DC Protein Assay is a colorimetric assay for protein concentration based upon the Lowry assay (reaction of protein with an alkaline copper tartrate solution and Folin reagent) [26]. This color development is mainly due to the amino acids tyrosine and tryptophan, and to a lesser extent, cystine, cysteine, and histidine [27]. The Bio-Rad Bradford Protein Assay, based on the method of Bradford [28], is a dye-binding assay using Brilliant Blue G-250 dye in which a differential color change of a dye occurs in response to various concentrations of protein. The Coomassie blue dye binds primarily basic and aromatic amino acid residues, especially arginine [29]. Absorbance assays are used for calibrating purified BSA and other pure proteins for use as standards or other methods. Proteins in solution absorb ultraviolet light with absorbance maxima at 280 nm due to amino acids with aromatic rings and at 200 nm due to peptide bonds. The relationship of absorbance to protein concentration is linear. Most spectrophotometer programs automatically correct for nucleic acid contamination in samples by measuring absorbance at 260 nm and then using a well-established formula to correct for any nucleic acid contamination [30]. The most common protein concentration standard used is BSA with gamma globulin also used to a lesser extent. When BSA was used as a standard the protein concentration of the heart and liver lysates exhibited up to 25% and 20% differences relative to the other methods of protein quantification respectively. Hence the method of protein concentration determination is also important when comparing the proteasome activity measurements in nmol/min/mg.
Optimization of the plate utilized would reduce the amount of protein required for proteasome assays. Using a plate that is optimized for the assay being conducted could significantly improve results, so that small differences between samples could be well discriminated. It should be cautioned that plate selection could also potentially bias the results. It is possible that some plates may artificially increase proteasome activity in a way which is not physiologically relevant to the cell. Hence it is important to initially validate a potential proteasome inhibitor or activator by an independent method so that long term measurements using fluorescent assays in microplates are optimized and reliable. We suggest validating potential proteasome activators or inhibitors with techniques such as site-specific fluorescent probes or bioluminescent imaging [11]. For researchers wanting to compare proteasome activities between different tissues samples (such as mouse liver and mouse heart), our results suggest that it is best to use at least two different types of plates (high binding or non-binding and a medium binding) and average the results.
Overall, the results suggest that when proteasome activities are being investigated in new samples or molecules, different microplates should be evaluated to determine the best plate for the assay as well as the role of any possible plate-specific effects. The use of different microplates may be especially important when investigating the effect of small molecules on proteasome activity. We recommend the use of at least two plates, such as one medium-binding and one low-binding or high-binding, for evaluating initial proteasome assays. In summary, the results suggest that significant caution is needed when selecting microplates for proteasome assays.
Acknowledgments
This work was supported by National Institutes of Health (NIH) Grant HL096819.
Footnotes
Publisher's Disclaimer: This is a PDF file of an unedited manuscript that has been accepted for publication. As a service to our customers we are providing this early version of the manuscript. The manuscript will undergo copyediting, typesetting, and review of the resulting proof before it is published in its final citable form. Please note that during the production process errors may be discovered which could affect the content, and all legal disclaimers that apply to the journal pertain.
References
- 1.Gomes AV, Waddell DS, Siu R, Stein M, Dewey S, Furlow JD, Bodine SC. Upregulation of proteasome activity in muscle RING finger 1-null mice following denervation. FASEB J. 2012;26:2986–99. doi: 10.1096/fj.12-204495. [DOI] [PMC free article] [PubMed] [Google Scholar]
- 2.Gomes AV, Young GW, Wang Y, Zong C, Eghbali M, Drews O, Lu H, Stefani E, Ping P. Contrasting proteome biology and functional heterogeneity of the 20 S proteasome complexes in mammalian tissues. Mol Cell Proteomics. 2009;8:302–15. doi: 10.1074/mcp.M800058-MCP200. [DOI] [PMC free article] [PubMed] [Google Scholar]
- 3.Gomes AV, Zong C, Edmondson RD, Li X, Stefani E, Zhang J, Jones RC, Thyparambil S, Wang GW, Qiao X, Bardag-Gorce F, Ping P. Mapping the murine cardiac 26S proteasome complexes. Circ Res. 2006;99:362–71. doi: 10.1161/01.RES.0000237386.98506.f7. [DOI] [PubMed] [Google Scholar]
- 4.Bedford L, Paine S, Sheppard PW, Mayer RJ, Roelofs J. Assembly, structure, and function of the 26S proteasome. Trends Cell Biol. 2010;20:391–401. doi: 10.1016/j.tcb.2010.03.007. [DOI] [PMC free article] [PubMed] [Google Scholar]
- 5.Gomes AV, Zong C, Ping P. Protein degradation by the 26S proteasome system in the normal and stressed myocardium. Antioxid Redox Signal. 2006;8:1677–91. doi: 10.1089/ars.2006.8.1677. [DOI] [PubMed] [Google Scholar]
- 6.Spataro V, Norbury C, Harris AL. The ubiquitin-proteasome pathway in cancer. Br J Cancer. 1998;77:448–55. doi: 10.1038/bjc.1998.71. [DOI] [PMC free article] [PubMed] [Google Scholar]
- 7.Whatley BR, Li L, Chin LS. The ubiquitin-proteasome system in spongiform degenerative disorders. Biochim Biophys Acta. 2008;1782:700–12. doi: 10.1016/j.bbadis.2008.08.006. [DOI] [PMC free article] [PubMed] [Google Scholar]
- 8.Lim KL. Ubiquitin-proteasome system dysfunction in Parkinson’s disease: current evidence and controversies. Expert Rev Proteomics. 2007;4:769–81. doi: 10.1586/14789450.4.6.769. [DOI] [PubMed] [Google Scholar]
- 9.Powell SR. The ubiquitin-proteasome system in cardiac physiology and pathology. Am J Physiol Heart Circ Physiol. 2006;291:H1–H19. doi: 10.1152/ajpheart.00062.2006. [DOI] [PubMed] [Google Scholar]
- 10.Saeki Y, Tanaka K. Assembly and function of the proteasome. Methods Mol Biol. 2012;832:315–37. doi: 10.1007/978-1-61779-474-2_22. [DOI] [PubMed] [Google Scholar]
- 11.Liggett A, Crawford LJ, Walker B, Morris TC, Irvine AE. Methods for measuring proteasome activity: current limitations and future developments. Leuk Res. 2010;34:1403–9. doi: 10.1016/j.leukres.2010.07.003. [DOI] [PubMed] [Google Scholar]
- 12.Nelson KD, Eisenbaumer R, Pomerantz M, Eberhart RC. High affinity polyethylene oxide for improved biocompatibility. ASAIO J. 1996;42:M884–9. doi: 10.1097/00002480-199609000-00119. [DOI] [PubMed] [Google Scholar]
- 13.Technical Guide for ELISA. KPL, Inc; 2013. [Google Scholar]
- 14.Iorga A, Dewey S, Partow-Navid R, Gomes AV, Eghbali M. Pregnancy is associated with decreased cardiac proteasome activity and oxidative stress in mice. PLoS One. 2012;7:e48601. doi: 10.1371/journal.pone.0048601. [DOI] [PMC free article] [PubMed] [Google Scholar]
- 15.Lundholt BK, Scudder KM, Pagliaro L. A simple technique for reducing edge effect in cell-based assays. J Biomol Screen. 2003;8:566–70. doi: 10.1177/1087057103256465. [DOI] [PubMed] [Google Scholar]
- 16.Burt SM, Carter TJ, Kricka LJ. Thermal characteristics of microtitre plates used in immunological assays. J Immunol Methods. 1979;31:231–6. doi: 10.1016/0022-1759(79)90135-2. [DOI] [PubMed] [Google Scholar]
- 17.Bardag-Gorce F, French SW. Delta-aminolevulinic dehydratase is a proteasome interacting protein. Exp Mol Pathol. 2011;91:485–9. doi: 10.1016/j.yexmp.2011.05.003. [DOI] [PMC free article] [PubMed] [Google Scholar]
- 18.Guillaume B, Chapiro J, Stroobant V, Colau D, Van Holle B, Parvizi G, Bousquet-Dubouch MP, Theate I, Parmentier N, Van den Eynde BJ. Two abundant proteasome subtypes that uniquely process some antigens presented by HLA class I molecules. Proc Natl Acad Sci U S A. 2010;107:18599–604. doi: 10.1073/pnas.1009778107. [DOI] [PMC free article] [PubMed] [Google Scholar]
- 19.Pickering AM, Davies KJ. Differential roles of proteasome and immunoproteasome regulators Pa28alphabeta, Pa28gamma and Pa200 in the degradation of oxidized proteins. Arch Biochem Biophys. 2012;523:181–90. doi: 10.1016/j.abb.2012.04.018. [DOI] [PMC free article] [PubMed] [Google Scholar]
- 20.Crawford LJ, Walker B, Ovaa H, Chauhan D, Anderson KC, Morris TC, Irvine AE. Comparative selectivity and specificity of the proteasome inhibitors BzLLLCOCHO, PS-341, and MG-132. Cancer Res. 2006;66:6379–86. doi: 10.1158/0008-5472.CAN-06-0605. [DOI] [PubMed] [Google Scholar]
- 21.Lightcap ES, McCormack TA, Pien CS, Chau V, Adams J, Elliott PJ. Proteasome inhibition measurements: clinical application. Clin Chem. 2000;46:673–83. [PubMed] [Google Scholar]
- 22.Huang L, Ho P, Chen CH. Activation and inhibition of the proteasome by betulinic acid and its derivatives. FEBS Lett. 2007;581:4955–9. doi: 10.1016/j.febslet.2007.09.031. [DOI] [PMC free article] [PubMed] [Google Scholar]
- 23.Katsiki M, Chondrogianni N, Chinou I, Rivett AJ, Gonos ES. The olive constituent oleuropein exhibits proteasome stimulatory properties in vitro and confers life span extension of human embryonic fibroblasts. Rejuvenation Res. 2007;10:157–72. doi: 10.1089/rej.2006.0513. [DOI] [PubMed] [Google Scholar]
- 24.Fulda S, Kroemer G. Targeting mitochondrial apoptosis by betulinic acid in human cancers. Drug Discov Today. 2009;14:885–90. doi: 10.1016/j.drudis.2009.05.015. [DOI] [PubMed] [Google Scholar]
- 25.Reiner T, Parrondo R, de Las Pozas A, Palenzuela D, Perez-Stable C. Betulinic acid selectively increases protein degradation and enhances prostate cancer-specific apoptosis: possible role for inhibition of deubiquitinase activity. PLoS One. 2013;8:e56234. doi: 10.1371/journal.pone.0056234. [DOI] [PMC free article] [PubMed] [Google Scholar]
- 26.Lowry OH, Rosebrough NJ, Farr AL, Randall RJ. Protein measurement with the Folin phenol reagent. J Biol Chem. 1951;193:265–75. [PubMed] [Google Scholar]
- 27.Peterson GL. Review of the Folin phenol protein quantitation method of Lowry, Rosebrough, Farr and Randall. Anal Biochem. 1979;100:201–20. doi: 10.1016/0003-2697(79)90222-7. [DOI] [PubMed] [Google Scholar]
- 28.Bradford MM. A rapid and sensitive method for the quantitation of microgram quantities of protein utilizing the principle of protein-dye binding. Anal Biochem. 1976;72:248–54. doi: 10.1016/0003-2697(76)90527-3. [DOI] [PubMed] [Google Scholar]
- 29.Compton SJ, Jones CG. Mechanism of dye response and interference in the Bradford protein assay. Anal Biochem. 1985;151:369–74. doi: 10.1016/0003-2697(85)90190-3. [DOI] [PubMed] [Google Scholar]
- 30.Stoscheck CM. Quantitation of protein. Methods Enzymol. 1990;182:50–68. doi: 10.1016/0076-6879(90)82008-p. [DOI] [PubMed] [Google Scholar]