The design of molecular switches for the production of responsive or “smart” imaging agents is a major challenge. Of particular interest are agents that respond to biological redox environment to map those disease states that involve redox imbalances.[1] Redox imbalances may be triggered in many ways, including very low oxygen pressure or hypoxia in the case of solid tumors.[2] Importantly, the development of probes to map oxygen levels and corresponding redox status of tumor tissue may guide the development of tumor-selective drugs.[3]
There are several types of imaging agents that report on biological redox status as recently reviewed.[1] Radiodiagnostic probes include 19F-fluoromisonidazole and 64Cu complexes for imaging hypoxic tumor tissue by positron emission tomography (PET). Nitroxide spin labels are used to map oxygen levels by ESR One type of magnetic resonance imaging (MRI) method is based on the oxygen dependence of the 19F signal in fluorinated hydrocarbons. Alternatively, blood-oxygenation level-dependent MRI (BOLD-MRI) tracks changes in paramagnetic deoxyhemoglobin concentration. Metal-based MRI contrast agents that are redox-responsive include Ln(III) contrast agents that feature ligand-based redox switches.[4] An elegant approach employs contrast agents that undergo metal-based redox with the Mn(II)/Mn(III) couple to give a change in T1 relaxivity.[5] One of the challenges with the latter approach is that relatively small differences in the magnetic properties modulate MRI contrast. A metal redox couple that undergoes large changes in magnetic properties and is eminently tunable in the biologically relevant range is Co(II)/Co(III). Here we present, to the best of our knowledge, the first example of a redox active MRI contrast agent that switches between paramagnetic and diamagnetic states to produce MRI active and MRI silent complexes, respectively.
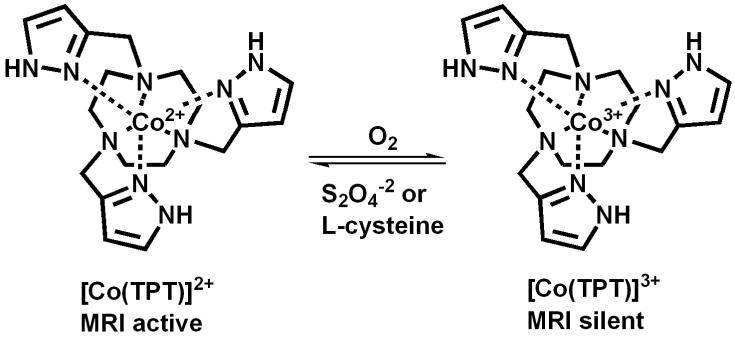
In active form, our metal complex is a PARACEST MRI agent that produces paramagnetically shifted protons that are in exchange with bulk water (PARACEST = paramagnetic chemical exchange saturation transfer).[6] Irradiation at the resonant frequency of the exchangeable proton of the contrast agent partially saturates the magnetization. Exchange with bulk water protons then leads to a reduction in the water signal. Our complexes contain Co(II), one of the premier metal ion shift agents for paramagnetic NMR spectroscopy.[7] The exchangeable pyrazole NH protons of [Co(TPT)]2+ give narrow highly shifted resonances that are suitable for PARACEST contrast whereas Co(III) is diamagnetic and silent as a MRI contrast agent. Our complexes cycle between Co(II) and Co(III) (Scheme 1) based on oxygen pressure or reductant concentration. The triazamacrocycle ring confers stability, and the pyrazole NH protons are a new addition to the repertoire of exchangeable protons for transition metal PARACEST agents.[8]
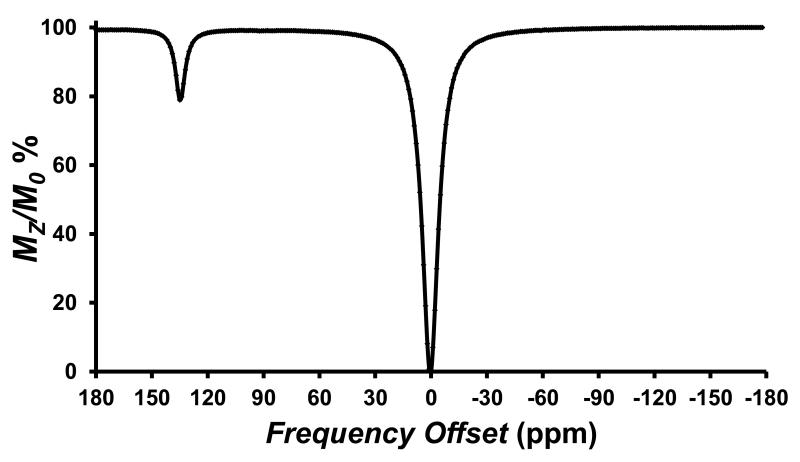
Figure 1.
CEST spectrum recorded at 11.7 T of a solution containing 8.0 mM [Co(TPT)]2+, 100 mM NaCl, 20.0 mM HEPES pH 7.0, 37 °C. with 3 s RF presaturation pulse, B1 = 24 μT. The large peak arises from direct irradiation of water protons, set to 0 ppm.
The blue, air sensitive [Co(TPT)]2+ complex has an effective magnetic moment of 5.7±0.2 BM in aqueous solution, characteristic of high spin octahedral Co(II).[9] The proton NMR spectrum of the complex in D2O has eight highly dispersed proton resonances, consistent with a C3 symmetric complex with a single diastereomeric form at 25 °C (Figure S1). The proton resonances of the pyrazole ring at 14.4 and 82.6 ppm (25 °C) are sharp with FWHM of 54 Hz and 45 Hz, respectively, while the remaining macrocycle proton resonances are relatively broad with FWHM ranging from 820 Hz up to >2000 Hz. Variable temperature 1H NMR studies from 10 to 55 °C show further broadening of the macrocycle proton resonances, consistent with a dynamic process (Figure S2). 1H NMR spectra collected in H2O at pH 5.0 show the presence of an additional peak at 149 ppm which is not present in D2O at 25 °C (Figure S1). This resonance shifts to 140 ppm at 37 °C due to the strong temperature dependence of the hyperfine shift (Figure S2). Notably, as described below, the CEST peak position matches the chemical shift of the exchangeable protons. Thus, the resonance at 140 ppm at 37 °C is tentatively assigned to the pyrazole protons of [Co(TPT)]2+ (Figure S3). In contrast to temperature, pH does not have any detectible effect on the proton chemical shifts of [Co(TPT)]2+ in the pD 5.2 −8.9 range (Figure S4), consistent with a single Co(II) complex species over this pH range.
The [Co(TPT)]2+ complex oxidizes in air to produce the Co(III) complex. Proton resonances in the diamagnetic region of the NMR spectrum of an oxidized sample are characteristic of [Co(TPT)]3+ with no discernible impurities (Figure S5 A). Addition of dithionite again restores the proton NMR spectrum characteristic of the Co(II) complex (Figure S5 B-D).
Both the Co(II) and Co(III) complexes were kinetically inert towards dissociation under biologically relevant conditions. 1H NMR studies in 0.40 mM phosphate, 25.0 mM carbonate, 100 mM NaCl at pH 7.0 showed resonances for the divalent Co(II) complex, and slightly increased amounts of the trivalent complex upon incubation for 24 hours at 37 °C under argon (Figure S6). No other proton resonances were detected that could be assigned to either free ligand or any form of decomposed complex. Incubation of [Co(TPT)]2+ or [Co(TPT)]3+ with an equivalent of Ca2+ or Zn2+ for 24 h showed little dissociation (Table S1).
CEST spectra were obtained for [Co(TPT)]2+ by applying a presaturation pulse in 1 ppm increments and were plotted as normalized water signal intensity (Mz/Mo %) against frequency offset (ppm) (Figure 1). The CEST peak at 135 ppm (versus the proton resonance of water set at zero) is close to the frequency for the exchangeable proton NMR resonance which is attributed to the NH proton of the pyrazole. Other options such as exchangeable water ligand protons are unlikely given that the [Co(TPT)]2+ complex is presumably six-coordinate, and coordinatively saturated based on comparison to related complexes.[10] The CEST peak at 135 ppm is quite remarkable in that it is highly shifted from the bulk water peak. This will minimize interference from magnetization transfer (MT) effects present in tissue and thus may enable higher MRI contrast to noise ratios in vivo.[6]
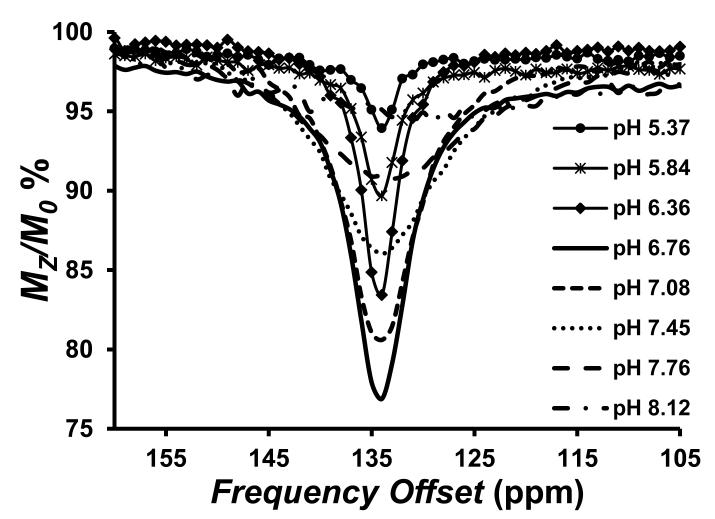
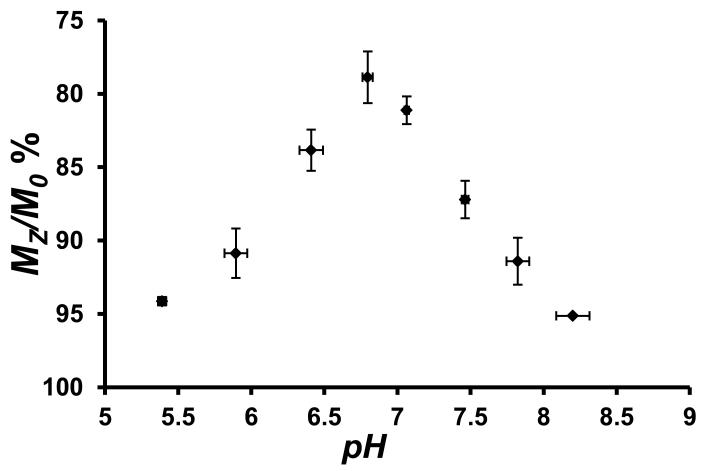
The CEST effect was pH dependent over the pH range of 6–8 with an optimum at pH 6.9 (Figure 2). The increase in the rate constants for proton exchange as a function of pH, as determined by using Omega plots,[11] is consistent with base-catalyzed proton exchange. Rate constants are 6,200 s−1, 9,200 s−1 and 12,400 s−1 at pH 6.4, 6.9 and 7.5, respectively at 37 °C (Figure S7). These rate constants led to an increase in the intensity of the CEST peak as pH increases from 5.4 to 6.9 and then to a decrease in the CEST peak at pH values greater than 6.9 due to rapid proton exchange that leads to CEST peak broadening. The oxidized form of the complex, [Co(TPT)]3+, did not produce a CEST peak at pH 7.1 over the expected chemical shift range for the pyrazole NH of a diamagnetic complex (+15 ppm to −15 ppm, Figure S8). However, addition of either of the reductants dithionite or cysteine reproduced the 135 ppm CEST peak (Figure S9). Reduction by cysteine is significant given that the cysteine/cystine couple is the primary redox buffer in extracellular space.[12] Notably, the CEST spectrum of [Co(TPT)]2+ in serum under argon was similar to that in buffered solution (Figure S10), and no change was observed in the spectrum over 24 h.
Figure 2.
Top: CEST spectra recorded at 11.7 T of solutions containing 8.0 mM [Co(TPT)]2+ in 200 mM NaCl, and 40.0 mM MES, HEPES, or CHES at 37 °C and different pH. RF presaturation applied for 3 seconds, B1 = 24 μT at 37 °C. Bottom: Dependence of [Co(TPT)]2+ CEST intensity at 135 ppm, 37 °C, on pH of the solution.
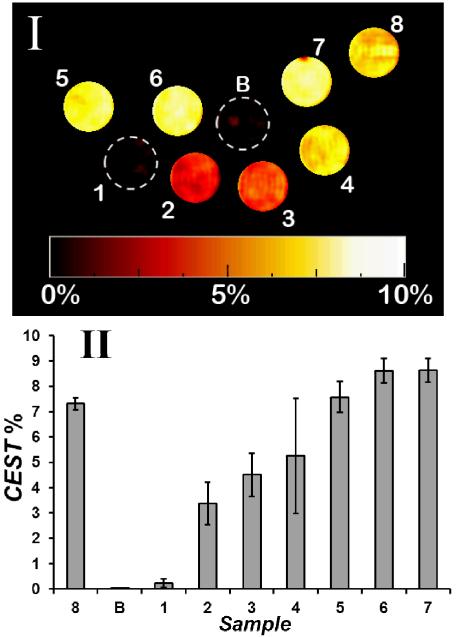
MRI experiments on phantoms showed that the magnitude of CEST contrast correlates with the extent of reduction of [Co(TPT)]3+ to the PARACEST active form of the complex, [Co(TPT)]2+. CEST images were taken on a 4.7 T scanner using a phantom array (Figure 3). A pair of gradient echo images were acquired with a presaturation pulse either on-resonance or off-resonance of the exchangeable protons (135 ppm or −135 ppm). The ratio between these two images is subtracted from 100% to generate a CEST image. Solutions contained 8.0 mM cobalt complex, 200 mM NaCl, 40.0 mM buffer, pH 7.0 at 37 °C with 0 to 1.25 equivalents of dithionite (Na2S2O4). Reference solutions contained buffer, oxidized complex and the divalent [Co(TPT)]2+ complex isolated under argon. The data show that the CEST image increases linearly as dithionate is added and plateaus at 1.0 molar equivalent (Figure 3). In comparison, the slightly lower CEST effect of [Co(TPT)]2+ (Sample 8) prepared under anaerobic conditions is consistent with slight oxidation of the Co(II) sample prior to imaging experiments.
Figure 3.
CEST images of phantoms at 37 °C on a MRI 4.7 T scanner with a pulse train comprised of five Gauss pulses at 12 μT for 1 s, interpulse delay of 200 μs at +/−135 ppm. All solutions contain 40.0 mM HEPES buffer, pH 7.0, 200 mM NaCl, 8.0 mM Co(III)/Co(II) complex . Image (I): 1) [Co(TPT)]3+; 2) [Co(TPT)]3+ and 0.25 eq. Na2S2O4; 3) [Co(TPT)]3+ and 0.38 eq. Na2S2O4; 4) [Co(TPT)]3+ and 0.50 eq Na2S2O ; 5) [Co(TPT)]3+ 4 and 0.75 eq. Na2S2O4; 6) [Co(TPT)]3+ and 1.0 eq. Na2S2O4; 7) [Co(TPT)]3+ and 1.25 eq. Na2S2O4; 8) [Co(TPT)]2+. Scale represents the percent loss of signal due to CEST. Chart (II) represents phantom image intensities (average of three experiments).
The T1 and T2 relaxivities of [Co(TPT)]2+ were 0.093 and 0.50 mM−1s−1, respectively, as measured on the 4.7 T MRI scanner (Figure S11). Similar values were obtained for the complex in serum. These low relaxivities demonstrate that the paramagnetic properties of Co2+ are well-suited for their development as PARACEST agents.
To further characterize the cobalt complex, cyclic voltammetry experiments were carried out in water to determine the reduction potential. [Co(TPT)]2+ exhibited a reversible oxidation peak with a reduction potential of −107±11 mV versus NHE (Figure S12). This moderately negative potential is similar to those reported for Co(II) amino cages and macrocyclic complexes that react with oxygen to form superoxide or peroxide.[13] Reduction of [Co(TPT)]3+ by dithionate or cysteine is supported by these electrochemical measurements.
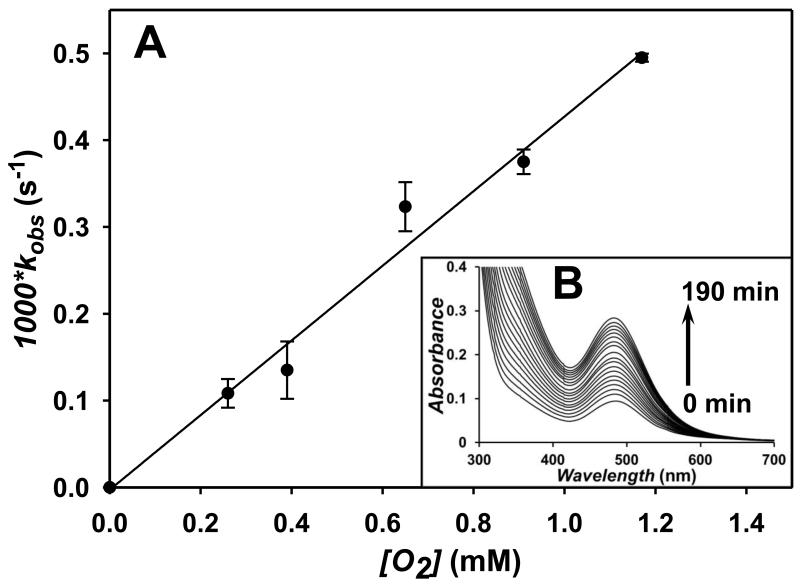
The reaction kinetics of the redox-activated MRI probe is also important. UV-vis spectroscopy provided a convenient means of measuring conversion between Co(II) and Co(III) (Figure S13), by monitoring the increase or decrease of the 485 nm peak characteristic of [Co(TPT)]3+. Using this method, pseudo-first order rate constants for reduction of [Co(TPT)]3+ by excess dithionite were obtained (Figure S14). A plot of pseudo-first order rate constant as a function of dithionate gave a second order rate constant of 0.32 M−1s−1 (Figure S15). Reactions were also conducted under pseudo-first order conditions for oxidation of [Co(TPT)]2+ by excess oxygen (Figure S16). A plot of pseudo-first order rate constants as a function of oxygen concentration gave a second-order rate constant of 0.43 M−1s−1 (Figure 4). This second-order rate constant is similar to rigid Co(II) cages based on triazacyclononane that react with oxygen through outersphere mechanisms.[13] Extrapolation to oxygen levels[14] of 100 mm Hg (0.17 mM O2), representative of arterial blood, gives a rate constant of 7.3 × 10⁻⁵ s−1 (half-life of 2.6 h). Very low oxygen levels in hypoxic conditions (10 mm Hg, 17 μM O2) would give a rate constant of 7.3 × 10⁻⁶ s−1 or a half-life of the complex of 26 h. Notably, electron self-exchange rate constants for Co(III) complexes vary by nine orders of magnitude, suggesting it is feasible to kinetically tune the redox reactions of our CoCEST agents.[15]
Figure 4.
A: Plot of pseudo-first order rate constants for the reaction of 70 μM [Co(TPT)]2+ with oxygen. Solid line represents a linear fit giving kbi = 0.43 M−1s−1. Insert B: Change in absorbance in aerated solutions were recorded at 10 min intervals. Conditions: 200 mM NaCl, 40.0 mM HEPES, pH 7.1 at 25 °C.
In summary, we show here that Co(II) complexes are promising for development as redox-activated MRI contrast agents. Notably, the complexes produce large paramagnetic proton shifts and low proton relaxation enhancements suitable for PARACEST agents. The CEST peak at 135 ppm (37 °C) is shifted further than any of those reported for transition metal ion PARACEST agents to date including those containing Ni(II) and Fe(II).[8, 16] A highly shifted CEST peak is an important feature in overcoming background from magnetization transfer (MT) effects.[6] Furthermore, the Co(II)/Co(III) redox couple is readily tunable over the biologically relevant range of −80 to −280 mV.[15] Challenges for the implementation of these complexes as redox-activated contrast agents include methods for overcoming the dependence of contrast on probe distribution in tissue and decreasing probe concentrations. These challenges may be addressed by incorporating ratiometric properties into the PARACEST agent to account for the tissue concentration dependence, and by using reported approaches to lower the required concentration of the contrast agent.[6]
Supplementary Material
Scheme 1.
Structures of Co(II)/Co(III) complexes.
Footnotes
We gratefully acknowledge the John R. Oishei Foundation, the Bruce Holm Catalyst Fund, the NIH (CA-173309) and NSF (CHE-1310374) for support. MR imaging was supported in part by Roswell Park’s NCI Support Grant (P30CA16056) and the Roswell Park Alliance Foundation.
Supporting information for this article is available on the WWW under http://www.angewandte.org
Contributor Information
Dr. Pavel B. Tsitovich, Department of Chemistry, University at Buffalo, The State University of New York, Amherst, NY 14260, USA
Dr. Joseph A. Spernyak, Department of Cell Stress Biology, Roswell Park Cancer Institute, Buffalo, NY 14263
Prof. Janet R. Morrow, Department of Chemistry, University at Buffalo, The State University of New York, Amherst, NY 14260, USA.
References
- [1].Krohn KA, Link JM, Mason RP. J. Nucl. Med. 2008;49(Suppl 2):129S–148S. doi: 10.2967/jnumed.107.045914. [DOI] [PubMed] [Google Scholar]
- [2].Verma A. Curr. Opin. Clin. Nutr. Metab. Care. 2006;9:366–378. doi: 10.1097/01.mco.0000232895.28674.79. [DOI] [PubMed] [Google Scholar]
- [3].Brown JM, Wilson WR. Nature Rev. Cancer. 2004;4:437–447. doi: 10.1038/nrc1367. [DOI] [PubMed] [Google Scholar]
- [4].a) Tu C, Nagao R, Louie AY. Angew Chem Int Ed Engl. 2009;48:6547–6551. doi: 10.1002/anie.200900984. [DOI] [PMC free article] [PubMed] [Google Scholar]; b) Ratnakar SJ, Viswanathan S, Kovacs Z, Jindal AK, Green KN, Sherry AD. J. Am. Chem. Soc. 2012;134:5798–5800. doi: 10.1021/ja211601k. [DOI] [PMC free article] [PubMed] [Google Scholar]
- [5].a) Aime S, Botta M, Gianolio E, Terreno E. Angew. Chem., Int. Ed. 2000;39:747–750. doi: 10.1002/(sici)1521-3773(20000218)39:4<747::aid-anie747>3.0.co;2-2. [DOI] [PubMed] [Google Scholar]; b) Loving GS, Mukherjee S, Caravan P. J. Am. Chem. Soc. 2013;135:4620–4623. doi: 10.1021/ja312610j. [DOI] [PMC free article] [PubMed] [Google Scholar]
- [6].Viswanathan S, Kovacs Z, Green KN, Ratnakar SJ, Sherry AD. Chem. Rev. 2010;110:2960–3018. doi: 10.1021/cr900284a. [DOI] [PMC free article] [PubMed] [Google Scholar]
- [7].Bertini I, Luchinat C, Parigi G, Pierattelli R. Chembiochem. 2005:1536–1549. doi: 10.1002/cbic.200500124. [DOI] [PubMed] [Google Scholar]
- [8].a) Tsitovich PB, Morrow JR. Inorg. Chim. Acta. 2012;393:3–11. [Google Scholar]; b) Dorazio SJ, Tsitovich PB, Siters KE, Spernyak JA, Morrow JR. J. Am. Chem. Soc. 2011;133:14154–14156. doi: 10.1021/ja204297z. [DOI] [PMC free article] [PubMed] [Google Scholar]
- [9].Barefield EK, Busch DH, Nelson SM. Q. Rev. Chem. Soc. 1968;22:457–498. [Google Scholar]
- [10].Di VM, Mani F, Stoppioni P. J. Chem. Soc., Dalton Trans. 1997:1375–1379. [Google Scholar]
- [11].Dixon WT, Ren J, Lubag AJM, Ratnakar J, Vinogradov E, Hancu I, Lenkinski RE, Sherry AD. Magn. Reson. Med. 2010;63:625–632. doi: 10.1002/mrm.22242. [DOI] [PMC free article] [PubMed] [Google Scholar]
- [12].Banerjee R. J. Biol. Chem. 2012;287:4397–4402. doi: 10.1074/jbc.R111.287995. [DOI] [PMC free article] [PubMed] [Google Scholar]
- [13].Hammershoi A, Sargeson AM. Inorg. Chem. 1983;22:3554–3561. [Google Scholar]
- [14].Carreau A, Hafny-Rahbi BE, Matejuk A, Grillon C, Kieda C. J. Cell. Mol. Med. 2011;15:1239–1253. doi: 10.1111/j.1582-4934.2011.01258.x. [DOI] [PMC free article] [PubMed] [Google Scholar]
- [15].Comba P, Sickmuller AF. Inorg. Chem. 1997;36:4500–4507. doi: 10.1021/ic9701625. [DOI] [PubMed] [Google Scholar]
- [16].a) Olatunde A, Dorazio SJ, Spernyak JA, Morrow JR. J. Am. Chem. Soc. 2012;134:18503–18505. doi: 10.1021/ja307909x. [DOI] [PubMed] [Google Scholar]; b) Dorazio SJ, Morrow JR. Inorg. Chem. 2012;51:7448–7450. doi: 10.1021/ic301001u. [DOI] [PubMed] [Google Scholar]
Associated Data
This section collects any data citations, data availability statements, or supplementary materials included in this article.


