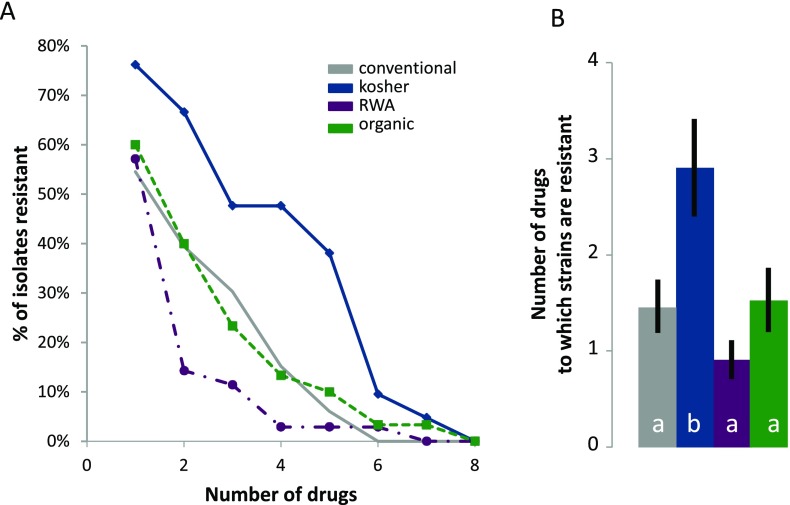
Figure 1.
A. The percentage of resistant strains of E. coli as a function of the number of drugs tested for each of the four categories of chicken sampled. Values shown on the x-axis are cumulative. For example, the percentage of strains resistant to five or more drugs includes strains resistant to five to seven drugs. B. The average number of drugs to which strains of E. coli exhibited resistance in each of the four categories of chicken sampled. Values shown are means ± standard errors of the mean. Category was a significant factor in a one-way ANOVA (P=0.003). Bars with different letters are significantly different at P<0.05 (Tukey’s HSD). RWA-raised without antibiotics.

