

Abstract
Background
Verbal memory impairment is well documented in type 2 diabetes mellitus (T2DM) but to date, the neural substrates remain unclear. The present study evaluated verbal memory and ascertained the degree of frontal and temporal lobe involvement in the anticipated verbal memory impairment among adults with T2DM.
Methods
Forty-six late middle-aged and elderly adults with T2DM and 50 age-, sex-, and education-matched adults without T2DM underwent medical evaluation, verbal memory assessment, and brain MRI evaluations.
Results
As anticipated, participants with T2DM had clear verbal memory impairments. Consistent with prior reports, we found volume reductions restricted to the hippocampus. Our diffusion tensor imaging analysis revealed that participants with T2DM had extensive cerebral gray and white matter microstructural abnormalities predominantly in the left hemisphere, with a larger concentration present in the temporal lobe. In contrast, we uncovered mostly non-specific microstructural abnormalities in the absence of tissue loss in the frontal lobe. Of great importance, we present the first evidence among participants with T2DM linking verbal memory impairment and compromised microstructural integrity of the left parahippocampal gyrus, a key memory-relevant structure.
Conclusions
Our results suggest that the hippocampus and parahippocampal gyrus may be particularly vulnerable to the deleterious effects of T2DM. The parahippocampal gyrus in particular may play a crucial role in the verbal memory impairments frequently reported in T2DM. Future studies should employ methods such as resting state functional magnetic resonance imaging and diffusion tensor imaging tractography to better characterize network connectivity, which may help further characterize the verbal memory impairment frequently reported in T2DM.
Keywords: T2DM, verbal memory, diffusion tensor imaging, hippocampus, parahippocampal gyrus
INTRODUCTION
Type 2 diabetes mellitus (T2DM) has been linked to cognitive impairment in addition to a multitude of secondary health complications, including stroke, retinopathy, and neuropathy. Verbal memory in particular, is the cognitive domain most consistently reported to be affected in T2DM (Allen, Frier, & Strachan, 2004; Strachan, Deary, Ewing, & Frier, 1997). As a result of these cognitive impairments daily functioning may be compromised (Bruce et al., 2003), particularly among older individuals with T2DM. The underlying brain substrates for these impairments remain an issue that has not been systematically explored.
There is a small but growing literature demonstrating cerebral complications in adults with T2DM, and these include non-specific brain abnormalities, as well as cortical and subcortical atrophy (Manschot et al., 2006), enlarged ventricles, increased white matter lesions (WMLs; Manschot, et al., 2006), and an elevated risk for lacunar infarcts (Jongen et al., 2007). Only a handful of these studies have evaluated the relationship between cerebral complications and cognitive decline (e.g., Manschot, et al., 2006; Yau et al., 2009); therefore how these and other brain abnormalities explain the reductions in cognitive performance reported in patients with T2DM remains unclear.
Declarative or recent memory relies on intact temporal and frontal lobes, therefore, given the recent memory deficits present, these brain regions may be particularly vulnerable to damage in T2DM and frequently associated co-morbid conditions (e.g., Gold et al., 2007; Sahin et al., 2007). For example, volume reductions of medial temporal lobe (MTL) structures, including the hippocampus and amygdala, and white matter (WM) microstructural abnormalities have been described in patients with T2DM, but there is very limited evidence linking these brain anomalies to reduced cognitive performance (Gold, et al., 2007; Yau, et al., 2009). Other reports of frontal lobe complications, including gray matter (GM) volume reductions (Kumar, Anstey, Cherbuin, Wen, & Sachdev, 2008), diffuse WM microstructural abnormalities (Yau, et al., 2009), and altered cerebral metabolism (Modi et al., 2008; Sahin, et al., 2007) highlight the frontal lobe as another frequently affected region. Despite these data, the involvement of temporal and frontal lobe pathology in the recent memory impairments reported in T2DM remains to be better elucidated.
In order to explore possible cerebral substrates underlying verbal memory impairments in T2DM, the present study assessed regional brain volumes and cortical thickness of frontal and temporal lobe structures in adults with T2DM relative to age-matched controls. Furthermore, and in light of our previous reports of cerebral microstructural damage in adults (Yau, et al., 2009) and adolescents (Yau et al., 2010) with T2DM, we also utilized diffusion tensor imaging (DTI) methods to assess the microstructural integrity of both gray and white matter (GM and WM), and, when appropriate, ascertained their relationships to verbal memory.
METHODS
Participants
Forty-six middle-aged and elderly participants with T2DM (age, M = 58.79 years, SD = 8.20 years) and 50 participants without insulin resistance (age, M = 58.80 years, SD = 7.91) were consecutively recruited for an ongoing diabetes project. All participants were community-residing individuals with no impairments in their day to day functioning, medically stable (other than some of them having diabetes, hypertension, or dyslipidemia), and free of psychiatric illness or significant vascular disease. Participants had a minimum of a high-school education. Individuals were excluded if they had a history of or current insulin treatment. They were also excluded if they had uncontrolled hypertension (blood pressure [BP] > 150/90 mm/Hg), significant coronary ischemic disease detected on the Electrocardiogram or a Modified Hachinski Ischemia Scale (Hachinski, 1983) score > 4, any focal neurological signs, current diagnosis or past history of stroke or significant head trauma, or evidence of tumor on the structural MR scan. Control subjects had to have normal fasting glucose levels (< 3.89 or > 6.99 mmol/L) and show no evidence of obvious insulin resistance (IR) as demonstrated by their fasting glucose and insulin levels.
Participants received medical, endocrine, psychiatric, neuropsychological, and brain MRI evaluations during a comprehensive 8-hour evaluation completed over two visits within one month. The neuropsychological assessment was conducted in the post-prandial state, split over two sessions with a total time of approximately 2.5 hours. The protocol was approved by the Internal Review Board of the New York University School of Medicine. All participants signed informed consent.
Subject classification
Diabetic participants fulfilled one or more of the following: (1) had a fasting blood glucose > 6.94 mmol/L on two separate occasions, (2) a 2-h blood glucose level >11.10 mmol/L during a 75-g oral glucose tolerance test, or (3) a prior diagnosis of T2DM. So as to avoid possible confounding effects of episodes of severe hypoglycemia, none of the participants with T2DM had ever been on insulin treatment. Control participants had no significant IR, indicated by a Quantitative Insulin Sensitivity Check Index (QUICKI) score (QUICKI = 1/[log10(fasting glucose (mg/dL)) + log10(fasting insulin (μU/mL))]; Katz et al., 2000) of 0.350 or above. Sitting BP was determined by averaging two readings obtained during the second visit. Participants were classified as hypertensive if they received anti-hypertensive treatment or had a sitting BP above the National Cholesterol Education Program cut-off (a systolic BP ≥ 130 mmHg or a diastolic BP ≥ 85 mmHg (Expert Panel on Detection of, Evaluation, and Treatment of High Blood Cholesterol in Adults, 2001).
Neuropsychological assessment
The neuropsychological evaluation was conducted blind to group membership in a standardized fashion, postprandially, and split into two 1.5-h sessions on separate days. The Shipley Institute of Living Scale (Shipley, 1940) was used to estimate WAIS-R Full Scale IQ score stratified by age. Verbal memory was assessed with the Guild Memory Test (Gilbert, Levee, & Catalano, 1968), the California Verbal Learning Test (CVLT; Delis, Kramer, Kaplan, & Ober, 1987), and the Logical Memory and Verbal Paired-Associates subtests of the Wechsler Memory Scale Revised (WMS-R; Wechsler, 1981).
Magnetic resonance imaging (MRI) assessment
Image acquisition
One participant with T2DM did not receive MR evaluation due to scheduling conflicts, leaving a total of 95 participants with structural MR scans either on the 1.5 T Siemens Avanto machine (59 participants: 32 T2DM and 27 controls) or the 1.5 T General Electric Vision machine (36 participants: 13 T2DM and 23 controls) using equivalent sequences. Only participants scanned on the Siemens machine had DTI and other MR sequences (see below) for supporting assessment of both gray and white matter microstructural integrity.
Sequences acquired on the Siemens 1.5T Avanto machine
A T1-weighted magnetization-prepared rapid acquisition gradient echo (MPRAGE) sequence (TR 1300 ms; TE 4.38 ms; TI 800 ms; FOV 250 × 250; 196 coronal slices; slice thickness 1.2 mm; no gap; NEX 1; Flip angle 15°) was used for volumetric assessment. A DTI echo planar sequence (TR 6100 ms; TE 75 ms; delay in TR = 0; b values 0, 1000 s/mm2; 6 diffusion directions; FOV 210 × 210; 4 averages and 1 concatenation; 50 axial slices; no gap; voxel size 1.64 × 1.64 × 3 mm3) was acquired to assess brain microstructural integrity. A T2-weighted (TR 9000 ms, TE 94 ms; TI 2000 ms; FOV 210 × 210; 50 axial slices; slice thickness 3 mm) and a fluid-attenuated inversion recovery (FLAIR; TR 9000 ms; TE 97 ms; FOV 210 × 210; 1 average and 2 concatenations; 50 axial slices; no gap; Flip angle 145°) sequence were acquired to support DTI analysis. The FLAIR sequence was also used together with the MPRAGE to rule out primary neurological disease. To optimize image registration, the DTI, T2-weighted, and FLAIR sequences were acquired in the same orientation, number of slice, and thickness and were standardized at a scan angle parallel to a line drawn between the anterior and posterior commissure (AC-PC line).
Sequences acquired on the General Electric 1.5T Vision machine
The T1-weighted spoiled-gradient inversion recovery (SPGIR) sequence (TR 30 ms; TE 2 ms; FOV 250×250 mm; 124 coronal slices; slice thickness 1.5 mm; no gap; NEX 1; Flip angle 60°), equivalent to the T1-weighted MPRAGE sequence acquired on the Siemens scanner, was also used for volumetric assessment. Notably, participants did not differ demographically across machines. Validation analysis that was previously conducted on MR structural scans acquired on both scanners for 10 individuals confirmed no inter-machine volume differences.
Brain volumetric assessment
Volumetric assessment was done, blind to participants’ identity and diagnosis, using a software developed in-house and called Multimodal Image Data Analysis System v.1.11 (Tsui, 1995). The structural MPRAGE and SPGIR images were re-formatted into the standardized “pathological angle” coronal plane, normalized to correct for signal inhomogeneity, thus ensuring adequate gray–white matter contrast so as to optimize the volume assessments.
We obtained an estimate of “pre-morbid” brain size by manually tracing the intracranial vault (ICV) in the sagittal plane of the structural MPRAGE (or SPGIR) image by following the margins of the dura and tentorium. Using an operator-based intensity threshold, we identified the cerebral spinal fluid (CSF) voxels of the ICV, which provides an estimate of the global atrophy. The prefrontal region (PFR), dorsolateral prefrontal region (DLPFR), hippocampus, and superior temporal gyrus (STG) were manually traced in the coronal plane using reliable methods previously described (Convit et al., 1997; Convit et al., 2001). To minimize the number of comparisons, the average volume of the left and right hemispheres of each structure were utilized in the analyses. In order to adjust for individual variability in head size, we computed the unstandardized residuals of the brain volumes to the ICV using linear regression.
DTI-based cerebral white and gray matter microstructural assessment
To assess WM microstructural integrity we used fractional anisotropy (FA), with values ranging from 0 (fully isotropic diffusion) to 1 (fully anisotropic diffusion), thus higher values indicate better microstructural integrity (Basser & Pierpaoli, 1996). The mean diffusivity (MD), which represents the mean magnitude of water diffusivity, is used to evaluate GM tissue density (Li et al., 2013) with the lower the MD, the more integral the GM.
The diffusion tensor is estimated using the algorithm detailed in Koay et al. (2006). To create the group maps in standard (Talairach) space for voxelwise group comparisons, we utilized a three-step approach with the Automated Registration Toolkit 2 (ART2; Ardekani et al., 2005), a published and well described method. Briefly, the skull-stripped structural native MPRAGE image was normalized to the standard Montreal Neurological Institute brain template using a 3D non-linear warping algorithm. Second, a rigid-body linear transformation optimized the registration between T2 and MPRAGE by iteratively correcting for subject motion. Third, with a non-linear 2D warping algorithm, the non-diffusion-weighted b0 image was iteratively warped to correct for spatial distortions inherent in echo planar acquisitions using the skull-stripped T2 image as a guide. Finally, to reduce interpolation errors, we applied the transformation parameters obtained from previous steps to spatially correct and normalize the native FA maps to Talairach space.
FreeSurfer-based cortical thickness measurement
Cortical reconstruction and volumetric segmentation of the structural images were performed using standard procedures in the FreeSurfer Image Analysis Suite, Version 4.0.2, which is documented and freely available for download online (http://surfer.nmr.mgh.harvard.edu). The structural MPRAGE or SPGIR scans were first subjected to an affine transformation to Talairach space and was then segmented into cortical gray and white matter (Desikan et al., 2006). The segmented brain was subjected to topological correction and smoothing (Fischl, Liu, & Dale, 2001). The cortex was inflated, flattened and registered to a spherical atlas (Fischl, Salat, et al., 2004; Fischl, Sereno, & Dale, 1999). An anatomical label is assigned to each vertex on the cortical sheet based on stored prior statistics about cortical structures (Fischl, Van der, et al., 2004). The average cortical thickness for each anatomical label is represented by the distance between the gray/white boundary to the gray/CSF (pial) boundary at each vertex (Fischl & Dale, 2000).
FreeSurfer generates extensive number of brain regions, however, for this study only the frontal and temporal regions that corresponded to the results from the automated DTI-based analysis described below were selected for the statistical analysis. The average cortical thickness of each selected region was determined by the average of the cortical thickness, weighted by the surface areas of both the left and right sides.
Statistical analyses
Group differences were evaluated using the independent samples t-test for continuous variables and the chi-square test for independence for categorical variables. The memory variables were organized into immediate and delayed memory recall domains. The brain variables were separated into frontal and temporal lobe domains. For variables that were non-normally distributed, the data were evaluated with t-tests and the results were confirmed with the Mann-Whitney U test. By domain, the Bonferroni-Holm step-down test (Holm, 1979) was used to control for Type 1 error across the t-tests.
Group FA and MD maps in standard space were subjected to a two-tailed voxelwise analysis of covariance (VANCOVA) within the ART2 package, with age as a covariate. WM and GM masks created from the average of the MPRAGE images of all participants in standard space were used to restrict group FA and MD comparisons, respectively. For the group comparisons of WM FA, we also used the FLAIR image as a covariate to ascertain the subtle reductions in WM integrity in addition to the obvious WM damage that can be determined from the FLAIR images. To minimize the chance of Type I errors, we restricted the accepted cluster size to those having at least 100 contiguous voxels (each voxel is 1 mm3, thus, a minimum cluster size of 0.1 cc in volume) and derived an adjusted p-value threshold to ensure that the false discovery rate would be kept below 1% (Benjamini & Hochberg, 1995).
Spearman’s correlation analyses were conducted to identify the brain measures among volumes, cortical thickness, and DTI that were associated with domain-specific memory performance among participants with T2DM. To derive a composite score for each of the two memory domains, we first z-score transformed (using the mean and standard deviation of the control group) the raw scores of each individual measure that showed at least a statistical trend in the group contrast after controlling for multiple comparisons. The resulting z-scores were then averaged for each of the two domains to yield a composite score to be evaluated in the correlation analyses. To derive the FA or MD value for each chosen significant cluster at the subject level, the clusters that were derived in Talairach space were then mapped onto the case level DTI maps from which the mean FA or MD value was derived for the chosen clusters.
RESULTS
Demographic and endocrine results
The groups were comparable in age, sex (T2DM, 24F/22M; controls, 29F/21 M; χ2[1, n=96] = 0.33, n.s.), years of education, and ethnicity distributions (T2DM, 27 Caucasians, 15 Hispanic/African Americans, and 4 Asians; controls, 40 Caucasians, 9 Hispanic/African Americans, and 1 Asian, χ2[96] = 5.67, p < .10); see Table 1). By definition, participants with T2DM had significantly worse glycemic control than control subjects and their mean diabetes duration was 7.48 years (SD = 6.69; range, 0.07 – 29.88 years). Overall, 26/46 participants with T2DM and 6/50 controls were obese. Although more participants with diabetes (32/46 T2DM vs. 17/50 controls) were also classified as hypertensive, χ2[1, n=96] = 12.13, p < .001, the groups did not differ in systolic or diastolic BP, likely due to the fact that individuals with T2DM are more likely to receive antihypertensive treatment (29/32 T2DM vs. 5/17 controls). Participants with T2DM had significantly lower HDL and higher triglycerides than controls. Conversely, participants with T2DM had significantly lower levels of total cholesterol and LDL, which is not surprising as 26/46 participants with T2DM vs. 6/50 controls were on cholesterol lowering (statin) treatment.
Table 1.
Demographic and Endocrine Data
| T2DM (n = 46) mean (SD) |
Control (n = 50) mean (SD) |
t | p | Cohen’s d | |
|---|---|---|---|---|---|
| Age | 58.79 (8.20) (42.52 – 75.75) |
58.80 (7.91) (43.52 – 75.75) |
−0.01 | 1.00 | .00 |
| Education (years)§ | 15.43 (2.49) (12 – 20) |
15.84 (2.06) (12 – 21) |
−0.87 | .39 | −.18 |
| BMI (kg/m2)a § | 32.80 (6.97) | 24.81 (4.14) | 6.72 | < .001 | .40 |
| QUICKI Score§ | 0.32 (0.04) | 0.39 (0.03) | −9.17 | < .001 | −1.87 |
| HbA1C (%)a | 7.84 (1.86) | 5.32 (0.43) | 8.87 | < .001 | 1.90 |
| Fasting Glucose (mmol/L)a § | 7.90 (3.03) | 4.31 (0.50) | 7.93 | < .001 | 1.69 |
| Fasting Insulin (mmol/L)a § | 98.33 (74.22) | 38.65 (15.32) | 5.35 | < .001 | 1.14 |
| Systolic BP (mmHg) | 122.39 (11.77) | 118.53 (13.75) | 1.47 | .14 | .30 |
| Diastolic BP (mmHg) | 72.11 (7.22) | 71.64 (7.32) | 0.31 | .76 | .06 |
| Total Cholesterol (mmol/L)a § | 4.45 (0.90) | 4.95 (0.94) | −2.68 | .01 | −.55 |
| HDL (mmol/L) | 1.17 (0.31) | 1.47 (0.36) | −4.30 | < .001 | −.88 |
| Triglycerides (mmol/L)a § | 1.49 (1.03) | 1.02 (0.39) | 2.91 | .01 | .61 |
| LDL (mmol/L)§ | 2.64 (0.80) | 3.02 (0.89) | −2.16 | .03 | −.44 |
| Fibrinogen (μmol/L)§ | 10.85 (2.87) | 9.59 (2.66) | 2.22 | .03 | .46 |
| CRP (mg/dL)§ | 33.91 (36.86) | 20.48 (27.81) | 1.93 | .06 | .42 |
Adjusting for unequal variances
These variables were non-normally distributed in at least one of the groups and the t-test results were confirmed to be consistent with those obtained using non-parametric test, Mann-Whitney Z test.
Neuropsychological results
Relative to controls, participants with T2DM had significantly lower estimated IQ scores and scored consistently lower across all verbal memory measures, with small-medium to medium-large effect sizes (see Table 2). For measures of immediate verbal memory, all except the WMS-R Verbal Paired Associates Immediate Recall attained statistical significance. After controlling for multiple comparisons, all remained significant with the exception of the CVLT Short Delay Cued Recall and WMS-R Verbal Paired Associates Immediate Recall measures.
Table 2.
Cognitive Results
| T2DM (n = 46) mean (SD) |
Control (n = 50) mean (SD) |
t | p | Cohen’s d | |
|---|---|---|---|---|---|
| WAIS-R Est. Full Scale IQ | 106.48(11.81) | 112.16 (11.39) | −2.40 | .02 | −.49 |
| Verbal Memory Immediate Recall | |||||
| CVLT Short Delay Free Recall* | 11.00 (3.72) | 12.90 (2.74) | −2.82 | .01 | −.58 |
| CVLT Short Delay Cued Recalla § | 11.91 (2.70) | 13.04 (2.56) | −2.10 | .04 | −.43 |
| WMSR Logical Mem. Imm. Recall* | 27.56 (6.32) | 31.04 (6.99) | −2.54 | .01 | −.52 |
| Guild Paragraph - Imm. Recall*§ | 5.51 (2.23) | 7.26 (2.51) | −3.57 | .001 | −.74 |
| WMSR Verbal Paired Imm. Recalla § | 19.84 (4.01) | 21.26 (3.59) | −1.81 | .07 | −.37 |
| Verbal Memory Delayed Recall | |||||
| CVLT Long Delay Free Recall§ | 11.70 (3.25) | 12.96 (2.94) | −2.00 | .05 | −.41 |
| CVLT Long Delay Cued Recall§ | 12.46 (2.79) | 13.24 (2.45) | −1.47 | .15 | −.30 |
| WMSR Logical Mem. Del. Recall*§ | 22.38 (7.81) | 27.02 (7.89) | −2.88 | .01 | −.59 |
| Guild Paragraph - Del. Recalla § | 7.32 (3.18) | 8.95 (3.48) | −2.37 | .02 | −.49 |
| WMSR Verbal Paired Del. Recall§ | 7.41 (0.92) | 7.70 (0.71) | −1.70 | .09 | −.36 |
Remaining significant after controlling for multiple comparisons
Statistical trend after controlling for multiple comparisons
These variables were non-normally distributed in at least one of the groups and the t-test results were confirmed to be consistent with those obtained using non-parametric test, Mann-Whitney Z test.
For delayed memory performance, participants with T2DM scored significantly worse for the WMS-R Logical Memory Delayed Recall, Guild Paragraph Delayed Recall measures, and CVLT Long Delay Free Recall, and trended lower for WMS-R Verbal Paired Associates Delayed Recall. After controlling for multiple comparisons, the WMS-R Logical Memory Delayed Recall score remained significant and the Guild Paragraph Delayed Recall score became a statistical trend (p-value threshold = 0.013), but the group difference for the CVLT Long Delay Free Recall score was no longer significant.
DTI voxelwsie results
Of the 59 cases with DTI data, three scans (all individuals with T2DM) were excluded due to extensive movement artifacts or spatial distortions, leaving a total of 56 DTI scans (T2DM, n = 29, age, M = 57.87 years, SD = 7.14, 15 F/14 M; controls, n = 27, age, M = 58.22 years, SD = 7.42, 15 F/12 M) for analysis.
White matter FA results
The VANCOVA analysis identified a total of 15 significant WM clusters (3,471 voxels or 3.47 cc in volume, p < .01), 13 of which demonstrated significant FA reductions among participants with T2DM (3,228 voxels or 3.23 cc in volume), independent of age and WM hyperintensities seen on the FLAIR image. More clusters were identified in the left hemisphere, with a large concentration located in the temporal regions involved in auditory and memory processing, including bilateral arcuate fasciculi, left superior temporal WM, and right middle temporal WM. Three clusters were found in the parietal lobe, where the largest WM FA cluster was identified; three were in the frontal lobe and two in the occipital lobe. Six of these 13 clusters of significant FA reduction remained significant at the next more conservative p-value of 0.005 (FDR < 0.005; marked with a “*” on Figure 1). Given the extensive number of clusters of abnormality, we chose to only display the largest 10 clusters on Figure 1.
Figure 1. Ten Largest Clusters Demonstrating Significant White Matter FA Reduction among Participants with T2DM (p < .01).

The significant clusters of FA reduction (blue) are displayed in order of size (cluster size in parentheses), from left to right. In each of the two panels, the three rows of images, each showing an orthogonal orientation (axial, coronal, and sagittal), display the clusters with an arrow pointing to the cluster. The displayed clusters that remained significant at p < .005 are marked with an “*”.
The two clusters demonstrating significant WM FA elevations among participants with T2DM (right anterior limb of the internal capsule [132 voxels], and right frontal WM [111 voxels]) were among the smallest four clusters identified and neither remained significant at p < .005.
Gray matter MD results
The VANCOVA analysis revealed a total of 26 clusters of MD elevation in GM among participants with T2DM relative to controls (p < .01); three of those clusters demonstrating GM MD elevations among participants with T2DM were discarded due to significant CSF contamination. The largest cluster also had some CSF contamination that was proportionally small relative to its overall size of 1,034 voxels of the cluster; it was therefore retained. Twenty-two of the remaining clusters (totaling 5,694 voxels or 5.69 cc in volume) demonstrated significant MD elevation among participants with T2DM relative to controls. Ten were located in the temporal regions, including bilateral Heschl’s gyri, bilateral parahippocampal gyrus (PHG), bilateral fusiform areas, and right insular cortex; five clusters were located in the occipital lobe, mostly along the calcarine fissure bilaterally; five clusters were also identified in the frontal lobe, primarily in the prefrontal cortex; only two clusters were found in the parietal lobe. Figure 2 displays the largest 10 clusters in order of size. Thirteen (including all 10 clusters displayed on Figure 2) of the 22 clusters remained significant at the next more conservative p-value of 0.005 (FDR < 0.005). The only cluster (113 voxels or 0.113 cc in volume) demonstrating significant MD reduction among participants with T2DM was located in the occipital lobe and was among the three smallest clusters.
Figure 2. Ten Largest Clusters Demonstrating Significant Gray Matter MD Elevation among Participants with T2DM (p < .01).

The significant clusters of MD elevation (yellow/orange) are displayed in order of size (cluster size in parentheses), from left to right. In each of the two panels, the three rows of images, each showing an orthogonal orientation (axial, coronal, and sagittal), display the clusters with an arrow pointing to the cluster. All displayed clusters remained significant at p < .005.
Brain volume and cortical thickness
The groups did not differ in ICV volume or ICV-adjusted global atrophy. Among the operator-defined regional volume measures, only average ICV-adjusted hippocampal volume was significant, showing smaller volumes among participants with T2DM and the result remained significant even after accounting for multiple comparisons (p-value threshold = 0.01; see Table 3). Cortical thickness in the temporal lobe was also assessed in selective regions that are either relevant to memory function or were identified as having microstructural alterations in the voxelwise MD analyses (see Table 3). The average MTL cortical thickness was the only temporal lobe measure that attained a statistical trend, which did not remain so after controlling for multiple comparisons (p-value threshold = 0.013). For the cortical thickness in the frontal lobe domain, only the overall frontal lobe thickness was evaluated. None of the frontal lobe measures differentiated the groups (see Table 3).
Table 3.
Frontal and Temporal Lobe Volumes and Cortical Thickness
| Measures | T2DM (n = 44) mean (SD) |
Control (n = 50) mean (SD) |
t | p | Cohen’s d |
|---|---|---|---|---|---|
| Frontal Lobe | |||||
| ICV-Adj. Prefrontal Volume (cc) | 271.8 (36.38) | 280 (36.03) | −1.20 | .23 | −.25 |
| ICV-Adj. Dorsolateral Prefrontal Volume (cc) | 218.8 (32.62) | 219 (28.16) | 0.38 | .71 | .08 |
| Total Frontal Cortical Thickness (mm) | 2.43 (0.15) | 2.46 (0.14) | −1.03 | .31 | −.21 |
| Temporal Lobe | |||||
| ICV-Adj. Hippocampal Volume (cc) * | 2.75 (0.33) | 2.93 (0.30) | −3.03 | <.01 | −.63 |
| ICV-Adj. STG Volume (cc) | 23.15 (3.44) | 23.02 (3.23) | 0.49 | .62 | .10 |
| Avg STG Cortical Thickness (mm) | 2.58 (0.16) | 2.62 (0.16) | −1.27 | .21 | −.26 |
| Avg Fusiform Cortical Thickness (mm) | 2.60 (0.15) | 2.63 (0.13) | −1.24 | .22 | −.26 |
| Avg MTL Cortical Thickness (mm) | 2.75 (0.18) | 2.82 (0.18) | −1.84 | .07 | −.38 |
| Avg PHG Cortical Thickness (mm) | 2.59 (0.27) | 2.58 (0.26) | 0.14 | .89 | .03 |
| Avg Entorhinal Cortical Thickness (mm) | 3.39 (0.35) | 3.36 (0.33) | 0.39 | .70 | .08 |
ICV-adjusted brain volumes were being analyzed; for ease of interpretation, raw values for the descriptive data are presented.
Remained significant after controlling for multiple comparisons
The brain volume and cortical thickness and cognitive results remained the same even after controlling for age and sex. To rule out inflammation, commonly associated with obesity, as a potential confounding factor for the cognitive and brain observations, we repeated the analyses using General Linear Model controlling for CRP and confirmed that the results remained essentially unchanged.
Associations between temporal lobe structures and verbal memory in T2DM
Given that the most prominent findings were restricted to temporal lobe structures, exploratory analyses were conducted to examine, only among participants with T2DM, possible associations between verbal memory performance, both immediate and delayed recall, and temporal lobe measures including ICV-adjusted average hippocampal volume and the DTI measures that differentiated the groups.
Given the extensive findings of brain microstructural damage from the voxelwise analysis, only selective temporal lobe clusters demonstrating significant FA reduction or MD elevation in those subjects with DTI scans were included in the analyses. Those clusters were located in the left and right arcuate fasciculi (368 and 286 voxels, respectively), left superior temporal WM FA (223 voxels), left temporal stem FA (161 voxels), left PHG MD (442 voxels), and left (118 voxels) and right (227 voxels) Heschl’s gyri MD.
Spearman’s correlation analyses found no relationship between ICV-adjusted average hippocampal volume and composite scores for verbal memory immediate or delayed recall among participants with T2DM (see Table 4). No correlation was found even when examining left or right hippocampal volume separately. Of the selected FA and MD clusters, only the MD value of the left PHG MD cluster (the 3rd largest showing GM MD elevation in T2DM illustrated in Figure 2) correlated negatively and significantly with verbal memory immediate, rs(25) = −0.54, p < .01 (see Figure 3a) and delayed recall composite scores, rs(25) = −0.44, p < .05 (see Table 4 and Figure 3b). These associations remained significant even after controlling for age and sex.
Table 4.
Spearman’s Correlation between Verbal Memory and Temporal Lobe Structures in T2DM
| Verbal Memory Immediate Recall Composite Score Spearman’s rho |
Verbal Memory Delayed Recall Composite Score Spearman’s rho |
|
|---|---|---|
| ICV-Adj. Average Hippocampal Volume | 0.02 | −0.01 |
| MD - Left PHG | −0.54* | −0.44* |
| MD - Left Transverse Temporal Gyrus | −0.12 | −0.04 |
| MD - Right Transverse Temporal Gyrus | −0.10 | 0.10 |
| FA - Left STG | 0.28 | 0.11 |
| FA - Left Arcuate Fasciculus | 0.16 | 0.11 |
| FA - Right Arcuate Fasciculus | −0.01 | −0.14 |
| FA - Left Temporal Stem | 0.03 | −0.19 |
p < .05
Figure 3.
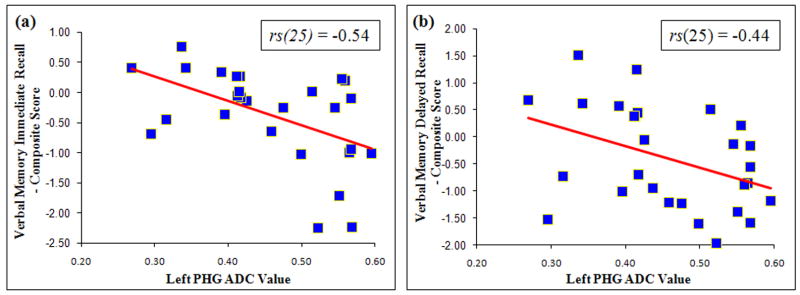
Inverse Relationships between MD Values in the Left PHG Cluster and Verbal Memory (a) Immediate and (b) Delayed Recall Composite Scores among Participants with T2DM
DISCUSSION
Consistent with our hypotheses, late middle-aged and elderly adults with T2DM present clear verbal memory impairment, and supporting the cognitive results, we found brain volume reductions restricted to the hippocampus as well as extensive microstructural abnormalities of temporal lobe GM and WM, while the frontal lobe is largely spared. It is of note that this is the first preliminary evidence linking verbal memory impairment in patients with T2DM and compromised microstructural integrity of the left PHG, a region key in recent memory.
Congruent with data from both manual (den Heijer et al., 2003; Gold, et al., 2007) and automated (Brundel, van den Heuvel, de Bresser, Kappelle, & Biessels, 2010) brain assessments in T2DM, the current report represents part of the small literature documenting bilateral hippocampal atrophy in addition to clear evidence of diminished hippocampal-based declarative memory performance in a group of mostly late middle-age individuals with T2DM. Together with our prior reports (Bruehl et al., 2009; Gold, et al., 2007), the current data provide solid evidence highlighting the hippocampus as the brain structure particularly vulnerable to damage not only in adults but also in adolescents with T2DM (Bruehl, Sweat, Tirsi, Shah, & Convit, 2011).
Although we have previously found an association between hippocampal volume and both immediate and delayed memory performance, this was among individuals in the pre-clinical stages of Alzheimer’s disease, a condition with very specific and early hippocampal degeneration (Convit et al., 1993). More recently we reported weak associations between hippocampal volume and memory, but the findings were limited to individual verbal memory measures, and the weak associations were observed for diabetics and controls combined (Gold, et al., 2007). Our current findings differ from those of our previous reports in that we utilized composite scores, rather than scores of individual measures. Also, our correlation analyses were restricted to individuals with T2DM.
Nonetheless, the lack of a connection between hippocampal volume and verbal memory impairment is not surprising as a meta-analysis of results from 33 studies of various conditions found little evidence supporting a relationship between hippocampal volume and memory ability (Van Petten, 2004). It is possible that different subregions in the hippocampus have distinct cognitive roles (Brickman, Stern, & Small, 2011), which may help explain why hippocampus-memory associations have been inconsistent so far. Other dimensions of hippocampal abnormalities, such as altered cellular metabolism (Ajilore et al., 2006; Kantarci et al., 2002; Sahin, et al., 2007) and impaired functional connectivity between the hippocampus and other memory-relevant structures (Zhou et al., 2010), are among other possible mechanisms.
In the absence of obvious structural changes, the DTI analysis identified widespread GM and WM microstructural abnormalities, with more clusters of abnormality identified bilaterally in the temporal lobe, and 70% of the WM clusters of FA reduction were located in the left hemisphere. Specifically, we found extensive reductions of microstructural integrity in WM tracts possibly involved in language, auditory processing, and verbal memory, namely prefrontal WM, superior longitudinal fasciculus, and arcuate fasciculus. Although information regarding brain functional connectivity is unavailable in the current study, extrapolating from the existing literature documenting gross WM abnormalities (Manschot et al., 2007; Novak et al., 2006; Sahin, et al., 2007) and our previous (Yau, et al., 2009) and current findings of extensive reductions of microstructural WM integrity among adults with T2DM, it is possible that subtle disruptions in fiber connectivity within the memory network is another contributing factor.
Of the temporal cortical clusters shown to be affected on the DTI analyses, only the MD values of the left PHG, which represented the most extensive GM microstructural abnormalities found in the temporal lobe, correlated significantly with both immediate and delayed recall of verbal memory. This is the first evidence of an association between verbal memory decline and microstructural abnormality of the temporal cortex in T2DM. Given that we did not find cortical thinning in this region on the FreeSurfer analyses, the parahippocampal abnormalities associated with T2DM are restricted to microstructural deficits. Our finding of microstructural abnormality in the left temporal stem, known to be involved in memory processing (Kier, Staib, Davis, & Bronen, 2004) replicates those reported previously (Yau, et al., 2009; Yau, et al., 2010), suggesting that this dense fiber bundle, like the hippocampus, may also be particularly vulnerable to damage in T2DM.
In contrast to our extensive temporal lobe findings, we found non-specific frontal lobe microstructural abnormalities among participants with T2DM in the absence of obvious tissue loss. Our evidence of subtle frontal GM and WM damage among participants with T2DM was primarily in the prefrontal region, which is implicated in memory encoding (Golby et al., 2001). The limited presence of frontal lobe involvement in the current study is somewhat unexpected, considering that disproportionately more participants with T2DM also had hypertension, which is often linked to specific frontal lobe abnormalities, such as reduced frontal lobe volume and increased occurrences of WML (Raz, Rodrigue, & Acker, 2003). It is possible that our participants with diabetes, despite being of a similar age to those studied previously, have considerably shorter disease durations (Last et al., 2007).
The current study has significant strengths. Our operator-derived ICV and hippocampal segmentation method has excellent inter-rater reliability (Convit, et al., 1997) and has been validated against post-mortem histological volume evaluations (Bobinski et al., 2000). Our cortical thickness and DTI analysis methods provide automated and unbiased brain assessments. With that said, future work should incorporate other imaging techniques such as functional MRI, MR spectroscopy, and DTI tractography to clarify hippocampal and frontal lobe involvement or possible interactions of fronto-temporal microstructural abnormalities. Additionally, impaired vascular reactivity reported in T2DM (Last, et al., 2007; Novak et al., 2011) is another possible mechanism underlying the observed memory decline.
The current study has a few limitations. The overall sample size was reasonably large, but for analyses of participants with T2DM alone, the sample size was more limited, perhaps resulting in some negative findings due to insufficient power. Regrettably, we do not have records of our participants’ prior glucose control. For this study we excluded individuals with a history of insulin treatment, as severe hypoglycemic episodes could confound our results. Although it is possible that individuals on oral agents could also have episodes of hypoglycemia, this is much less likely. The relatively broad range of age (early 40’s to mid 70’s) and of diabetes duration (0.07 years up to 29.88 years) add further variability to the data. In spite of these concerns, the solid findings obtained in these study participants, who were relatively younger and better educated than those previously studied, allowed us to show that brain and cognitive complications also apply to younger patients with T2DM. Although our use of six gradient orientations for DTI based evaluations is a limitation for more targeted analyses utilizing tractography, our acquisition is sufficient for robust tensor estimation (Basser & Jones, 2002; Lebel, Benner, & Beaulieu, 2012). Future studies should employ 30 diffusion orientations with improved signal-to-noise ratio to perform tract-based analysis so as to better delineate the neural mechanisms underlying the memory impairments frequently reported in T2DM.
Future studies should also employ longitudinal designs to track pathological changes from the pre-clinical stages of insulin resistance into T2DM. In particular, studying children and adolescents would give us the advantage of characterizing brain structural and functional changes from the pre-diabetes stages to manifest T2DM without the confounding effects of clinically significant vascular complications, which in contrast to older subjects, are less likely to develop at such a young age.
Acknowledgments
This study was supported by grants from the National Institutes of Health DK064087 and supported in part by grant UL1 TR000038 from the National Center for the Advancement of Translational Science (NCATS), National Institutes of Health.
Footnotes
CONFLICT OF INTERESTS
The authors declare no conflict of interests.
References
- Ajilore O, Haroon E, Kumaran S, Darwin C, Binesh N, Mintz J, Kumar A. Measurement of brain metabolites in patients with type 2 diabetes and major depression using proton magnetic resonance spectroscopy. Neuropsychopharmacology. 2006;32(6):1224–1231. doi: 10.1038/sj.npp.1301248. [DOI] [PubMed] [Google Scholar]
- Allen KV, Frier BM, Strachan MWJ. The relationship between type 2 diabetes and cognitive dysfunction: longitudinal studies and their methodological limitations. European Journal of Pharmacology. 2004;490(1–3):169–175. doi: 10.1016/j.ejphar.2004.02.054. [DOI] [PubMed] [Google Scholar]
- Ardekani BA, Guckemus S, Bachman A, Hoptman MJ, Wojtaszek M, Nierenberg J. Quantitative comparison of algorithms for inter-subject registration of 3D volumetric brain MRI scans. Journal of Neuroscience Methods. 2005;142(1):67–76. doi: 10.1016/j.jneumeth.2004.07.014. S0165-0270(04)00271-7 [pii] [DOI] [PubMed] [Google Scholar]
- Basser PJ, Jones DK. Diffusion-tensor MRI: theory, experimental design and data analysis - a technical review. NMR in Biomedicine. 2002;15(7–8):456–467. doi: 10.1002/nbm.783. [DOI] [PubMed] [Google Scholar]
- Basser PJ, Pierpaoli C. Microstructural and physiological features of tissues elucidated by quantitative-diffusion-tensor MRI. Journal of Magnetic Resonance, Series B. 1996;111(3):209–219. doi: 10.1006/jmrb.1996.0086. [DOI] [PubMed] [Google Scholar]
- Benjamini Y, Hochberg Y. Controlling the false discovery rate: a practical and powerful approach to multiple testing. Journal of the Royal Statistical Society Series B (Methodological) 1995;57(1):289–300. [Google Scholar]
- Bobinski M, de Leon MJ, Wegiel J, De Santi S, Convit A, Saint Louis LA, Wisniewski HM. The histological validation of post mortem magnetic resonance imaging-determined hippocampal volume in Alzheimer’s disease. Neuroscience. 2000;95:721–725. doi: 10.1016/s0306-4522(99)00476-5. [DOI] [PubMed] [Google Scholar]
- Brickman AM, Stern Y, Small SA. Hippocampal subregions differentially associate with standardized memory tests. Hippocampus. 2011;21(9):923–928. doi: 10.1002/hipo.20840. [DOI] [PMC free article] [PubMed] [Google Scholar]
- Bruce DG, Casey GP, Grange V, Clarnette RC, Almeida OP, Foster JK, Davis TM. Cognitive impairment, physical disability and depressive symptoms in older diabetic patients: the Fremantle Cognition in Diabetes Study. Diabetes Research and Clinical Practice. 2003;61(1):59–67. doi: 10.1016/s0168-8227(03)00084-6. [DOI] [PubMed] [Google Scholar]
- Bruehl H, Sweat V, Tirsi A, Shah B, Convit A. Obese adolescents with type 2 diabetes mellitus have hippocampal and frontal lobe volume reductions. Neuroscience and Medicine. 2011;2(1):34–42. doi: 10.4236/nm.2011.21005. [DOI] [PMC free article] [PubMed] [Google Scholar]
- Bruehl H, Wolf OT, Sweat V, Tirsi A, Richardson S, Convit A. Modifiers of cognitive function and brain structure in middle-aged and elderly individuals with type 2 diabetes mellitus. Brain Research. 2009;1280:186–194. doi: 10.1016/j.brainres.2009.05.032. S0006-8993(09)01000-2 [pii] [DOI] [PMC free article] [PubMed] [Google Scholar]
- Brundel M, van den Heuvel M, de Bresser J, Kappelle LJ, Biessels GJ. Cerebral cortical thickness in patients with type 2 diabetes. Journal of the Neurological Sciences. 2010;299(1–2):126–130. doi: 10.1016/j.jns.2010.08.048. [DOI] [PubMed] [Google Scholar]
- Convit A, de Leon MJ, Golomb J, George AE, Tarshish CY, Bobinski M, Wisniewski H. Hippocampal atrophy in early Alzheimer’s disease: anatomic specificity and validation. The Psychiatric Quarterly. 1993;64(4):371–387. doi: 10.1007/BF01064929. [DOI] [PubMed] [Google Scholar]
- Convit A, De Leon MJ, Tarshish C, De Santi S, Tsui W, Rusinek H, George A. Specific hippocampal volume reductions in individuals at risk for Alzheimer’s disease. Neurobiology of Aging. 1997;18(2):131–138. doi: 10.1016/s0197-4580(97)00001-8. [DOI] [PubMed] [Google Scholar]
- Convit A, Wolf OT, de Leon MJ, Patalinjug M, Kandil E, Cardebat D, Cancro R. Volumetric analysis of the pre-frontal regions: findings in aging and schizophrenia. Psychiatry Research: Neuroimaging. 2001;107:61–73. doi: 10.1016/s0925-4927(01)00097-x. [DOI] [PubMed] [Google Scholar]
- Delis DC, Kramer JH, Kaplan E, Ober BA. California Verbal Learning Test - Research Edition. New York: The Psychological Corporation; 1987. [Google Scholar]
- den Heijer T, Vermeer SE, van Dijk EJ, Prins ND, Koudstaal PJ, Hofman A, Breteler MM. Type 2 diabetes and atrophy of medial temporal lobe structures on brain MRI. Diabetologia. 2003;46(12):1604–1610. doi: 10.1007/s00125-003-1235-0. [DOI] [PubMed] [Google Scholar]
- Desikan RS, Segonne F, Fischl B, Quinn BT, Dickerson BC, Blacker D, Killiany RJ. An automated labeling system for subdividing the human cerebral cortex on MRI scans into gyral based regions of interest. Neuroimage. 2006;31(3):968–980. doi: 10.1016/j.neuroimage.2006.01.021. [DOI] [PubMed] [Google Scholar]
- Expert Panel on Detection E and Treatment of High Blood Cholesterol in Adults. Executive summary of the third report of The National Cholesterol Education Program (NCEP) Expert Panel on Detection, Evaluation, And Treatment of High Blood Cholesterol In Adults (Adult Treatment Panel III) Journal of the American Medical Association. 2001;285(19):2486–2497. doi: 10.1001/jama.285.19.2486. [DOI] [PubMed] [Google Scholar]
- Fischl B, Dale AM. Measuring the thickness of the human cerebral cortex from magnetic resonance images. Proceedings of the National Academy of Sciences of the United States of America. 2000;97(20):11050–11055. doi: 10.1073/pnas.200033797200033797. [pii] [DOI] [PMC free article] [PubMed] [Google Scholar]
- Fischl B, Liu A, Dale AM. Automated manifold surgery: constructing geometrically accurate and topologically correct models of the human cerebral cortex. IEEE Transactions and Medical Imaging. 2001;20(1):70–80. doi: 10.1109/42.906426. [DOI] [PubMed] [Google Scholar]
- Fischl B, Salat DH, van der Kouwe AJ, Makris N, Segonne F, Quinn BT, Dale AM. Sequence-independent segmentation of magnetic resonance images. Neuroimage. 2004;23(Suppl 1):S69–S84. doi: 10.1016/j.neuroimage.2004.07.016. [DOI] [PubMed] [Google Scholar]
- Fischl B, Sereno MI, Dale AM. Cortical surface-based analysis. II: Inflation, flattening, and a surface-based coordinate system. Neuroimage. 1999;9:195–207. doi: 10.1006/nimg.1998.0396. [DOI] [PubMed] [Google Scholar]
- Fischl B, Van der KA, Destrieux C, Halgren E, Segonne F, Salat DH, Dale AM. Automatically parcellating the human cerebral cortex. Cerebral Cortex. 2004;14(1):11–22. doi: 10.1093/cercor/bhg087. [DOI] [PubMed] [Google Scholar]
- Gilbert JG, Levee RF, Catalano FL. A preliminary report on a new memory scale. Perceptual and Motor Skills. 1968;27:277–278. doi: 10.2466/pms.1968.27.1.277. [DOI] [PubMed] [Google Scholar]
- Golby AJ, Poldrack RA, Brewer JB, Spencer D, Desmond JE, Aron AP, Gabrieli JD. Material-specific lateralization in the medial temporal lobe and prefrontal cortex during memory encoding. Brain: a journal of neurology. 2001;124(Pt 9):1841–1854. doi: 10.1093/brain/124.9.1841. [DOI] [PubMed] [Google Scholar]
- Gold S, Dziobek I, Sweat V, Tirsi A, Rogers K, Bruehl H, Convit A. Hippocampal damage and memory impairments as possible early brain complications of type 2 diabetes. Diabetologia. 2007;50(4):711–719. doi: 10.1007/s00125-007-0602-7. [DOI] [PubMed] [Google Scholar]
- Hachinski VC. Differential diagnosis of Alzheimer’s dementia: Multi-infarct dementia. In: Reisberg B, editor. Alzheimer’s Disease. New York: Free Press; 1983. pp. 188–192. [Google Scholar]
- Holm S. A simple sequentially rejective Bonferroni test procedure. Scandinavian Journal of Statistics. 1979;6:65–70. [Google Scholar]
- Jongen C, van der Grond J, Kappelle LJ, Biessels GJ, Viergever MA, Pluim JP. Automated measurement of brain and white matter lesion volume in type 2 diabetes mellitus. Diabetologia. 2007;50(7):1509–1516. doi: 10.1007/s00125-007-0688-y. [DOI] [PMC free article] [PubMed] [Google Scholar]
- Kantarci K, Smith GE, Ivnik RJ, Petersen RC, Boeve BF, Knopman DS, Jack CR., Jr 1H magnetic resonance spectroscopy, cognitive function, and apolipoprotein E genotype in normal aging, mild cognitive impairment and Alzheimer’s disease. Journal of the International Neuropsychological Society: JINS. 2002;8(7):934–942. doi: 10.1017/s1355617702870084. [DOI] [PMC free article] [PubMed] [Google Scholar]
- Katz A, Nambi SS, Mather K, Baron AD, Follmann DA, Sullivan G, Quon MJ. Quantitative insulin sensitivity check index: a simple, accurate method for assessing insulin sensitivity in humans. The Journal of Clinical Endocrinology and Metabolism. 2000;85(7):2402–2410. doi: 10.1210/jcem.85.7.6661. [DOI] [PubMed] [Google Scholar]
- Kier EL, Staib LH, Davis LM, Bronen RA. MR Imaging of the Temporal Stem: Anatomic Dissection Tractography of the Uncinate Fasciculus, Inferior Occipitofrontal Fasciculus, and Meyer’s Loop of the Optic Radiation. American Journal of Neuroradiology. 2004;25(5):677–691. [PMC free article] [PubMed] [Google Scholar]
- Koay CG, Chang LC, Carew JD, Pierpaoli C, Basser PJ. A unifying theoretical and algorithmic framework for least squares methods of estimation in diffusion tensor imaging. [Research Support, N.I.H., Intramural] Journal of Magnetic Resonance. 2006;182(1):115–125. doi: 10.1016/j.jmr.2006.06.020. [DOI] [PubMed] [Google Scholar]
- Kumar R, Anstey KJ, Cherbuin N, Wen W, Sachdev PS. Association of type 2 diabetes with depression, brain atrophy, and reduced fine motor speed in a 60- to 64-year-old community sample. American Journal of Geriatric Psychiatry. 2008;16(12):989–998. doi: 10.1097/JGP.0b013e31818b40fc. 16/12/989 [pii] [DOI] [PubMed] [Google Scholar]
- Last D, Alsop DC, Abduljalil AM, Marquis RP, de Bazelaire C, Hu K, Novak V. Global and regional effects of type 2 diabetes on brain tissue volumes and cerebral vasoreactivity. Diabetes Care. 2007;30(5):1193–1199. doi: 10.2337/dc06-2052. dc06-2052 [pii] [DOI] [PMC free article] [PubMed] [Google Scholar]
- Lebel C, Benner T, Beaulieu C. Six is enough? Comparison of diffusion parameters measured using six or more diffusion-encoding gradient directions with deterministic tractography. Magnetic Resonance in Medicine. 2012;68(2):474–483. doi: 10.1002/mrm.23254. [DOI] [PubMed] [Google Scholar]
- Li YD, He HJ, Dong HB, Feng XY, Xie GM, Zhang LJ. Discriminative analysis of early-stage Alzheimer’s disease and normal aging with automatic segmentation technique in subcortical gray matter structures: a multicenter in vivo MRI volumetric and DTI study. Acta Radiologica. 2013 doi: 10.1177/0284185113492971. [DOI] [PubMed] [Google Scholar]
- Manschot SM, Biessels GJ, de Valk H, Algra A, Rutten GE, van der Grond J, Kappelle LJ. Metabolic and vascular determinants of impaired cognitive performance and abnormalities on brain magnetic resonance imaging in patients with type 2 diabetes. Diabetologia. 2007;50(11):2388–2397. doi: 10.1007/s00125-007-0792-z. [DOI] [PMC free article] [PubMed] [Google Scholar]
- Manschot SM, Brands AMA, van der Grond J, Kessels RPC, Algra A, Kappelle LJ Utrecht Diabetic Encephalopathy Study G. Brain magnetic resonance imaging correlates of impaired cognition in patients with type 2 diabetes. Diabetes. 2006;55(4):1106–1113. doi: 10.2337/diabetes.55.04.06.db05-1323. [DOI] [PubMed] [Google Scholar]
- Modi S, Bhattacharya M, Sekhri T, Rana P, Tripathi RP, Khushu S. Assessment of the metabolic profile in Type 2 diabetes mellitus and hypothyroidism through proton MR spectroscopy. Magnetic Resonance Imaging. 2008;26(3):420–425. doi: 10.1016/j.mri.2007.08.011. [DOI] [PubMed] [Google Scholar]
- Novak V, Last D, Alsop DC, Abduljalil AM, Hu K, Lepicovsky L, Lipsitz LA. Cerebral blood flow velocity and periventricular white matter hyperintensities in type 2 diabetes. Diabetes Care. 2006;29(7):1529–1534. doi: 10.2337/dc06-0261. [DOI] [PMC free article] [PubMed] [Google Scholar]
- Novak V, Zhao P, Manor B, Sejdic E, Alsop D, Abduljalil A, Novak P. Adhesion molecules, altered vasoreactivity, and brain atrophy in type 2 diabetes. Diabetes Care. 2011;34(11):2438–2441. doi: 10.2337/dc11-0969. dc11-0969 [pii] [DOI] [PMC free article] [PubMed] [Google Scholar]
- Raz N, Rodrigue KM, Acker JD. Hypertension and the brain: vulnerability of the prefrontal regions and executive functions. Behavioral Neuroscience. 2003;117(6):1169–1180. doi: 10.1037/0735-7044.117.6.1169. [DOI] [PubMed] [Google Scholar]
- Sahin I, Alkan A, Keskin L, Cikim A, Karakas HM, Firat AK, Sigirci A. Evaluation of in vivo cerebral metabolism on proton magnetic resonance spectroscopy in patients with impaired glucose tolerance and type 2 diabetes mellitus. Journal Of Diabetes And Its Complications. 2007;22(4):254–260. doi: 10.1016/j.jdiacomp.2007.03.007. [DOI] [PubMed] [Google Scholar]
- Shipley WC. A self-administering scale for measuring intellectual impairment and deterioration. Journal of Psychology. 1940;9:371–377. [Google Scholar]
- Strachan MW, Deary IJ, Ewing FM, Frier BM. Is type II diabetes associated with an increased risk of cognitive dysfunction? A critical review of published studies. Diabetes Care. 1997;20(3):438–445. doi: 10.2337/diacare.20.3.438. [DOI] [PubMed] [Google Scholar]
- Tsui WH. Multimodal Image Data Analysis System (MIDAS), Version 1.0. 1995 unpublished manual. [Google Scholar]
- Van Petten C. Relationship between hippocampal volume and memory ability in healthy individuals across the lifespan: review and meta-analysis. Neuropsychologia. 2004;42(10):1394–1413. doi: 10.1016/j.neuropsychologia.2004.04.006. [DOI] [PubMed] [Google Scholar]
- Wechsler D. Wechsler Adult Intelligence Scale--Revised. New York: Harcourt Brace Jovanovich; 1981. [Google Scholar]
- Yau PL, Javier D, Tsui W, Sweat V, Bruehl H, Borod JC, Convit A. Emotional and neutral declarative memory impairments and associated white matter microstructural abnormalities in adults with type 2 diabetes. Psychiatry Research. 2009;174(3):223–230. doi: 10.1016/j.pscychresns.2009.04.016. [DOI] [PMC free article] [PubMed] [Google Scholar]
- Yau PL, Javier DC, Ryan CM, Tsui WH, Ardekani BA, Ten S, Convit A. Preliminary evidence for brain complications in obese adolescents with type 2 diabetes mellitus. Diabetologia. 2010;53(11):2298–2306. doi: 10.1007/s00125-010-1857-y. [DOI] [PMC free article] [PubMed] [Google Scholar]
- Zhou H, Lu W, Shi Y, Bai F, Chang J, Yuan Y, Zhang Z. Impairments in cognition and resting-state connectivity of the hippocampus in elderly subjects with type 2 diabetes. Neuroscience Letter. 2010;473(1):5–10. doi: 10.1016/j.neulet.2009.12.057. [DOI] [PubMed] [Google Scholar]