

SUMMARY
Multiple Sclerosis (MS) is a presumed autoimmune disease directed against central nervous system (CNS) myelin, in which diet and obesity are implicated as risk factors. Immune responses can be influenced by molecules produced by fat cells, called adipokines. Adiponectin is an adipokine with anti-inflammatory effects. We tested the hypothesis that adiponectin has a protective role in the experimental autoimmune encephalomyelitis (EAE) model for MS, that can be induced by immunization with myelin antigens or transfer of myelin-specific T lymphocytes. Adiponectin deficient (ADPKO) mice developed worse EAE with greater CNS inflammation, demyelination and axon injury. Lymphocytes from myelin-immunized ADP KO mice proliferated more, produced higher amounts of IFNγ, IL-17, TNFα, IL-6 and transferred more severe EAE than wild type (WT) lymphocytes. At EAE peak, the spleen and CNS of ADPKO had fewer Tregulatory cells (Tregs) than WT mice and during EAE recovery, Foxp3, IL-10 and TGFβ CNS expression levels were reduced in ADPKO compared to WT mice. Treatment with globular adiponectin (gADP) in vivo ameliorated EAE, and was associated with an increase in Tregs. These data indicate that adiponectin is an important regulator of T cell functions during EAE, suggesting a new avenue of investigation for MS treatment.
Keywords: multiple sclerosis, EAE, adiponectin, immunomodulation
INTRODUCTION
Multiple sclerosis (MS) is a presumed autoimmune CNS disorder directed against components of CNS myelin affecting about 0.1% of the U.S. population. Risk of MS has been associated with several environmental factors, including obesity and diet [1, 2]. Experimental autoimmune encephalomyelitis (EAE), the most commonly used animal model for MS, can be induced in susceptible species by immunization with myelin antigens. Like MS, EAE is characterized by CNS inflammation, demyelination, and axonal damage. EAE was instrumental in the development of several therapies for MS. EAE pathogenesis consists of an initial T cell priming against myelin antigens in secondary lymphoid organs (induction phase) followed by migration of auto-reactive T cells and other immune system cells into the CNS (effector phase). The effector phase remits to varying degrees, dependent upon mouse strain and CNS antigen used for induction [3].
Obesity during young adulthood has been associated with increased risk of developing MS in two recent studies [4, 5]. Obesity is characterized by a low-grade inflammatory state that can affect immune responses [6]. Indeed, white adipose tissue not only stores fat, but produces cytokines that are collectively known as adipokines [6, 7]. Adipokines regulate metabolic pathways, and can regulate immune and inflammatory responses. One adipokine is adiponectin, which structurally belongs to the complement 1q protein family and is composed of an aminoterminal signal peptide, a collagenous domain and a carboxyl-terminal globular domain. Despite being secreted mainly by adipose tissue, adiponectin levels are reduced in serum of overweight subjects and increased with calorie restriction [7, 8]. Adiponectin exists in the circulation in full- length version and as its functional globular domain [9]. Adiponectin is an insulin-sensitizing molecule, but has multiple other anti-inflammatory effects [10, 11]. Altered adiponectin levels in MS have been reported in three studies, with two showing decreased adiponectin serum levels [12] and the other showing elevated CSF levels [13].
We used adiponectin deficient mice (ADPKO) to investigate the previously unknown role of adiponectin in EAE development. EAE induced with myelin oligodendrocyte glycoprotein peptide 35-55 (MOG35-55) was more severe clinically and histologically in ADPKO than in wild-type (WT) mice. ADPKO mice had more activated MOG35-55 specific T cells and fewer Tregulatory cells (Tregs), that are known to modulate effector T cell responses [14]. Furthermore, in WT mice treatment with adiponectin increased the Foxp3+ Treg numbers and lessened EAE. Our results show that adiponectin plays an important role in regulating EAE by modulating T cell functions and suggest potential new avenues for MS therapy developments.
RESULTS
ADPKO mice develop more severe EAE than WT mice after MOG35-55 immunization
Naïve age-and gender-matched WT and ADPKO mice (five of each gender and genotype) were compared for weight and body composition by EchoMRI with no significant differences found, consistent with a published report [15]. EAE was induced by immunization with MOG35-55 in matched WT and ADPKO mice. ADPKO mice displayed significantly worse clinical EAE than WT control mice. Fig. 1A shows a representative experiment out of seven experiments with similar results. Compiling data from all mice followed for 14 or more days post-immunization, clinical EAE occurred at a slightly higher rate in ADPKO mice than WT mice (65/65 vs. 54/58, respectively; P<0.05, Fisher’s exact test). Maximum clinical scores compiled for all experiments were significantly higher in ADPKO compared to WT mice [mean ± SD was 2.8 ± 1.1 for WT mice and 3.8 ± 0.8 for ADPKO mice; median score was 2.5 (range 0-5) for WT and 4 (range 2.5-5) for ADPKO mice; P<0.001, Mann Whitney test]. Death was more frequent in ADPKO than WT mice (9/65 ADPKO vs. 1/58 WT; P<0.05). Histological analyses revealed that CNS inflammation and demyelination in the spinal cords (main region affected in this model) at time of initial EAE attack [days 17-20 post immunization (pi)] were significantly worse in ADPKO compared to WT mice (P<0.05 for inflammation and demyelination, Mann Whitney test) (Fig. 1B-E, 1H). ADPKO spinal cords had significantly higher numbers of SMI-32-positive (damaged) axons compared to WT (Fig. 1 F-H; P<0.01, t-test). Thus, the systemic absence of ADP resulted in worse EAE.
Figure 1. Exacerbation of EAE in ADPKO mice.

(A) Clinical course of EAE induced in ADPKO (n=6) and WT mice (n=7) with MOG35-55. ADPKO mice displayed significantly worse clinical EAE than WT control mice (P<0.0001 by two-way ANOVA). This is one representative experiment out of seven performed. Data are mean clinical score ± SEM. (B-E) Inflammation and demyelination were assessed using H&E and Luxol fast blue staining of spinal cord sections from immunized WT (B,D) (n=5) and ADPKO mice (C,E) (n=7) at disease peak. Inflammatory cells (black arrows) were mainly localized in the meninges and less so in the white matter in WT mice, while they extensively infiltrated the parenchyma in the ADPKO mice. (F,G) Spinal cord sections from EAE affected WT and ADPKO mice were stained for myelin basic protein (in red) and SMI-32 (in green), to detect myelin and damaged axons, respectively. White arrows show damaged axons. Original magnification, 4X (B-E); 63X (F,G). Scale bars, 100 μm (B-E); 10 μm (F,G). (H) Quantification of inflammation, demyelination and axonal damage. Horizontal lines are median values. (I) Quantitative real-time PCR studies of spinal cord mRNA at EAE peak (n=5/group) for the expression of the T cell marker CD3, adhesion molecules VCAM-1, ICAM-1 and pro-inflammatory cytokines IL-17A, IFNγ, TNFα, and IL-6. Quantification is relative to expression levels in spinal cords from naïve mice. Data are representative of two experiments performed. (J) MOG35-55 specific IFNγ (Th1) and IL-2 producing cells in the CNS of immunized ADPKO and WT mice determined at disease peak by ELISPOT (n=10/group). Data are presented as absolute number of cytokine producing cells per CNS and they are representative of two experiments performed. NS: not significant.
Proinflammatory cytokine expression is enhanced in the spinal cords of EAE-affected ADPKO mice
Messenger RNA expression of T cell markers, cytokines and adhesion molecules relevant to EAE pathogenesis were analyzed and compared in spinal cords of MOG35-55 immunized WT and ADPKO mice by quantitative real time PCR (RT-PCR). At clinical peak (day 16-18 pi), increased mRNA expression of the T cell marker CD3 (P<0.05, Mann Whitney test), the adhesion molecule VCAM-1 (P<0.05, t-test), and the pro-inflammatory cytokine TNFα (P<0.01, Mann Whitney test) was observed in ADPKO compared with WT spinal cord tissues. IL-17A, IFNγ and IL-6 mRNAs were higher in ADPKO tissues, but differences were not statistically significant (Fig. 1I). ELISPOT was used to quantify MOG35-55 specific Th1 cells producing IFNγ in the CNS at disease peak, and showed significantly more IFNγ and IL-2 producing cells in the ADPKO compared to WT mice (P<0.01 and P=0.01, respectively, Mann Whitney test) (Fig. 1J). Thus, immunological factors that contribute to EAE pathogenesis were enhanced in ADPKO CNS compared to WT.
Effector T cell responses are increased in ADPKO mice after challenge in vitro with MOG35-55 and in vivo
To examine why mice lacking ADP developed more severe EAE, we measured proliferation and cytokine production by lymphoid cells from immunized ADPKO vs. WT mice in response to MOG35-55 re-challenge in vitro. Because ADP is abundant in the serum and its structure is conserved among species, ADP deficient serum (obtained from naïve ADPKO mice) was used in most in vitro assays to prevent potential effects due to ADP in the serum. Lymph node cells from ADPKO mice at day 12 pi proliferated significantly more in response to MOG35-55 peptide (P<0.01, Mann Whitney test)(Fig. 2A). Likewise, proinflammatory cytokines were higher in the culture supernatants of cells from ADPKO compared to WT mice, with significant differences for IFNγ TNFα and IL-6 (P<0.01, Mann Whitney test). IFNγ was barely detectable in supernatants from WT cells, whereas it averaged over 200 pg/ml for ADPKO cells. In contrast, levels of leptin, a pro-inflammatory adipokine, were higher in WT compared to ADPKO mice (P<0.05, Mann Whitney test) (Fig. 2B). We examined expression of adiponectin receptors 1 and 2 (AdipoR1 and R2) by immune cells, finding them to be widely expressed by murine immune cells (Supporting Information Fig. 1), suggesting that adiponectin might directly affect immune responses. Thus, in the systemic absence of ADP, T cell responses to antigen were increased, with a more pronounced Th1 profile.
Figure 2. Enhanced T cell proliferation and cytokine production in response to MOG35-55 in ADPKO compared to WT mice.
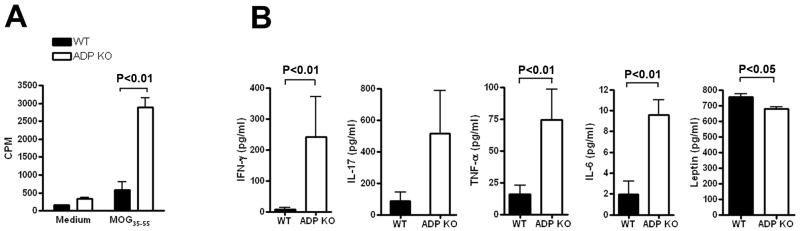
(A-B) Lymph node cells were isolated from immunized ADPKO and WT mice on day 12 pi and then restimulated in vitro with MOG35-55 or medium alone. (A) Lymph node cell proliferative response to MOG35-55 in ADPKO and WT mice (n=5/group). Data are mean CPM ± SD, and they are representative of four experiments performed. (B) IFNγ, IL-17, TNFα, and IL-6 concentrations were measured by cytometric bead array (CBA), and leptin was measured by ELISA in supernatants of cultured lymph node cells from MOG35-55 immunized ADPKO and WT mice from day 12 pi (n=5 per group). Results shown as means ± SD. Data are representative of three different experiments. CPM=counts per minute.
Next, we compared in vivo encephalitogenicity of ADPKO and WT Th1 cells. MOG35-55 reactive ADPKO and WT Th1 cells were generated and injected into naïve C57BL/6 WT recipients. Higher numbers of ADPKO vs. WT T cells that expressed intracellular INFγ and TNFα under Th1 polarizing conditions were observed, while IL17 was not produced by either T cell type (Fig. 3A). A more severe clinical course in recipients of ADPKO Th1 cells compared with WT Th1 cells was seen (Fig. 3B; P<0.001, two-way ANOVA). Conversely, in two separate experiments, ADPKO versus WT recipients of equal numbers of MOG35-55 specific encephalitogenic WT Th1 cells displayed almost identical clinical courses (Fig. 3C). These results suggest that adiponectin influences mainly T cell activation in the EAE induction phase, and that endogenous adiponectin is unlikely to exert a strong protective effect on the blood brain barrier or in the CNS during EAE.
Figure 3. MOG35-55 specific Th1 cells from ADPKO mice induce more severe EAE than WT Th1 cells.

(A) Cytokine production analyzed by intracellular staining by flow cytometry for INFγ TNFα and IL-17 of Th1 cells obtained from ADPKO and WT mice. The numbers in the quadrants represent the percentages of cytokine-producing cells. Two separate experiments were performed with similar results. (B) Clinical course of adoptively transferred EAE induced by injection of activated MOG35-55 -specific Th1 cells from ADPKO or WT donors. Nine naïve C57BL/6 WT recipient mice received ADPKO Th1 cells, and 8 WT recipient mice received WT Th1 cells. MOG35-55 -specific Th1 cells from ADPKO donor mice induced a significantly more severe disease compared to Th1 cells from WT mice (P<0.001 by two-way ANOVA). This experiment is representative of two performed with similar results. (C) Clinical course of adoptively transferred EAE into ADPKO (n=8) versus WT (n=9) recipient mice, induced by injection of activated MOG35-55 -specific CD4+ T cells obtained from C57BL/6 WT mice. The shown experiment is representative of two performed with similar results. In B and C, graphs represent mean clinical score ± SEM of all animals in each group.
ADPKO antigen presenting cells (APCs) do not differ from WT APCs in supporting proliferation of CD4+ T cells
Next, we asked whether the observed increased activation status of T cells and the enhanced proliferation and cytokine production in primed T cells from immunized ADPKO mice was due to altered function of the APCs. We isolated CD4+ T cells from WT and ADPKO mice from draining lymph nodes on day 11 pi and separately co-cultured with either ADPKO or WT APCs (irradiated CD4- cells served as APCs). Proliferation and cytokine production in response to MOG35-55 was measured for each permutation. The source of APC did not alter proliferation by CD4+T cells from either WT or ADPKO mice. In contrast, proliferation by ADPKO CD4+ T cells was consistently and significantly higher than proliferation by WT CD4+ T cells, regardless of whether the APCs were WT or ADPKO (Fig. 4A). Higher IL-17, IFNγ and TNFα concentrations in the supernatants of the ADPKO CD4+ T cell cultures were observed, which was independent of APC source (P <0.05 for IL-17 and P<0.005 for IFNγ and TNFα, each, Mann Whitney test) (Fig. 4B). Purified ADPKO CD4+ T cells from immunized mice also proliferated more than WT cells in response to anti-CD3 stimulation in absence of any APC (P<0.05 by t-test; Supporting Information Fig. 2).
Figure 4. ADPKO APCs do not differ from WT APCs in supporting proliferation of CD4+ T cells.
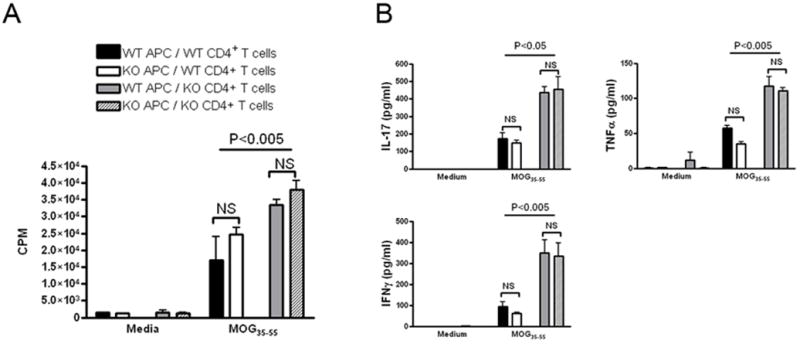
ADPKO or WT CD4+ T cells purified from draining lymph nodes from immunized ADPKO and WT mice on day 11 pi were cultured, with or without MOG35-55, in presence of irradiated CD4- cells from either ADPKO or WT mice as APC. No significant differences were noted in CD4+ T cell proliferation (A) or cytokine production (B) in the presence of ADPKO APCs compared to WT APCs. Significant differences were present when comparing proliferation and IL-17, IFNγ and TNFα production by ADPKO CD4+ T cells versus WT CD4+ T cells regardless of APC type. Results are means ± SD. Data are representative of two different experiments performed.
To further address whether the observed enhanced proliferation and cytokine production by T cells from ADPKO mice was due to alterations of the CD4+ T cells or APCs, we compared responses by CD4+CD62LhighCD44low naïve T cells sorted from lymphoid organs of un-immunized ADPKO and WT mice. Sorted naïve T cells were plated alone or stimulated in vitro with anti-CD3 coated on plates plus soluble anti-CD28 for co-stimulation. Unstimulated naïve CD4+ T cells from KO versus WT mice proliferated little in either case, but no differently. However, in presence of antiCD3/antiCD28, ADPKO cells proliferated significantly more than WT (Supporting Information Fig. 3). Thus, the dysregulation of ADPKO CD4+ T cells compared to WT CD4+ T cells upon immunization was largely independent of APCs and required activating signals.
ADPKO mice exhibit a defect in regulatory T cell numbers during EAE
One mechanism of immune regulation involves Tregs, identified by co-expression of CD4, CD25 and the forkhead family transcription factor Foxp3. Tregs define the threshold for EAE initiation, and are implicated in EAE recovery [14]. Thus, spleen cells were isolated from immunized WT and ADPKO mice at disease peak, and percentages and absolute numbers of CD4+CD25+Foxp3+ cells were compared by flow cytometry (Fig. 5A). Treg were significantly lower in spleens of ADPKO compared to WT mice, by both percentages (mean±SD was 11±1.4% Treg in WT vs. 9.5±1.5% in ADPKO mice, P<0.05 by t-test) and absolute numbers (92.1±39.5× 10⁵ cells/spleen in WT vs. 48.8±18.5 ×10⁵ cells/spleen in ADPKO mice, P<0.01 by t-test). Interestingly, the number of CD25+Foxp3+ Tregs in lymph nodes, spleens and the thymus in nonimmunized ADPKO vs WT mice were not significantly different in three separate experiments, although a trend toward lower numbers was seen in lymph nodes and spleen of ADPKO mice (Supporting Information Fig. 4).
Figure 5. Defect in Treg cells in the spleens and CNS of ADPKO mice during EAE.

(A) Splenocytes and (B) CNS mononuclear cells from immunized WT and ADPKO mice at EAE peak (n=10/group). Tregs were evaluated by flow cytometry, representative plots are in the top panels. Lower panel bar graphs represent the mean values of all mice analyzed. Percentages of CD25+ Foxp3+ cells within the CD4+ cell population were calculated. Absolute numbers of CD4+CD25+Foxp3+ Treg cells were calculated based on the total number of splenocytes or CNS mononuclear cells isolated/mouse. Results are means ± SD. (C) mRNA was isolated from spinal cords isolated at EAE peak (day 16-18 pi) and (D) during the EAE recovery phase (day 30 pi) from ADPKO and WT mice (n=5/group). Expression of Treg marker Foxp3, and of anti-inflammatory cytokines IL-10 and TGF-β was studied by quantitative RT-PCR. Data are mean ± SD and representative of two experiments performed. Quantification is relative to expression levels in spinal cords from naïve mice. NS: not significant.
We also compared the number of Treg cells in the CNS at EAE peak in immunized ADPKO and WT mice by flow cytometry. Tregs were decreased in the CNS of ADPKO mice, as percentages of inflammatory cells (mean±SD were 52±15% of Treg cells in WT mice vs. 40±11% in ADPKO mice) and in absolute numbers (5.6±2.1 × 10⁵ Treg cells/CNS in WT mice vs. 4.1±0.9 × 10⁵ Tregs/CNS in ADPKO, P=0.05 by t-test) (Fig. 5B). Messenger RNA levels for IL-10 and TGF-β cytokines which are associated with Treg function, were measured in EAE-affected CNS. At disease peak (day 16-18 pi), IL-10 was lower in ADPKO compared to WT mice (P<0.05 by t-test), while TGF-β showed no significant difference (Fig. 5C). Prior studies indicated that the CNS Treg population expands during EAE recovery [14]. Thus, we measured mRNA levels of Foxp3, IL-10 and TGF-β in spinal cords from ADPKO and WT mice at day 30 pi during recovery, and found that all were significantly lower in ADPKO than WT spinal cords (P <0.05 for Foxp3 and TGF-β by t-test ; P<0.01 for IL-10 by t-test; Fig. 5D).
Defect of CD25+Foxp3+ Treg function in ADPKO mice
To further determine whether the decrease in Treg cell numbers in ADPKO mice was associated with defective Treg cell functions, we compared the capacity of purified CD4+CD25+ Treg cells from naïve WT and ADPKO mice to suppress CD4+CD25- effector T cell proliferation driven by anti-CD3. Co-culture of Tregs with T effector cells normally results in dose-dependent inhibition of T effector cell proliferation. With T effectors and Treg cells in culture at ratio of 2: 1, percentage inhibition of proliferation using Tregs from ADPKO mice was 21% compared to 40% for WT Tregs as an average of two experiments performed (Fig. 6A-B). Similar results showing significantly reduced function of ADPKO Tregs compared with WT Tregs were noted using thymidine incorporation to measure proliferation (data not shown). Using western blots, AdipoR2 was readily detected in Treg cells and T effector cells from naïve or immunized mice. AdipoR1 was not detected on naïve Tregs and expressed at lower levels than AdipoR2 on other T cells (Fig. 6B).
Figure 6. Defective suppressive function of ADPKO Tregs.

(A) CD4+CD25+ Treg cells and CD4 +CD25- effector T cell were isolated from spleen and peripheral lymph nodes of naïve WT and ADP KO mice. T effector cell proliferation was induced with an anti-CD3 antibody. CD4 +CD25- effector T cell from WT mice and WT or ADPKO CD4+CD25+ Treg cells were cocultured at different ratios as indicated (no Treg, 2:1 and 4:1) with CD4- irradiated APCs. T effector cell were labeled with CFSE and proliferation measured by CFSE dilution (numbers in the plots are percentages of proliferating cells). This experiment was performed twice with similar results. In (B) the results of both experiments are expressed as percentage of inhibition of T effector cell proliferation by either WT or ADPKO T reg cells, with proliferation in the absence of T regs being 100%. (C) AdipoR1 and R2 expression by Western blot of CD4+CD25+ Treg cells isolated from naïve and MOG 35-55 immunized mice (lanes 1 and 2 respectively), and of T effector cells isolated from naïve mice (lane 3) and naïve splenocytes (lane 4).
Treatment with recombinant globular adiponectin (gADP) ameliorates EAE and increases the number of Treg cells
Mice induced to develop EAE were treated with recombinant globular adiponectin (gADP) to determine its effects on clinical disease. The globular domain of adiponectin, produced endogenously by proteolysis [9], is the portion with the strongest pharmacological action, and had been successfully used for treatment in other mouse models [16, 17]. Thus, gADP was chosen for testing in C57BL/6J WT mice immunized to induce EAE. In two separate experiments, daily treatment with gADP or PBS control for a period of 7 days from day 5 pi until day 12 pi almost completely suppressed EAE during treatment (Fig. 7A shows one experiment, P<0.0001 by two-way ANOVA). gADP treated mice displayed lower spinal cord levels of mRNA encoding the T cell marker CD3, the cytokines IFNγ, IL-17, TNFα and IL-6, and the adhesion molecules ICAM-1 and VCAM-1 than PBS controls using quantitative RT-PCR (Fig. 7B). To obtain evidence of gADP activity in vivo we measured adenosine monophosphate (AMP)-activated protein kinase (AMPK) phosphorylation by western blot, since AMPK activation is a downstream readout for AdipoR activation [18]. We analyzed AMPK phosphorylation after treatment with gADP in the liver, fat, spleen and spinal cord. Higher phosphorylation was observed in all tissues from gADP treated mice compared to controls, and was statistically significant in all but spleen (Supporting Information Fig. 5).
Figure 7. Treatment with gADP is protective in EAE and increases the number of Treg cells.

EAE was induced in C57BL/6 WT mice with MOG35-55. Treatment with gADP (n=5) or PBS (n=10) was initiated on day 5 pi. Mice received either 25 μg gADP/mouse or same volume of PBS intraperitoneally twice daily until day 12 pi. (A) EAE clinical course in the gADP and PBS treated groups. Neurological signs were assessed on a scale from 0 to 5. Data are mean clinical score ± SEM. There was 80% incidence of EAE (8/10) in the PBS treated group vs. 20% (1/5) in the gADP treated group. The single EAE-affected mouse in the gADP group reached a score of 2. For the control mice, mean maximal clinical score for this experiment was 3 ± 0.5, including the two that didn’t develop EAE. The experiment was terminated on day 15 pi when four of PBS-treated control mice had reached clinical score of 4 and one had died. This experiment was performed twice with similar results. (B) mRNA expression levels of the T cell marker CD3, the cytokines IFNγ, IL-17, TNFα and IL-6, and the adhesion molecules ICAM-1 and VCAM-1 evaluated by RT-PCR in spinal cords obtained on day 15 pi (gADP, n=3 and PBS, n=5). Quantification is relative to expression levels in spinal cords from naïve mice. (C-D) Percentages and absolute numbers of Treg cells were studied by flow cytometry in draining lymph nodes and spleens of gADP and PBS treated mice (day 15 pi). CD25+ Foxp3+ cells percentages were calculated within the gated CD4+ cells. Absolute numbers were calculated based on the number of lymph node cells/mg of tissue or total splenocytes/mouse. The bar graphs represent the results compiled from gADP (n=5) and PBS (n=10) treated mice. Results are means ± SD.
We compared Treg cells in lymph nodes and spleens of PBS-treated and gADP-treated mice on day 15 pi by flow cytometry. Percentages of CD4+ CD25+ Foxp3+ cells in the lymph node cells and spleens from the gADP treated group were significantly higher compared to controls (mean±SD for lymph nodes were 16.4±1.5 vs. 11.5±2.2 % Tregs, respectively, P<0.01 by Mann Whitney test; for spleens they were 17.9±2.2 vs. 13.2± 3.9%; P<0.05 by Mann Whitney) (Fig. 7C-D). Absolute numbers of CD4+CD25+ Foxp3+ cells in the spleens were also increased in the gADP treated mice compared to PBS controls (269 ± 59 × 105 Tregs/spleen vs. 160±103 × 105 Tregs/spleen, respectively; P=0.05 by Mann Whitney). Though not statistically significant, Tregs were increased almost two-fold in the lymph nodes of treated mice (0.66 ± 0.12 × 10⁵ Tregs/mg of tissue vs. 0.34±0.39 × 10⁵ Tregs/mg of tissue). Phenotyping for CD4+, CD8+, CD19+, and CD11b+ revealed no other subset differences between the two treatment groups. These data suggest that the beneficial effect of gADP-treatment in EAE could be mediated, at least in part, by increased numbers of Treg cells.
To investigate a potential direct role of adiponectin on Treg generation, CD25negFoxp3 (RFP) negCD4+ CD62highCD44low naïve T cells were purified from Foxp3-IRES-RFP reporter mice [19] after sorting, and cultured in presence of varying concentrations of TGF-β and in the presence or absence of gADP to induce conversion of induced Tregs (iTreg). No effect of gADP on iTreg development was observed (Supporting Information Fig.6). Thus, ADP may modulate Treg homeostasis during inflammation rather than de novo generation of iTregs.
DISCUSSION
The present study reports that adiponectin limits autoimmune CNS inflammation, since mice lacking adiponectin exhibited worse clinical and histologic EAE than WT mice, and treatment with adiponectin greatly ameliorated EAE. Myelin specific T cells from immunized ADPKO mice displayed greater responses to antigen, indicating that adiponectin is an important modulator of T cell functions. Interestingly, ADPKO mice had reduced numbers of regulatory CD4+ T cells and a defect of CD25+Foxp3+ Treg suppressive function. Administration of exogenous adiponectin led to increased Treg cell numbers. These findings expand the known roles of adiponectin, and could have clinical implications.
Prior studies showed that calorie restriction ameliorated murine EAE, in association with higher adiponectin levels [8]. A variety of anti-inflammatory properties have been reported for adiponectin, including a direct immunomodulatory effect on antigen-activated human T cells [20]. Reports also exist of adiponectin having pro-inflammatory effects [21]. We predicted a protective function for adiponectin in EAE based on its anti-inflammmatory properties and indeed EAE in ADPKO mice was more severe than in WT mice when induced by active immunization. However, when EAE was induced by adoptive transfer of encephalitogenic Th1 cells into ADPKO vs. WT recipients, no differences were noted. Therefore, the higher CNS mRNA expression of ICAM-1 and VCAM-1 in ADPKO mice appeared to have no effect on disease course. Thus, the main role of adiponectin was deduced to be during T cell priming and activation in peripheral lymphoid tissues. These findings were consistent with the higher proliferation and cytokine production in vitro, and the more severe EAE using passive transfer of T cells from immunized ADPKO mice, compared to cells from WT mice. Although the differences might have resulted from altered function of ADPKO APCs, no differences in proliferation and cytokine production were seen using WT versus ADPKO APCs in vitro. Additionally, naïve ADPKO T cells obtained from un-immunized mice proliferated more than naïve WT T cells in the presence of anti-CD3 and anti-CD28 co-stimulation. All these results indicate that adiponectin is an important regulator of T cell activation and function.
Less efficient immune regulation in ADPKO mice might relate to altered Treg. Treg depletion prior to EAE induction results in worse severity and enhanced inflammatory cytokine production [14], suggesting that Treg cells suppress activation and expansion of effector cells. When we compared phenotypes of cells from EAE-affected ADPKO and WT mice, fewer CD4+Foxp3+CD25+ Tregs were found in peripheral lymphoid organs and CNS of MOG-immunized ADPKO versus WT mice. The number of CD4+CD25+Foxp3+ Tregs, which are normally present in blood, was lower in naïve ADPKO versus WT mice, and ADPKO Treg suppressive functions were defective compared to WT. However, despite the fact that treatment with adiponectin in vivo led to increased Treg numbers in peripheral lymphoid organs, no effect of adiponectin was demonstrated on the conversion of naïve T cells to iTreg in vitro. This suggests that ADP may modulate Treg homeostasis during inflammation rather than de novo generation of iTregs. A previous report showed that adiponectin treatment increased expression of the inhibitory molecule, programmed death-1 ligand (PDL-1) on cultured dendritic cells (DC), thereby increasing Treg cell generation [22]. Our data do not support this hypothesis. We investigated PDL-1 expression on DC isolated from ADPKO and WT mice, and detected no differences (data not shown). Moreover, we have shown that higher proliferation and activation of T cells in ADPKO mice was not mediated by differences in ADP KO vs WT APC.
Two independent studies found that high BMI before age 20 was associated with increased risk of MS development [4, 5]. Obesity is characterized by an abnormal release by visceral adipose tissue of adipokines that can modulate immune responses. The adipokine adiponectin is decreased in obese individuals, perhaps related to increased production by adipose tissue of TNF-α which suppresses its transcription [11]. Treg cells are present in abdominal fat tissue in mice, with reduced numbers in obesity models [23]. The present findings indicate that decreased systemic levels of adiponectin may affect immunological tolerance through effects on Treg cells. These findings are of clinical importance because they support a mechanism by which obesity can be linked with increased risk for autoimmunity. Notably, a defect in the suppressive function of Tregs of MS patients compared to healthy controls has been reported [21].
Adiponectin levels have been reported in MS patients in three studies. Two showed decreased serum adiponectin levels in MS patients [12, 24], whereas the third showed elevated levels in CSF in a small cohort [13]. Adiponectin effects are mediated through specific cell surface receptors, including AdipoR1and AdipoR2, via signaling pathways not yet fully elucidated [25, 26]. Herein, we show in mice that immune cells can express both AdipoR1 and R2. Other adiponectin receptors have been described [27, 28] and adiponectin may act in a non-receptor mediated manner via low-affinity macromolecular interactions [29].
Relevant to the potential clinical application of these studies, treatment with gADP almost completely suppressed the development of EAE. Several forms of adiponectin have been isolated from humans and laboratory animals, including full-length, globular, and multimeric isoforms [10]. The globular fragment of adiponectin (gADP) has metabolic and vascular protective actions, [9, 30] including direct regulation of adhesion molecule expression and nitric oxide production by endothelium [17]. Globular adiponectin is highly active [9] and its effects have been tested in several murine models [17, 31]. In our studies, treatment with gADP after EAE induction attenuated clinical EAE and was associated with increased Treg numbers.
In summary, the present studies indicate that adiponectin regulates the immune system in a mouse autoimmune model of MS with direct regulatory effects on T cell function, possibly mediated by Tregs. Although not a perfect model for MS, EAE has been instrumental in developing new MS therapies. Manipulation of adiponectin in MS offers a novel potential treatment strategy, especially for overweight MS patients.
MATERIALS AND METHODS
Mice
Protocols were approved by the institution’s Animal Studies Committee. ADPKO and wild-type C57BL/6 mice, initially derived from littermates and subsequently bred in parallel, were transferred from Baylor College of Medicine [15] and bred at Washington University. Lack of adiponectin in KO mice was confirmed by RT-PCR and by ELISA (Millipore, Billerica, MA). Naïve age-and gender-matched WT and ADPKO mice were compared for body composition using EchoMRI (Echo Medical System, Houston, TX).
EAE induction
Mice were immunized with MOG35-55 (Sigma Genosys, Woodlands, TX) to induce EAE as described [8]. For adoptive transfer experiments, MOG35-55 specific Th1 cells were generated as described [32]. Briefly, donor mice were immunized with MOG35-55 peptide. Spleens were removed 14 days pi and CD4+ T cells were purified and maintained in culture in presence of irradiated splenocytes, IL-12 and IL-2. Cells were restimulated every week and after the sixth stimulation MOG-specific T cells were harvested, washed, and transferred intravenously at 10×106 cells/mouse to induce EAE. Mice were scored using a published scale from 0 to 5 [8]. Histologic assessments of the CNS and immunohistochemistry to quantitate axon damage during EAE was performed as published [8]. Recombinant gADP (PeproTech, Rocky Hill, NJ) was given intraperitoneally (ip) at 25 μg/mouse twice a day for 7 days (day 5 to 12 pi). In experiments in which AMPK phosphorylation was measured, tissue were obtained 30 minutes or 1 hour after ip injection.
ELISPOT assays
Elispot assays for mouse IL-2 and IFN-γ were performed per manufacturer instructions (BD Biosciences, Franklin Lakes, NJ). Cells from the CNS were cultured in a 96-well plate in duplicate with MOG35-55, with irradiated splenocytes as APCs, for 20 hours at 37°C. Spots were counted with an ELISPOT reader (Cellular Technology Ltd., Shaker Heights, OH) using Immunospot software Version 5.0.9.
Proliferation and cytokine assays of cultured lymphoid cells
At specified time-points after immunization, lymphoid cells were cultured in triplicate at 2.5×10⁶ cells/ml in complete RPMI-1640 with 5% serum from naïve ADPKO mice with or without 10μg/ml of MOG35-55 for 72h. 3H-thymidine incorporation during the final 18h was counted (Microbeta Trilux, PerkinElmer LAS, Shelton CT). In some experiments, CD4- APCs from ADPKO versus WT mice were isolated by AutoMACS ProSeparator (Miltenyi Biotec, Auburn CA), irradiated, and then used to compare proliferation and cytokine production by CD4+ T cells from ADPKO or WT mice in response to MOG and cultured in complete RPMI-1640 with 5% of FBS. Purified CD4+T cells from ADPKO or WT mice were stimulated with anti-CD3 (clone 2C11; 10 μg/ml) without APCs in some experiments. When naïve T cells were used in vitro, CD4+ CD62Lhigh CD44low naïve T cells from lymph node cells and spleens of ADPKO and WT mice were purified by sorting (FACSAria, Becton Dickinson) and then stimulated in vitro (200,000 cells/well) with anti-CD3 coated on plates for 72h. To measure cytokine production, lymphoid cells were cultured identically to the proliferation assay plates. Cytokines in the cell supernates were measured by Cytometric Bead Arrays (BD Bioscience) or commercial ELISA for Leptin (Invitrogen, Camarillo, CA).
Real-time PCR
mRNA was isolated with miRNeasy Mini Kit (Qiagen, Valencia, CA). Quantitative real-time PCR was performed on an ABI PRISM 7000 System (Applied Biosystems, Foster City, CA) using qScript One-Step qRT-PCR Kit with ROX (Quanta BioSciences, Gaithersburg MD). Samples were run in triplicate for 40 cycles to obtain threshold cycle (CT) values for GAPDH and target gene expression. Using 7000 SDS 1.2.3 Relative Quantification software (Applied Biosystems), target gene expression was first normalized to GAPDH expression. Relative quantification to a calibrator group, naïve WT C57BL/6 tissues, was then calculated using the equation L2-ΔΔCt. By definition, this value is 1.0 for the calibrator group.
Western blots
Tissues were homogenized in RIPA buffer. Proteins were mixed with loading buffer containing 10% β-mercaptoethanol, heated 10 min to 100°C, and separated by 12% NuPAGE Bis-Tris Gel electrophoresis (Invitrogen). Next, proteins were electro-transferred to a nitrocellulose membrane (Millipore). The membranes were incubated overnight at 4°C with rabbit anti-mouse polyclonal antibodies targeting AdipoR1 or AdipoR2 [26, 33] and then with secondary anti-rabbit antibodies HRP for 1 h. For experiments in which the ratios between AMPK and AMPK phosphorylated in liver, muscle, spleen and spinal cord were determined, we used specific antibodies to AMPK and p-AMPK (Cell Signaling, Beverly, MA). Signal was developed with a chemiluminescent substrate (Thermo Fisher Scientific, Rockford, IL) and visualized by super cooled-CCD camera system (Bio-Rad, Hercules, CA).
Flow cytometry for immune cell phenotyping and T-regulatory cell quantitation
Lymphoid cells from lymph nodes and spleens were phenotyped by flow cytometry (FACSCalibur) using fluorescent antibodies (all from BD Biosciences) to the following: CD4 and CD8 (T cells), CD19 (B cells), CD11b (monocytes), CD11c (dendritic cells), CD62L and CD44. Tregs were identified by staining for surface CD4 and CD25, and for intracellular Foxp3 using a kit (eBioscience, San Diego, CA).
T regulatory cell functional assays
Tregs were obtained by sorting spleen and lymph node cells from naïve mice for CD4 and CD25 (FACSAria). Effector CD4+ CD25- T cells were separated by magnetic bead isolation (Miltenyi) and labeled with CFSE. Irradiated WT splenocytes were used as APCs. All fractions were cultured with RPMI 1460 containing 5% ADPKO serum in round-bottom 96-well plates pretreated with anti-murine CD3 antibody (200,000 APC cells/well; 100,000 T effector cells/well; WT and ADPKO Treg cells were cultured at two concentrations each, 50,000 and 25,000 cells/well). T effector cell proliferation was measured by CFSE dilution by flow cytometry.
In vitro generation of induced Treg (iTreg)
In these experiments we used Foxp3-IRES-RFP reporter mice in which Foxp3 Tregs are fluorescently labeled with enhanced red fluorescent protein (FIR mice) as previously described [19]. Foxp3 negative T cells were isolated from spleen and lymph nodes of FIR mice by sorting for CD4+ CD62LhighCD44lowCD25- RFP-. Cells were then plated at a concentration of 1×10⁶/ml in the presence of plate-bound anti-CD3 antibody (1 μg/ml), soluble antiCD28 (1 μg/ml), IL-2 (40 ng/ml), TGFβ (0–4 ng/ml) (all reagents from Biolegend) and with or without gADP (25 μg/ml). Cells were cultured in presence of 5% FBS. On day 5 in culture cells were analyzed by flow cytometry for expression of CD25 and RFP.
Statistical Analyses
Mean day of EAE onset, maximum clinical scores, histological scores, and assays were compared using two-tailed t-tests, Mann-Whitney U tests, and Kruskal-Wallis tests, dependent on number of groups, and whether data were parametric or not. Welch’s correction was included for t- tests with unequal variances between groups. Incidence of EAE and death from EAE were compared between groups using Fisher’s exact test. Differences in disease course over time between groups was analyzed using area under the curve estimates [34].
Supplementary Material
Figure S1. AdipoR1 and R2 are expressed by murine lymph node cells and splenocytes. Spleen and lymph node cells where isolated from naïve and MOG35-55 immunized C57BL/6 WT mice and the CD3+ T lymphocytes, CD19+ B lymphocytes and the CD11b+ cell populations were separated by cell sorting. To obtain sufficient cells for each subpopulation, splenocytes and lymph node cells from five mice per treatment group were pooled before sorting. (A) Messenger RNA expression for AdipoR1 and AdipoR2 was investigated in the different cell subpopulations by quantitative RT-PCR. Target gene expression was normalized to a housekeeping gene expression, GAPDH. Data are given as quantification for each gene relative to expression levels in spinal cords from naïve C57BL/6 mice (calibrator). (B) AdipoR1 and R2 protein expression was evaluated by Western blot on each subpopulation of immune cells, isolated from lymph nodes and spleens of MOG35-55 immunized mice. Lanes 1 and 3= CD3+ cells; lanes 2 and 4= CD19+ cells; lane 5= CD11+ cells; lane 6= CD3-CD19-CD11b- cells; and from total splenocytes from naïve mice (lane 7). LN= lymph nodes.
Figure S2. Higher proliferation of ADPKO CD4+ T cell compared to WT CD4+ T cells in response to anti-CD3 stimulation in the absence of APCs. Lymph node cells were isolated from immunized ADPKO and WT mice on day 11 pi (n=3/group), CD4+ T cells were purified by magnetic sorting and stimulated in vitro with anti-CD3 antibody coated on the plate without APCs or cultured with medium alone. For each individual mouse, mean CPM ± SD was calculated from triplicate wells. Results are shown as means ± SD. Data representative of three different experiments with similar results. Black bars: WT; Open bars: ADPKO. CPM=counts per minute.
Figure S3. Naïve ADPKO T cells are more activated than naïve WT T cells. CD4+ CD62Lhigh CD44low naïve T cells sorted from total lymph node cells and splenocytes of ADPKO and WT mice were stimulated in vitro with anti-CD3 coated on plates and anti-CD28 for 72h. A significant higher T cell proliferation was observed in the ADPKO group compared to WT (P<0.05 by t-test). Black bars: WT; Open bars: ADPKO. CPM=counts per minute.
Figure S4. Numbers of Tregs in naïve WT and ADPKO mice. Numbers of CD25+ Foxp3+ cells within the CD4+ cell population were calculated. Absolute numbers of CD4+CD25+Foxp3+ Treg cells were calculated based on the total number of splenocytes, lymph node cells or thymocytes/mouse. Results are means ± SD.
Figure S5. Treatment with gADP led to adenosine monophosphate (AMP)-activated protein kinase (AMPK) activation in vivo. (A) Expression of AMPK and phosphorylated (p) AMPK was detected by western blot using specific antibodies in the liver, fat tissue, spinal cord and spleen of C57BL/6 mice treated with gADP or PBS (n=3/group). (B) The ratio of intensities for pAMPK and AMPK detections were calculated and they were higher in tissues obtained from gADP treated mice compared to PBS treated controls with differences reaching significance in all the tissues, but the spleens. Error bars represent mean ± SD. NS: not significant.
Figure S6. gADP does not affect the conversion of naïve T cell into Treg in vitro. CD25negFoxp3(RFP)negCD4+CD62highCD44low naïve T cells were isolated from spleen and lymph nodes of Foxp3-IRES-RFP reporter mice. Cells were plated in the presence of plate-bound anti-CD3 antibody, soluble antiCD28, TGFβ, IL-2 and with or without gADP. On day 5 in culture cells were analyzed by flow cytometry for expression of CD25 and RFP which would be up-regulated in those cells that differentiated into Tregs.
Acknowledgments
The authors thank Drs. J. Russell, R. Klein, G. Wu, and P. Scherer for critical discussions, Dr. K. Trinkaus for statistical assistance, R. Scalia for advice on gADP treatment in vivo, J. Sim and Drs. N. Rapp and Q. Wang for technical assistance. This work was supported by grants from the Consortium of MS Centers (A.H.C.), the National MS Society (NMSS) [PP1645 to L.P.], McDonnell Center for Cellular & Molecular Neurobiology, Nutrition and Obesity Research Center (NORC) [P30 DK056341 to A.H.C.], Fondazione Italiana Sclerosi Multipla (FISM) [2009/R/33 to L.P.], Barnes-Jewish Foundation and National Institutes of Health (NIH) [DK080344 to L.Q.D.]. L.P. is a Harry Weaver Neuroscience Scholar of NMSS [JF 2144A2/1]. A.H.C. was supported by the Manny and Rosalyn Rosenthal-Dr. John L. Trotter Chair.
Abbreviations
- ADPKO
adiponectin deficient mice
- MOG
myelin oligodendrocyte glycoprotein
- MRI
magnetic resonance imaging
- AdipoR
adiponectin receptor
- gADP
globular adiponectin
Footnotes
The authors have declared that no financial conflict of interest exists for the subject of this article.
References
- 1.Schwarz S, Leweling H. Multiple sclerosis and nutrition. Mult Scler. 2005;11:24–32. doi: 10.1191/1352458505ms1119oa. [DOI] [PubMed] [Google Scholar]
- 2.Swank RL, Dugan BB. Effect of low saturated fat diet in early and late cases of multiple sclerosis. Lancet. 1990;336:37–39. doi: 10.1016/0140-6736(90)91533-g. [DOI] [PubMed] [Google Scholar]
- 3.Gold R, Linington C, Lassmann H. Understanding pathogenesis and therapy of multiple sclerosis via animal models: 70 years of merits and culprits in experimental autoimmune encephalomyelitis research. Brain. 2006;129:1953–1971. doi: 10.1093/brain/awl075. [DOI] [PubMed] [Google Scholar]
- 4.Hedstrom AK, Olsson T, Alfredsson L. High body mass index before age 20 is associated with increased risk for multiple sclerosis in both men and women. Mult Scler. 2012 doi: 10.1177/1352458512436596. [DOI] [PubMed] [Google Scholar]
- 5.Munger KL, Chitnis T, Ascherio A. Body size and risk of MS in two cohorts of US women. Neurology. 2009;73:1543–1550. doi: 10.1212/WNL.0b013e3181c0d6e0. [DOI] [PMC free article] [PubMed] [Google Scholar]
- 6.Shoelson SE, Herrero L, Naaz A. Obesity, inflammation, and insulin resistance. Gastroenterology. 2007;132:2169–2180. doi: 10.1053/j.gastro.2007.03.059. [DOI] [PubMed] [Google Scholar]
- 7.Fantuzzi G. Adipose tissue, adipokines, and inflammation. J Allergy Clin Immunol. 2005;115:911–919. doi: 10.1016/j.jaci.2005.02.023. quiz 920. [DOI] [PubMed] [Google Scholar]
- 8.Piccio L, Stark JL, Cross AH. Chronic calorie restriction attenuates experimental autoimmune encephalomyelitis. J Leukoc Biol. 2008;84:940–948. doi: 10.1189/jlb.0208133. [DOI] [PMC free article] [PubMed] [Google Scholar]
- 9.Fruebis J, Tsao TS, Javorschi S, Ebbets-Reed D, Erickson MR, Yen FT, Bihain BE, Lodish HF. Proteolytic cleavage product of 30-kDa adipocyte complement-related protein increases fatty acid oxidation in muscle and causes weight loss in mice. Proc Natl Acad Sci U S A. 2001;98:2005–2010. doi: 10.1073/pnas.041591798. [DOI] [PMC free article] [PubMed] [Google Scholar]
- 10.Kadowaki T, Yamauchi T. Adiponectin and adiponectin receptors. Endocr Rev. 2005;26:439–451. doi: 10.1210/er.2005-0005. [DOI] [PubMed] [Google Scholar]
- 11.Tilg H, Moschen AR. Adipocytokines: mediators linking adipose tissue, inflammation and immunity. Nat Rev Immunol. 2006;6:772–783. doi: 10.1038/nri1937. [DOI] [PubMed] [Google Scholar]
- 12.Musabak U, Demirkaya S, Genc G, Ilikci RS, Odabasi Z. Serum adiponectin, TNF-alpha, IL-12p70, and IL-13 levels in multiple sclerosis and the effects of different therapy regimens. Neuroimmunomodulation. 2011;18:57–66. doi: 10.1159/000317393. [DOI] [PubMed] [Google Scholar]
- 13.Hietaharju A, Kuusisto H, Nieminen R, Vuolteenaho K, Elovaara I, Moilanen E. Elevated cerebrospinal fluid adiponectin and adipsin levels in patients with multiple sclerosis: a Finnish co-twin study. Eur J Neurol. 2010;17:332–334. doi: 10.1111/j.1468-1331.2009.02701.x. [DOI] [PubMed] [Google Scholar]
- 14.O’Connor RA, Anderton SM. Foxp3+ regulatory T cells in the control of experimental CNS autoimmune disease. J Neuroimmunol. 2008;193:1–11. doi: 10.1016/j.jneuroim.2007.11.016. [DOI] [PubMed] [Google Scholar]
- 15.Ma K, Cabrero A, Saha PK, Kojima H, Li L, Chang BH, Paul A, Chan L. Increased beta -oxidation but no insulin resistance or glucose intolerance in mice lacking adiponectin. J Biol Chem. 2002;277:34658–34661. doi: 10.1074/jbc.C200362200. [DOI] [PubMed] [Google Scholar]
- 16.Nishida M, Funahashi T, Shimomura I. Pathophysiological significance of adiponectin. Med Mol Morphol. 2007;40:55–67. doi: 10.1007/s00795-007-0366-7. [DOI] [PubMed] [Google Scholar]
- 17.Ouedraogo R, Gong Y, Berzins B, Wu X, Mahadev K, Hough K, Chan L, Goldstein BJ, Scalia R. Adiponectin deficiency increases leukocyte-endothelium interactions via upregulation of endothelial cell adhesion molecules in vivo. J Clin Invest. 2007;117:1718–1726. doi: 10.1172/JCI29623. [DOI] [PMC free article] [PubMed] [Google Scholar]
- 18.Brochu-Gaudreau K, Rehfeldt C, Blouin R, Bordignon V, Murphy BD, Palin MF. Adiponectin action from head to toe. Endocrine. 2010;37:11–32. doi: 10.1007/s12020-009-9278-8. [DOI] [PubMed] [Google Scholar]
- 19.Wan YY, Flavell RA. Identifying Foxp3-expressing suppressor T cells with a bicistronic reporter. Proc Natl Acad Sci U S A. 2005;102:5126–5131. doi: 10.1073/pnas.0501701102. [DOI] [PMC free article] [PubMed] [Google Scholar]
- 20.Wilk S, Scheibenbogen C, Bauer S, Jenke A, Rother M, Guerreiro M, Kudernatsch R, Goerner N, Poller W, Elligsen-Merkel D, Utku N, Magrane J, Volk HD, Skurk C. Adiponectin is a negative regulator of antigen-activated T cells. Eur J Immunol. 2011;41:2323–2332. doi: 10.1002/eji.201041349. [DOI] [PubMed] [Google Scholar]
- 21.Fantuzzi G. Adiponectin and inflammation: consensus and controversy. J Allergy Clin Immunol. 2008;121:326–330. doi: 10.1016/j.jaci.2007.10.018. [DOI] [PubMed] [Google Scholar]
- 22.Tsang JY, Li D, Ho D, Peng J, Xu A, Lamb J, Chen Y, Tam PK. Novel immunomodulatory effects of adiponectin on dendritic cell functions. Int Immunopharmacol. 2011;11:604–609. doi: 10.1016/j.intimp.2010.11.009. [DOI] [PubMed] [Google Scholar]
- 23.Feuerer M, Herrero L, Cipolletta D, Naaz A, Wong J, Nayer A, Lee J, Goldfine AB, Benoist C, Shoelson S, Mathis D. Lean, but not obese, fat is enriched for a unique population of regulatory T cells that affect metabolic parameters. Nat Med. 2009;15:930–939. doi: 10.1038/nm.2002. [DOI] [PMC free article] [PubMed] [Google Scholar]
- 24.Kraszula L, Jasinska A, Eusebio MO, Kuna P, Glabinski A, Pietruczuk M. Evaluation of the relationship between leptin, resistin, adiponectin and natural regulatory T cells in relapsing-remitting multiple sclerosis. Neurol Neurochir Pol. 2012;46:22–28. doi: 10.5114/ninp.2012.27211. [DOI] [PubMed] [Google Scholar]
- 25.Holland WL, Miller RA, Wang ZV, Sun K, Barth BM, Bui HH, Davis KE, Bikman BT, Halberg N, Rutkowski JM, Wade MR, Tenorio VM, Kuo MS, Brozinick JT, Zhang BB, Birnbaum MJ, Summers SA, Scherer PE. Receptor-mediated activation of ceramidase activity initiates the pleiotropic actions of adiponectin. Nat Med. 2011;17:55–63. doi: 10.1038/nm.2277. [DOI] [PMC free article] [PubMed] [Google Scholar]
- 26.Mao X, Kikani CK, Riojas RA, Langlais P, Wang L, Ramos FJ, Fang Q, Christ-Roberts CY, Hong JY, Kim RY, Liu F, Dong LQ. APPL1 binds to adiponectin receptors and mediates adiponectin signalling and function. Nat Cell Biol. 2006;8:516–523. doi: 10.1038/ncb1404. [DOI] [PubMed] [Google Scholar]
- 27.Hug C, Wang J, Ahmad NS, Bogan JS, Tsao TS, Lodish HF. T-cadherin is a receptor for hexameric and high-molecular-weight forms of Acrp30/adiponectin. Proc Natl Acad Sci U S A. 2004;101:10308–10313. doi: 10.1073/pnas.0403382101. [DOI] [PMC free article] [PubMed] [Google Scholar]
- 28.Takemura Y, Ouchi N, Shibata R, Aprahamian T, Kirber MT, Summer RS, Kihara S, Walsh K. Adiponectin modulates inflammatory reactions via calreticulin receptor-dependent clearance of early apoptotic bodies. J Clin Invest. 2007;117:375–386. doi: 10.1172/JCI29709. [DOI] [PMC free article] [PubMed] [Google Scholar]
- 29.Okamoto Y, Arita Y, Nishida M, Muraguchi M, Ouchi N, Takahashi M, Igura T, Inui Y, Kihara S, Nakamura T, Yamashita S, Miyagawa J, Funahashi T, Matsuzawa Y. An adipocyte-derived plasma protein, adiponectin, adheres to injured vascular walls. Horm Metab Res. 2000;32:47–50. doi: 10.1055/s-2007-978586. [DOI] [PubMed] [Google Scholar]
- 30.Yamauchi T, Kamon J, Waki H, Imai Y, Shimozawa N, Hioki K, Uchida S, Ito Y, Takakuwa K, Matsui J, Takata M, Eto K, Terauchi Y, Komeda K, Tsunoda M, Murakami K, Ohnishi Y, Naitoh T, Yamamura K, Ueyama Y, Froguel P, Kimura S, Nagai R, Kadowaki T. Globular adiponectin protected ob/ob mice from diabetes and ApoE-deficient mice from atherosclerosis. J Biol Chem. 2003;278:2461–2468. doi: 10.1074/jbc.M209033200. [DOI] [PubMed] [Google Scholar]
- 31.Qi Y, Takahashi N, Hileman SM, Patel HR, Berg AH, Pajvani UB, Scherer PE, Ahima RS. Adiponectin acts in the brain to decrease body weight. Nat Med. 2004;10:524–529. doi: 10.1038/nm1029. [DOI] [PubMed] [Google Scholar]
- 32.Gimenez MA, Sim J, Archambault AS, Klein RS, Russell JH. A tumor necrosis factor receptor 1-dependent conversation between central nervous system-specific T cells and the central nervous system is required for inflammatory infiltration of the spinal cord. Am J Pathol. 2006;168:1200–1209. doi: 10.2353/ajpath.2006.050332. [DOI] [PMC free article] [PubMed] [Google Scholar]
- 33.Wang C, Xin X, Xiang R, Ramos FJ, Liu M, Lee HJ, Chen H, Mao X, Kikani CK, Liu F, Dong LQ. Yin-Yang regulation of adiponectin signaling by APPL isoforms in muscle cells. J Biol Chem. 2009;284:31608–31615. doi: 10.1074/jbc.M109.010355. [DOI] [PMC free article] [PubMed] [Google Scholar]
- 34.Fleming KK, Bovaird JA, Mosier MC, Emerson MR, LeVine SM, Marquis JG. Statistical analysis of data from studies on experimental autoimmune encephalomyelitis. J Neuroimmunol. 2005;170:71–84. doi: 10.1016/j.jneuroim.2005.08.020. [DOI] [PubMed] [Google Scholar]
Associated Data
This section collects any data citations, data availability statements, or supplementary materials included in this article.
Supplementary Materials
Figure S1. AdipoR1 and R2 are expressed by murine lymph node cells and splenocytes. Spleen and lymph node cells where isolated from naïve and MOG35-55 immunized C57BL/6 WT mice and the CD3+ T lymphocytes, CD19+ B lymphocytes and the CD11b+ cell populations were separated by cell sorting. To obtain sufficient cells for each subpopulation, splenocytes and lymph node cells from five mice per treatment group were pooled before sorting. (A) Messenger RNA expression for AdipoR1 and AdipoR2 was investigated in the different cell subpopulations by quantitative RT-PCR. Target gene expression was normalized to a housekeeping gene expression, GAPDH. Data are given as quantification for each gene relative to expression levels in spinal cords from naïve C57BL/6 mice (calibrator). (B) AdipoR1 and R2 protein expression was evaluated by Western blot on each subpopulation of immune cells, isolated from lymph nodes and spleens of MOG35-55 immunized mice. Lanes 1 and 3= CD3+ cells; lanes 2 and 4= CD19+ cells; lane 5= CD11+ cells; lane 6= CD3-CD19-CD11b- cells; and from total splenocytes from naïve mice (lane 7). LN= lymph nodes.
Figure S2. Higher proliferation of ADPKO CD4+ T cell compared to WT CD4+ T cells in response to anti-CD3 stimulation in the absence of APCs. Lymph node cells were isolated from immunized ADPKO and WT mice on day 11 pi (n=3/group), CD4+ T cells were purified by magnetic sorting and stimulated in vitro with anti-CD3 antibody coated on the plate without APCs or cultured with medium alone. For each individual mouse, mean CPM ± SD was calculated from triplicate wells. Results are shown as means ± SD. Data representative of three different experiments with similar results. Black bars: WT; Open bars: ADPKO. CPM=counts per minute.
Figure S3. Naïve ADPKO T cells are more activated than naïve WT T cells. CD4+ CD62Lhigh CD44low naïve T cells sorted from total lymph node cells and splenocytes of ADPKO and WT mice were stimulated in vitro with anti-CD3 coated on plates and anti-CD28 for 72h. A significant higher T cell proliferation was observed in the ADPKO group compared to WT (P<0.05 by t-test). Black bars: WT; Open bars: ADPKO. CPM=counts per minute.
Figure S4. Numbers of Tregs in naïve WT and ADPKO mice. Numbers of CD25+ Foxp3+ cells within the CD4+ cell population were calculated. Absolute numbers of CD4+CD25+Foxp3+ Treg cells were calculated based on the total number of splenocytes, lymph node cells or thymocytes/mouse. Results are means ± SD.
Figure S5. Treatment with gADP led to adenosine monophosphate (AMP)-activated protein kinase (AMPK) activation in vivo. (A) Expression of AMPK and phosphorylated (p) AMPK was detected by western blot using specific antibodies in the liver, fat tissue, spinal cord and spleen of C57BL/6 mice treated with gADP or PBS (n=3/group). (B) The ratio of intensities for pAMPK and AMPK detections were calculated and they were higher in tissues obtained from gADP treated mice compared to PBS treated controls with differences reaching significance in all the tissues, but the spleens. Error bars represent mean ± SD. NS: not significant.
Figure S6. gADP does not affect the conversion of naïve T cell into Treg in vitro. CD25negFoxp3(RFP)negCD4+CD62highCD44low naïve T cells were isolated from spleen and lymph nodes of Foxp3-IRES-RFP reporter mice. Cells were plated in the presence of plate-bound anti-CD3 antibody, soluble antiCD28, TGFβ, IL-2 and with or without gADP. On day 5 in culture cells were analyzed by flow cytometry for expression of CD25 and RFP which would be up-regulated in those cells that differentiated into Tregs.