Abstract
Previous studies have demonstrated the existence of optimization criteria in the design and development of mammalians cardiovascular systems. Similarities in mammalian arterial wave reflection suggest there are certain design criteria for the optimization of arterial wave dynamics. Inspired by these natural optimization criteria, we investigated the feasibility of optimizing the aortic waves by modifying wave reflection sites. A hydraulic model that has physical and dynamical properties similar to a human aorta and left ventricle was used for a series of in-vitro experiments. The results indicate that placing an artificial reflection site (a ring) at a specific location along the aorta may create a constructive wave dynamic that could reduce LV pulsatile workload. This simple bio-inspired approach may have important implications for the future of treatment strategies for diseased aorta.
Introduction
Congestive Heart Failure (CHF) is a condition in which the heart fails to circulate enough blood in the vascular networks. CHF has reached an epidemic level where the number of patients suffering from this condition in the U.S. alone is more than five million and growing [1]. Clinical investigations have confirmed that pulsatile load plays an important role in the pathogenesis of left ventricular hypertrophy (LVH) and the progression of LVH to CHF [2], [3], [4]. The pulsatile load is the result of the complex dynamics of wave propagation and reflection in compliant arterial vasculature [5], [6]. Significant efforts have been made to understand the wave dynamics of the arterial system and to clarify its role in heart failure and other cardiovascular diseases [2], [3], [4], [7], [8], [9].
The pulsatile load on the left ventricle is controlled by the wave dynamics of the arterial vasculature [5], [6]. Wave dynamics in a compliant tube is mainly dominated by three parameters: (1) fundamental frequency (or wavelength) of the waves; (2) wave speed (which is defined by material properties of the tube); and (3) the location of reflection sites [10], [11], [12]. Similarly, wave dynamics in the aorta and arterial network is determined by heart rate (HR), pulse wave velocity (PWV), and reflection sites. The interplay among these three parameters defines a wave dynamics condition where the pulsatile workload on the heart is minimized. Using a simplified computational model of the aorta we have previously shown the interplay among these wave dynamic parameters results in an optimum HR in which the pulsatile workload is minimized [13]. There were several limitations involved with this computational study; therefore, it is necessary to confirm the finding using a physiologically relevant experimental model. Our main objective in this manuscript is to introduce a bio-inspired approach to reduce the pulsatile workload. In this manuscript, we also present validation of the finding of our previous computational study (the optimum HR concept) using an in-vitro experimental approach.
Previous studies have demonstrated the existence of optimization criteria in design and development of mammalians cardiovascular system [14], [15], [16], [17], [18], [19]. Arterial wave dynamic parameters such as the reflection coefficient [20], normalized input impedance[21], pulse wave velocity[17], [18]; as well as the product of the propagation constant and the aortic length [20] are all invariant of mammalian size. These similarities in mammalian arterial wave reflection suggest there are certain design criteria for the optimization of arterial wave dynamics. Quick et al [22] showed that wave reflections are optimized in animals under normal physiological conditions. They also showed that either reducing or increasing wave reflections results in an elevation of LV pulsatile workload [22]. Their study suggests that the mammalian arterial system is designed to optimize the wave reflections rather than minimize them. Inspired by this natural optimization criterion, we will investigate in this study if it is possible to optimize the aortic waves by simply modifying reflection sites in order to reduce the pulsatile workload on the heart.
Materials and Methods
Equipment and Materials
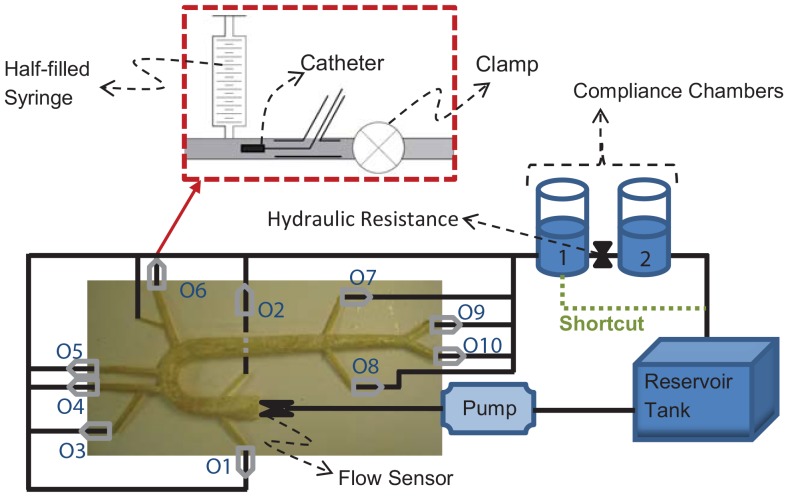
An experimental hydraulic model called the aortic simulator was used in this study (Figure 1). The aortic simulator is a hydraulic model that has physical and dynamical properties similar to a human aorta and left ventricle which can be used for the in-vitro hemodynamic studies.
Figure 1. Schematic of the Aortic Simulator.
Schematics of the outlet units are shown in the dashed-red box. The numbers at the outlets correspond to the value given in Table 3.
The left ventricle was simulated by a piston-in-cylinder pump (ViVitro Labs Inc. SuperPump System: Model SPS3891) that generates the pulsatile flow (using a programmed waveform generator WG5891) and sends it into a compliant aorta. The artificial aortas were built based on a 1-1 scale of a human aorta mold and it includes major branches of the aorta, aortic arch, and aortic tapering. Figure 2 and Table 1 provides the schematic and the dimensions of the aortic mold which was used in this study to create the aortas. Different compliant models of the artificial aorta were made from clear natural latex (Chemionics Corp.) and silicone (39 Shore A Hardness RTV Silicone). We made aortas with different compliances by changing the number of applications of dipping (for latex aortas) or coating (for silicone aortas). Different compliances resulted in different wave speeds or pulse wave velocities (PWV). Relevant dynamical and physiological characteristics of these aortas such as characteristic impedance (Zc), aortic compliance (AC), and PWV are provided in Table 2. The foot-to-foot method [23] was applied to compute the PWV of each aorta (Table 2). The aortic rigidities (PWV) used in this study belong to healthy humans older than 60. However, under disease conditions such as hypertension and diabetes, the aortic rigidity increases considerably [24].
Figure 2. Schematic of the aortic mold.
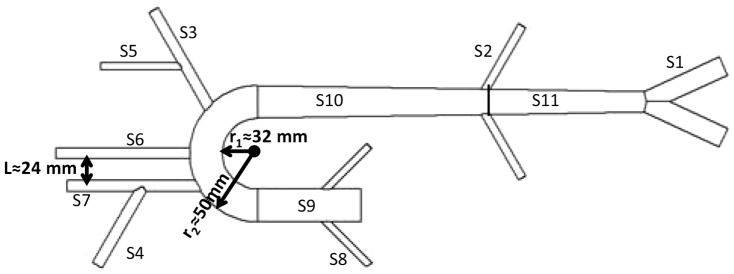
Dimensions are provided in Table 1.
Table 1. Geometrical properties of the aortic mold.
| Segment No. | Artery | Length | Diameter |
| S1 | Iliac | 76 (mm) | 12 (mm) |
| S2 | Renal | 65 (mm) | 5 (mm) |
| S3 | Left subclavian | 100 (mm) | 7 (mm) |
| S4 | Right subclavian | 65 (mm) | 7 (mm) |
| S5 | Vertebral | 65 (mm) | 5 (mm) |
| S6 | Left carotid | 100 (mm) | 7 (mm) |
| S7 | Right carotid | 100 (mm) | 7 (mm) |
| S8 | Coronary | 45 (mm) | 4 (mm) |
| S9 | Ascending aorta | 70 (mm) | 24 (mm) |
| S10 | Thoracic aorta | 170 (mm) | 20 (start) –24 (end) (mm) |
| S11 | Abdominal aorta | 130 (mm) | 16 (start) –20 (end) (mm) |
Table 2. Dynamical and physiological properties of the artificial aortas.
| Aorta No. | Zc (dyne.sec.cm−3) | AC (cm5.dyne−1) | PWV (m.s−1) | material |
| M1 | 670 | 64.5×10⁻⁵ | 6.7 | Silicone |
| M2 | 860 | 54.7×10⁻⁵ | 8.6 | Latex |
| M3 | 950 | 32.2×10⁻⁵ | 9.5 | Latex |
| M4 | 1140 | 49.5×10⁻⁵ | 11.4 | Silicone |
| M5 | 1300 | 30.7×10⁻⁵ | 13 | Latex |
| M6 | 1350 | 30.7×10⁻⁵ | 13.5 | Latex |
| M7 | 1500 | 23.2×10⁻⁵ | 15 | Latex |
| aPhysiological range | (500–1500) | (0.34–2.35) | (5–24) |
A unit was designed to the end of each outlet that mimics the resistance and compliance of the eliminated vasculature. This unit includes one syringe, one clamp, and one port for catheter insertion (Figure 1). The syringe is half-filled with air which provides the required compliance of the eliminated vascular network (see Table 2). The added end-compliance depends on the mean pressure and air volume in the syringes ( , see the Supporting Information file for the derivation). The compliance values are provided in Table 3. The clamp was to increase the terminal resistance. The aortic simulator also includes two compliance chambers with hydraulic resistance in between that were installed at the end of the aortic loop. These chambers enabled us to control the total volume compliance (the values are provides in Table 3). The reservoir tank is the last component of the aortic simulator. It connects the second chambers to the inlet of the pump (Figure 1).
Table 3. Volume compliance by air column.
| Outlet location | air volume (mL) | VC1 (cm5.dyne−1) | VC2 (cm5.dyne−1) |
| Location O1 and O2 | 6 |

|

|
| Location O3 and O6 | 12 |

|

|
| Location O4 and O5 | 15 |

|

|
| Location O7 and O8 | 15 |

|

|
| Location O9 and O10 | 24 |

|

|
| Cylindrical Chamber 1 | 1402 |

|

|
| Cylindrical Chamber 2 | 1402 |

|
N.Aa |
| Total Volume Compliance |

|

|
|
VC1 is the volume compliance at the mean pressure of pmean≈104.5 mmHg (setup1; see Measurement and Procedures section). VC2 is the volume compliance at the mean pressure of pmean≈83 mmHg (setup1; see Measurements and Procedures). For outlet location See Figure 1. aCylindrical Chamber 2 was removed in setup 2 (see Measurements and Procedures)
Measurements and Procedures
The pressure data was measured at the aortic input and outlet of the compliant aorta (outlet 9 in Figure 1) using Swan-Ganz catheters (Swan-Ganz 116F4 pediatric double lumen monitoring catheter at the inlet and Swan-Ganz 116F5 pediatric double lumen monitoring catheter at the outlet, Edwards Life Sciences) and Utah Medical Disposable pressure transducers (DPT-400). The signals were collected using the Tri-pack pressure measuring systems (TP8891, Vivitro Labs Inc.). The Tri-pack system consists of three bridge amplifiers. H16XL Transonic flow sensor (Transonic Systems Inc.) in combination with a T110 Transonic Bypass flow meter was used to measure the volume flow rate at the inlet. The pressure and flow measurements have been done simultaneously. The pressure and flow data were collected for 4 seconds and each experiment was repeated at least 5 times.
Experiments were completed at various heart rates (ranging from 60 bpm to 200 bpm) with seven different aortas (see Table 2). In all experiments, water was used as the circulating fluid and any visible air bubbles were removed prior to the experiments. The pump was operating under 40% systole (waveform C, waveform generator WG5891) in all experiments. Cardiac output (CO) was kept constant (≈5 L/min) in all experiments. We used three experimental setups in this study. These setups are as follows:
Setup 1: This setup is the same as the one shown in Figure 1. This setup included two compliance chambers and the resistance between the two.
Setup 2 (low volume compliance and low resistance setup): In this setup, the first chamber was shortcut to the tank (green dashed-line in Figure 1). Since the second chamber and the resistance between chambers were removed in this setup, the aortic simulator had lower total volume compliance and lower resistance compared to setup 1 (the mean pressure in setup 1 and setup 2 were 104.5±3.5 mmHg and 84±2 mmHg respectively).
Setup 3: This is the setup for the reflection site experiment. It is similar to setup 1. In this setup, an extra reflection site (a ring) was placed at different locations along the aorta as illustrated in Figure 3 (The ring was just a snap grip hose and it was located outside of the aorta). This extra reflection site was used to alter the aortic wave reflection. The pressure and flow data were collected for 4 seconds and each experiment was repeated 9 times.
Figure 3. The aortic simulator for setup 3.
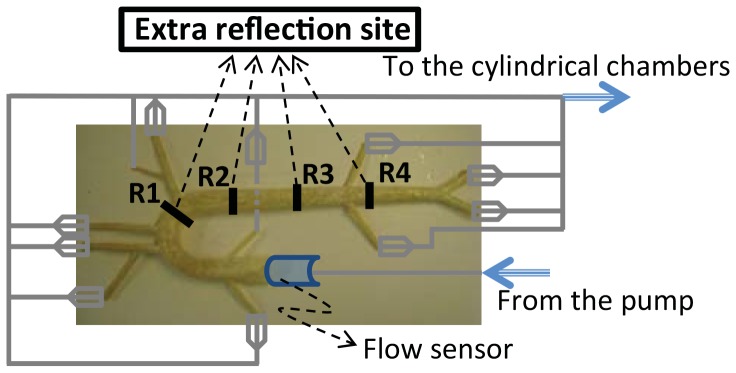
An extra reflection site (a ring) was placed at different locations along the aorta marked by numbers 1–4. They are located at approximately 15, 25, 35 and 45 cm from the aortic input.
Power calculation
The pulsatile power was calculated using equation (1):
 |
(1) |
Here, T is the period of the cardiac cycle, p(t) is the pressure, and q(t) is the flow. The pressure and flow were measured at the aortic input.
Pulsatile power-wave reflection relation
The pulsatile power can also be written as a summation of the pressure and flow harmonics[18] as
| (2) |
where  and
and  are the harmonic the pressure and flow wave, respectively, and
  and
and  are the phases of the pressure and flow, respectively.
The reflection coefficient (R) is defined as the ratio of the harmonics of the reflected pressure ( ) to the harmonics of the forward pressure (
 ) in the frequency domain as [25]
 |
(3) |
It can also be written in terms of the impedances as [25]
| (4) |
Where  is the input impedance,
  is the characteristic impedance, and “
 ” is the phase of the input impedance (
 ) of the system. Therefore,
 can be computed as
| (5) |
where  is the symbol denoting the real part of a complex function. Solving equation (4) for
  gives
gives
| (6) |
when combined with equation (4) and (5), it gives
| (7) |
In the case of an aorta where viscoelastic properties are negligible, the characteristic impedance is real (it has a negligible imaginary part) [22]. Hence, in this condition, equation (7) can be simplified as
| (8) |
Using the impedance definition, the ratio of flow and pressure are related as
| (9) |
Finally, substituting equation (8) and equation (9) into equation (2), noting the relations  and
and  , results in
 |
(10) |
where, for simplicity, we have shown only one harmonic of the series representation for pulsatile power.
To find the condition where an increase in reflection will result in a decrease of the input pulsatile power, we assumed a flow source condition for the heart (qn is constant) and considered the function (for simplicity,  and
and  ):
):
 |
(11) |
Results
Physiological Relevancy of the Aortic Simulator
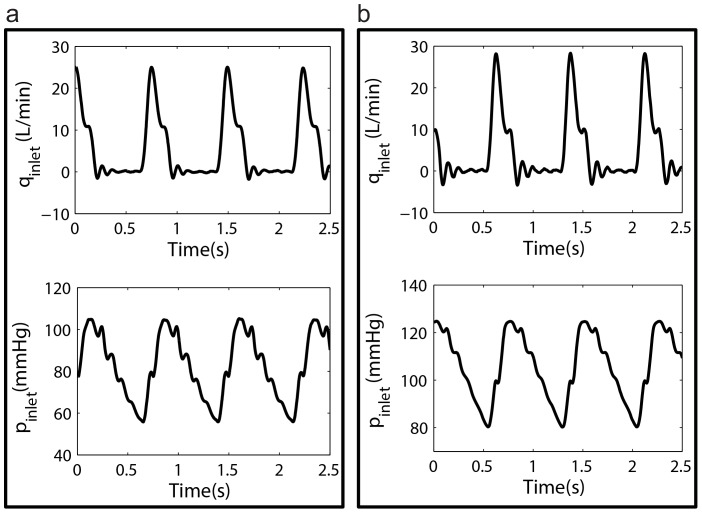
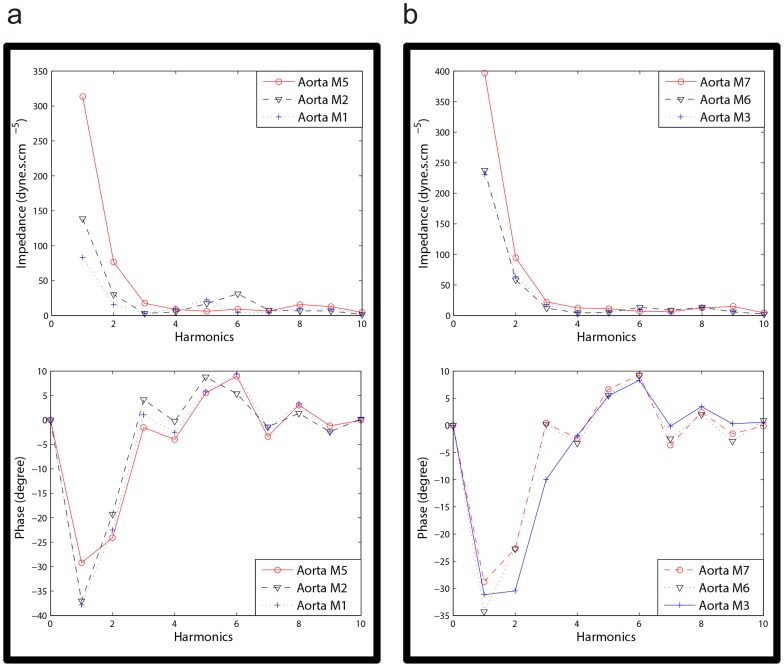
Sample measured flow and pressure waveforms from setup 2 and setup 1 are provided in Figure 4a and 4b respectively. The modulus and phase of the input impedance of the aortas under both setup2 and setup 1 are also shown in Figure 5a and Figure 5b respectively. Relevant hemodynamical parameters such as pulse pressure (PP), mean pressure (Pmean), and total compliance (TC = AC+ total VC) for all aortas are provided in Table 4. Total resistance (TR) for setup1 (TR = Δp/(Cardiac output)) is 1518.3 (dyne sec cm−5). For setup 2 the TR is 1174.3 (dyne sec cm−5). These TR values are both within physiological range, 700<TR<1600 (dyne sec cm−5) [26].
Figure 4. Samples of hemodynamic waveforms.
a) A sample of an aortic input flow wave (top) and a sample of the aortic input pressure wave (bottom) at HR = 72 bpm and CO = 5 L/min for setup 2 b). A sample of an aortic input flow wave (top) and a sample of the aortic input pressure wave (bottom) at HR = 80 bpm and CO = 5 L/min for setup 1.
Figure 5. Aortic input impedance.
a) Sample impedance modulus (top) and phase (bottom) of three aortas in setup2 computed at CO = 5 L/min and HR = 72 bpm. b) Sample impedance modulus (top) and phase (bottom) of three aortas in setup1 computed at CO = 5L/min and HR = 72 bpm.
Table 4. Hemodynamic properties of the aortic simulator.
| Aorta No. | TC1 | TC2 | PP1 | PP2 | Pmean1 | Pmean2 |
| M1 | NA | 1065×10−5 | NA | 22.0 | NA | 82.4 |
| M2 | NA | 1055×10−5 | NA | 40.0 | NA | 81.9 |
| M3 | 1543×10−5 | 1033×10−5 | 44.3 | 49.3 | 104.3 | 81.0 |
| M4 | 1559×10−5 | 1049×10−5 | 53.9 | 55.7 | 102.4 | 85.1 |
| M5 | 1541×10−5 | 1031×10−5 | 61.3 | 75.2 | 108.7 | 85.5 |
| M6 | 1541×10−5 | 1031×10−5 | 63.3 | 75.9 | 109.1 | 85.5 |
| M7 | 1533×10−5 | 1023×10−5 | 94.6 | 106 | 101.4 | 82.9 |
TC1 (cm5.dyne−1), PP1 (mmHg), and Pmean1 (mmHg), are for setup1. TC2 (cm5.dyne−1), PP2 (mmHg), and Pmean2 (mmHg), are for setup2.
Effect of Heart Rate and Aortic Rigidity on Left Ventricular Pulsatile Workload
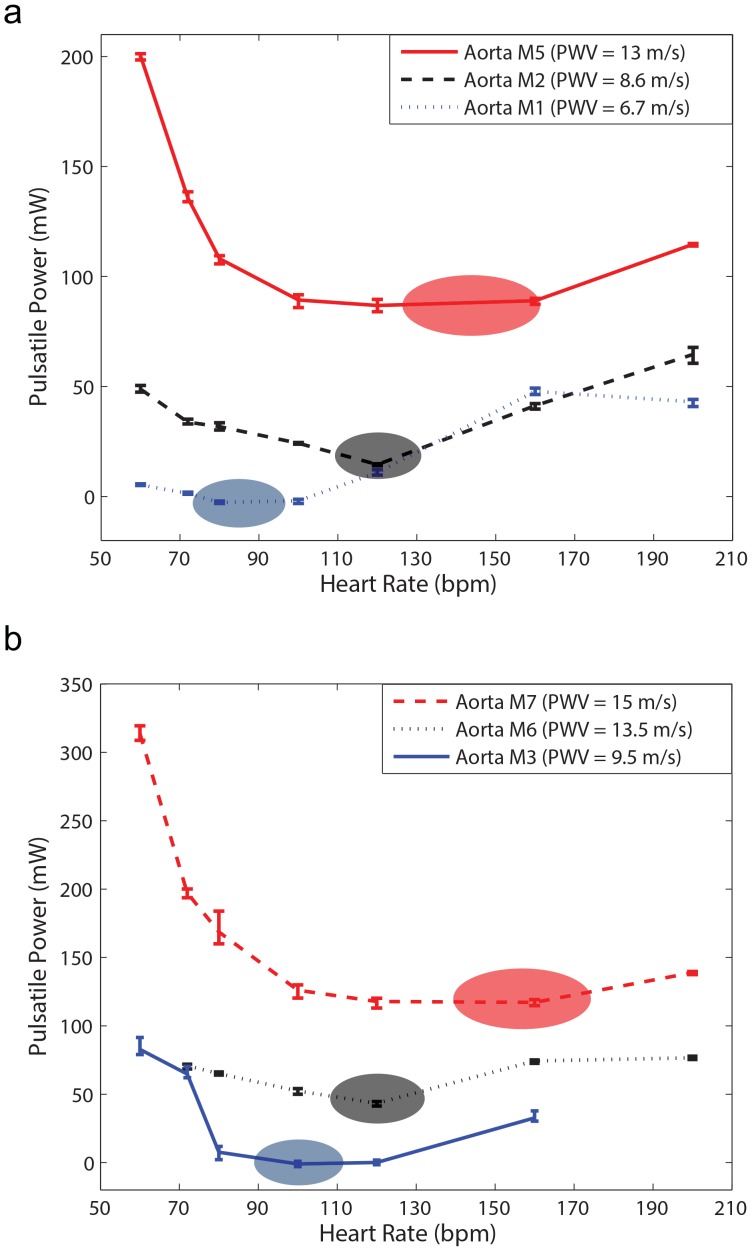
Figure 6 demonstrates the effect of aortic rigidity and heart rate (HR) on input pulsatile power. Figure 6a shows the results of setup 2 that have lower total volume compliance and higher resistance compared to setup 1 (Figure 6b). These figures show that there is an optimum HR at each level of aortic rigidity in which pulsatile external power (pulsatile workload) is minimized. The optimum HR has a higher value in more rigid aortas (Figure 6a and 6b). These results are in agreement with the results of our previous computational study[13].
Figure 6. Pulsatile power versus heart rate (HR).
a) Results of Setup2 (low TC condition) for three different aortic rigidities; CO = 5 L/min for all data points (please see supplementary data file for all other aortas). b) Results of Setup1 (high TC condition) for three different aortic rigidities; CO = 5 L/min for all data points (please see supplementary data file for all other aortas). There is an optimum HR in which pulsatile power is minimized. As the aortic rigidity increases, the optimum HR shifts to a higher value. Pulse wave velocity (PWV) is the wave speed and it is an index for aortic rigidity. Each power data point is the result of the respective experiment repeated five times.
Effect of Total Volume Compliance and Resistance on Optimum HR
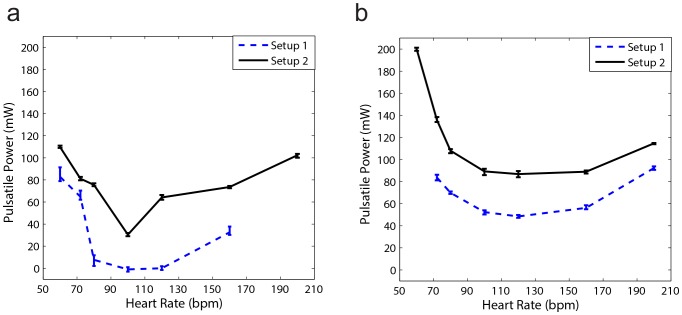
Figure 7a and 7b show the effect of total volume compliance and peripheral resistance on the optimum value of HR for two aortas with different rigidities (M3 with PWV = 9.5 m/s and M5 with PWV = 13 m/s). Although changing total resistance and total compliance alters mean and pulse pressure (as can be seen in Figure 4 and Table 4), the optimum wave condition (that results in optimum HR) does not depend on total volume compliance and total resistance as demonstrated in Figure 7. Due to the limitations of our pump, we performed the experiments at particular discrete heart rates. As a result, the exact optimum HR sometimes could not be identified.
Figure 7. The effect of total volume compliance and total resistance on optimum HR.
a) Pulsatile power versus HR for the aorta M3 with PWV = 9.5 m/s. b) Pulsatile power versus HR for the aorta M 5 with PWV = 13 m/s. Changing total resistance and total compliance affect mean, pulse pressure, and pulsatile power; however, they do not alter the optimum HR (optimum wave condition). Each power data point is the result of the respective experiment repeated five times.
Bio-inspired approach: Optimizing the Location for Reflection Sites
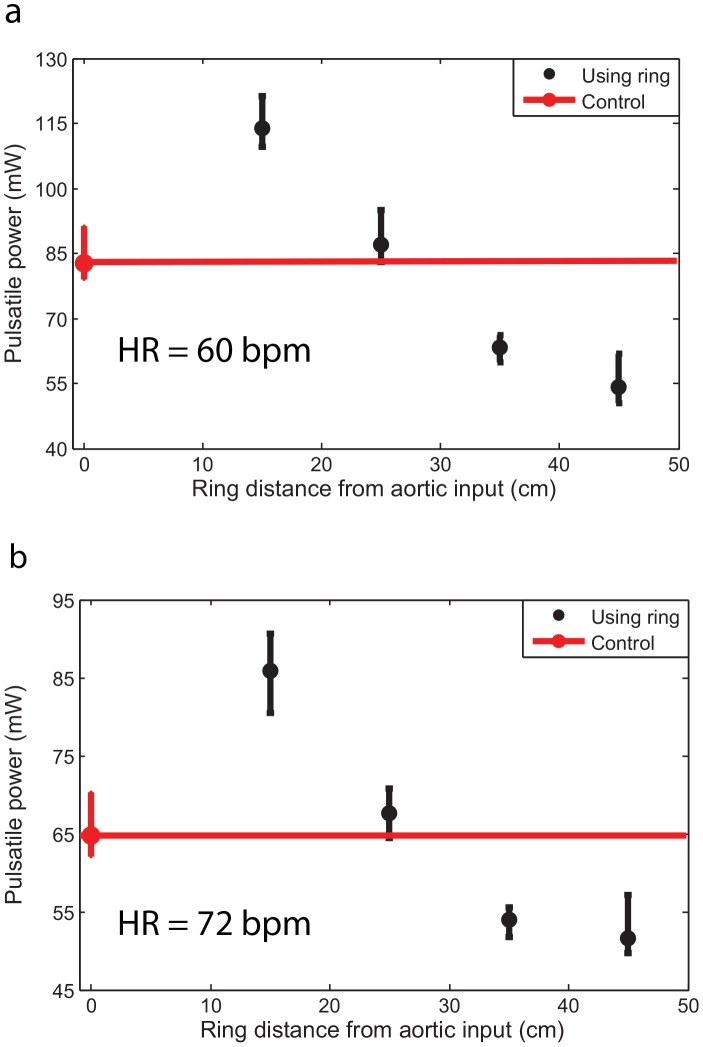
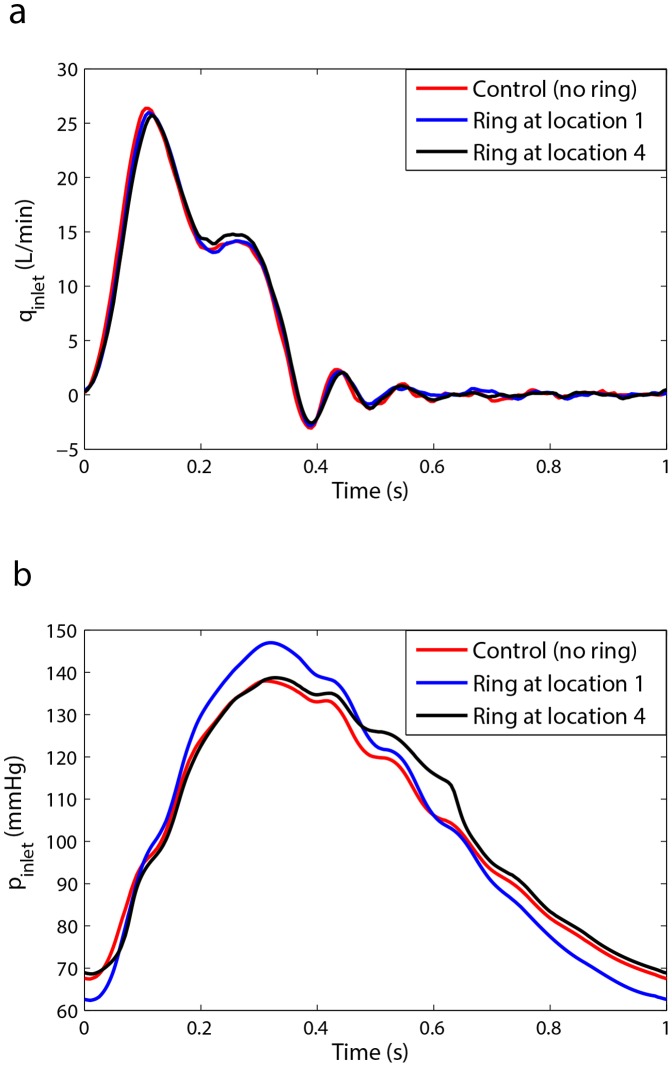
As shown in previous sections, a specific combination of the three wave parameters (HR, PWV, and location of reflection site) creates a condition in which the LV pulsatile power is minimized. In this section, we tested the hypothesis that the reflection sites can be modified to improve the effect of wave reflection. Figure 8 demonstrates that placing an extra reflection site (a ring) at a particular location along the aorta could reduce the LV pulsatile power (workload). This has been shown for two different HRs in Figure 8(a) and 8(b) where it is clear that the pulsatile power can increase (destructive wave dynamics) or decrease (constructive wave dynamics) based on the location of the new reflection site. Samples of measured flow and pressure waveforms (with and without the ring) at the aortic input location are provided in Figure 9a and 9b respectively (please see supplementary data file for all other cases). It can be observed that the changes in the flow waveforms are insignificant since our LV simulator (which is a piston-type pump) acts more like a flow source. However, the changes in the pressure wave forms are noteworthy as shown in Figure 9b.
Figure 8. The effect of an extra reflection site created by a ring on input pulsatile power (see Materials and Methods section).
(a) Results are for Aorta 3 (see Table 2) with PWV = 9.5 m/s and HR = 60 bpm. (b) Results are for Aorta 3 with PWV = 9.5 m/s and HR = 72 bpm. The control case is the aorta without an extra reflection site and the red line is the pulsatile power of the aorta without any rings (i.e. no extra reflection sites). The pulsatile power can increase or decrease compared to the control case (control is the aorta without the ring), the nature of which depends on the location of the ring. Each data point is the result of the respective experiment repeated nine times.
Figure 9. Samples of hemodynamic waveforms for ring experiment.
a) Samples of aortic input flow waves at HR = 60 bpm and CO = 5 L/min for setup 3 (ring experiment). b) Samples of aortic input pressure waves at HR = 60 bpm and CO = 5 L/min for setup 3 (ring experiment). Since our LV simulator acts more as a flow source, the alterations from control case are insignificant in flow waves. However, the alterations from the control case in pressure waves are rather significant.
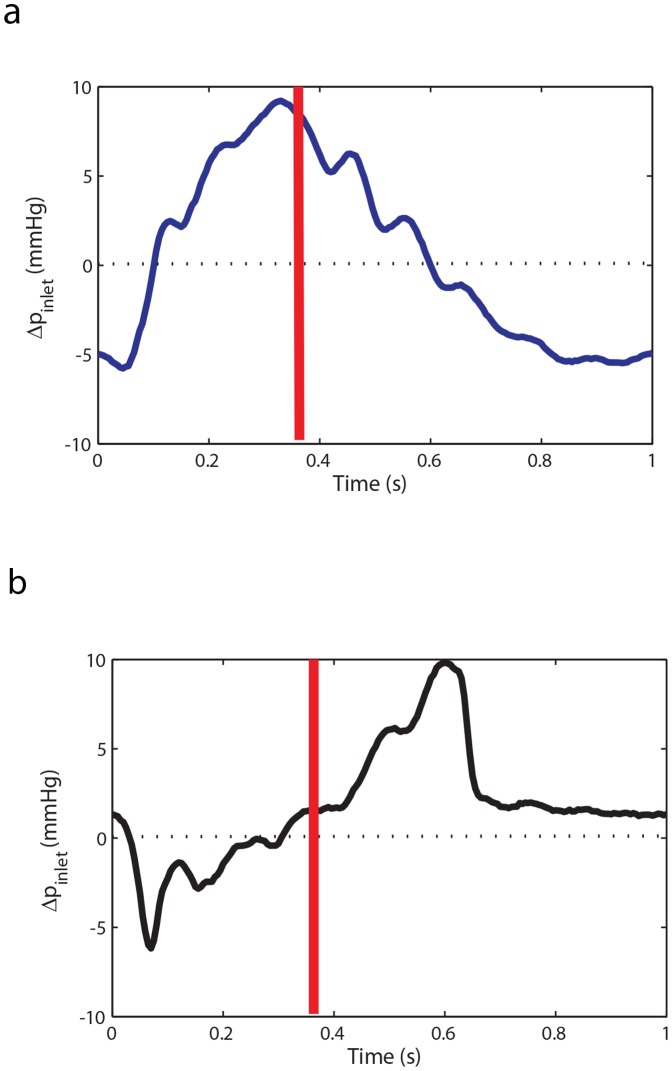
Figure 10 shows the pressure wave difference (Δp = pring −pcontrol) throughout a cardiac cycle at the aortic input. As shown in Figure 10 (a), when the ring is located at position 1, the pressure wave difference (Δpring1 = pring1−pcontrol) is mainly positive during the systolic phase, where the end of the systolic phase is marked by the red line. This excess systolic pressure increases the left ventricle pulsatile power. In contrast, when the ring is located at position 4, the pressure wave difference (Δpring4 = pring4−pcontrol) is mostly negative during the systolic phase of the cycle and as a result the left ventricle pulsatile power decreases. Interestingly, when the ring is at location 4, the diastolic pressure wave difference (excess pressure during diastole) is positive as shown in Figure 10 (b). Although this excess diastolic pressure may change in an in-vivo physiological system the presence of this excess pressure in the in-vitro experiment suggests that in certain cases the ring may also prove to be beneficial by increasing the perfusion of blood to the coronary arteries.
Figure 10. Pressure wave difference for ring experiment.
a) The input pressure wave difference of ring 1 (destructive case) from the control (Δpring1 = pring1−pcontrol) at HR = 60 bpm and CO = 5 L/min for a complete cardiac cycle. b) The input pressure wave difference of ring 4 (constructive case) from the control (Δpring4 = pring4−pcontrol) at HR = 60 bpm and CO = 5 L/min for a complete cardiac cycle.
Pulsatile power and wave reflection
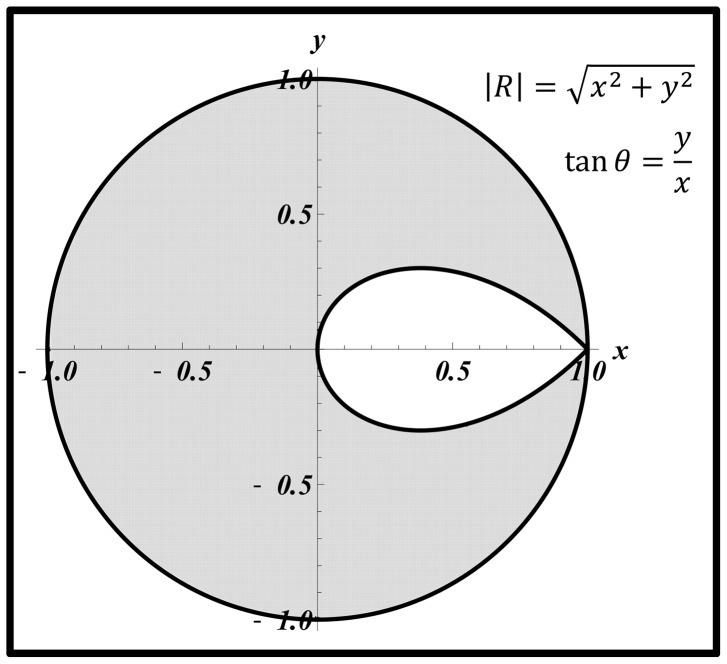
According to equation (11), the region where  corresponds to the range of
  and
and  where pulsatile power is decreasing while wave reflection is increasing. This region depends on both the magnitude of the wave reflection (
 ) and its phase (
 ), and is described as
 |
Obviously for any value of  , this condition is satisfied if
  since
since  and
and  . This means that increasing the wave reflection causes a decrease in pulsatile power when the phase falls in the second or third quadrant. In the first and fourth quadrants (where
  and
and  respectively), increasing the wave reflection can increase or decrease (depending on the magnitude and phase) the input pulsatile power. This is illustrated in Figure 11, the grey area denoting the range of
  and
and  where pulsatile power decreases by the act of increasing the wave reflection. Similar analyses have been done by Quick et al
[22]. However, our contour for the boundary between the two regions has a teardrop shape, whereas the one presented by Quick et. al. is circular [22] (we have found it necessary to show the details of our derivation in the method section since our final graph is different from the one presented by Quick et al; however, they didn’t provide the details).
Figure 11. The grey area is the region where increasing wave reflection is beneficial.
In this region, increasing wave reflection results in a decrease of the input pulsatile power ( ). In the white region, increasing wave reflection is disadvantageous and results in an elevation of the pulsatile power (
 ).
).
Discussion
Optimum Heart Rate for Left Ventricle Pulsatile Workload
Using an experimental approach, we have shown in Figure 6a and 6b that there is an optimum HR at each stage of aortic rigidity in which the LV external pulsatile power (LV pulsatile workload) is minimized. This optimum HR shifts to higher values as aortic rigidity increases. It can be concluded that the interplay between HR and wave speed (which depends on the wall rigidity) changes the optimum point. These findings confirm earlier results that were obtained from our computational study [13].
The wave dynamics in a compliant tube is mainly dominated by the frequency of excitation (HR), the wave speed, and the reflection sites as shown in previous studies [10], [11], [12]. Similarly, aortic wave dynamics is controlled by the heart rate (HR), the pulse wave velocity (PWV), and the locations of the reflection sites. The optimum aortic wave condition depends on these interrelated parameters. Figure 7a and 7b show that parameters such as total volume compliance and total resistance do not affect the optimum HR value (However, they do affect the workload on the heart). In fact, the value of the optimum HR only depends on wave dynamic parameters such as PWV (wave speed) as demonstrated in Figure 6a and 6b. As expected, the pulsatile power-HR curves shift up when total compliance decreases (Figure 7a and 7b).
A Bio-inspired Approach: Correction and Optimization of Aortic Waves
Traditionally, there was a misconception that wave reflections have only negative effects and that reducing the wave reflections is always beneficial. However, Zamir [27] proposed that wave reflections can in fact be beneficial and can even assist blood flow rather than impeding it. Not long after, Quick et al [22] showed that either increasing or decreasing wave reflection results in the elevation of pulsatile workload. Based on this observation, they have concluded that arterial wave dynamic is in optimum condition under normal physiological conditions. This inspired us to investigate if it is possible to reduce LV pulsatile workload through the correction and optimization of aortic wave dynamics. Under healthy condition, this workload accounts only for 6–12% of the total LV workload [28]. However, the pulsatile workload significantly increases under vascular disease conditions [24].
Optimization of wave reflections as a therapeutic approach was first suggested by O'Rourke [29]. We have shown in this manuscript that the introduction of properly positioned extra reflection sites in the aorta can result in a constructive wave dynamic state and a subsequent reduction of LV pulsatile workload. To test this idea, a ring (rigid reflection site) was placed at various locations along the aorta to alter the dynamics of wave reflection. Decreasing the pulsatile load in a heart failure patient is critically important [2], [3]. HF is usually accompanied by increased arterial stiffness. It is clinically impractical to increase the HR in order to reach a new optimum HR. Therefore our proposed “reflection site modification” method can potentially be used for reduction of the LV pulsatile workload for HF patients.
Figure 8a and 8b show that alteration of the wave reflection site can result in either an increase (a destructive effect) or decrease (a constructive effect) of the LV pulsatile power. The constructive and destructive effects of waves depend on the location of the ring (reflection site) since different locations cause different wave interactions. In other words, the phase of the global reflection coefficient varies with the location of the extra reflection site. To understand this phenomenon, we looked into the relation between pulsatile power and wave reflection. Our analysis depicted in Figure 11 can be used to explain the observed phenomena in Figure 8(a) and 8(b). In our experiments, when the ring was located at Position 1 (15 cm from the input, see Figure 3) the operation point of the system was in a state found in the white area (Figure 11); hence, increasing the wave reflection increased the pulsatile power. At Position 2 (25 cm from the input), the system is found to be in the boundary between the two regions of Figure 11 where the pulsatile power does not change significantly with the increased reflection. For Positions 3 and 4, the system lies in the operational region similar to the gray area where increasing wave reflection results in a decrease of pulsatile power. Under this beneficial wave condition, an extra reflection site reduces the input pulsatile power as shown in Figure 8(a) and 8(b).
Limitation
The major limitation of our study is related to the fact that an in-vitro model of the systemic arterial system was considered. In fabricating the synthetic aortas used in this study the focus was on mimicking the material-dependent parameters such as the average aortic pulse wave velocity and volume compliance. In this regard, a synthetic aorta fabricated by dip molding and composed of homogenous material properties may not be able to exactly mimic the local variations in PWV and compliance present in an in-vivo system although the average PWV and volume compliances may match. Physiologically, the human aorta consists of multiple segments with variable material compositions which would result in specific pulse wave velocity variations at different segments along its length. Therefore, the dynamics of the LV-arterial system in a true physiological situation are likely to be different from our in-vitro experimental model. This means that the optimum HR and optimum ring location in our model may not be exactly the same as the in-vivo situation.
Another limitation of our study is related to oversimplification of microvasculature in our model; however, this simplification does not change the main finding of this study since microvasculature does not influence the aortic wave dynamics. The microvascular network only contributes as a discrete reflection site and as a resistance to blood flow, and both of these effects are properly modeled in our in-vitro experiment. We also used water as a circulatory fluid in this study, but this does not affect our results since the fluid viscosity plays a negligible role in the dynamics of aortic waves[5]. Our model includes a piston pump. This assumes that heart is a flow source. The heart is neither a flow nor a pressure source, but the behavior of a normal heart is closer to a flow source [4]. Our system is not an exact duplicate of an in-vivo model, but the physiological relevancy of our aortic simulator has been shown (Tables 2–4 and Figures 3–4).
Conclusion
Using an in-vitro experimental approach we have validated what we proposed in our previous computational study [13]. We showed in this manuscript that there is an optimum heart rate at which the pulsatile workload on the left ventricle is minimized. The optimum heart rate shifts to a higher value as the aortic rigidity increases.
A simple bio-inspired concept, based on the principles of wave dynamics, was also introduced to reduce the LV workload in heart failure patients. A device based on this concept could be in the form of a ring or a band wrapped around the aorta to act as an extra reflection site that alters wave reflection. This device can be designed to be minimally invasive due to its lack of complexity. However, the effectiveness of such a device is yet to be determined and is the subject of future work.
Supporting Information
(DOC)
(ZIP)
Funding Statement
Niema M. Pahlevan acknowledges support from the American Heart Association (AHA) Predoctoral fellowship (Award Id: 12PRE9610015). The funders had no role in study design, data collection and analysis, decision to publish, or preparation of the manuscript.
References
- 1. Writing Group Members (2010) Lloyd-Jones D, Adams RJ, Brown TM, Carnethon M, et al. (2010) Heart Disease and Stroke Statistics–2010 Update: A Report From the American Heart Association. Circulation 121: e46–215. [DOI] [PubMed] [Google Scholar]
- 2. Laskey W, Kussmaul W (1987) Arterial wave reflection in heart failure. Circulation 75: 711–722. [DOI] [PubMed] [Google Scholar]
- 3. Mitchell GF, Tardif J-C, Arnold JMO, Marchiori G, O'Brien TX, et al. (2001) Pulsatile Hemodynamics in Congestive Heart Failure. Hypertension 38: 1433–1439. [DOI] [PubMed] [Google Scholar]
- 4. Westerhof N, O'Rourke MF (1995) Haemodynamic basis for the development of left ventricular failure in systolic hypertension and for its logical therapy. Journal of Hypertension 13: 943–952. [DOI] [PubMed] [Google Scholar]
- 5.Nichols WW, O'Rourke MF (1998) McDonald's Blood Flow in Arteries: Theoretical, Experimental and Clinical Principles. London: Arnold. 564 p. [Google Scholar]
- 6.Zamir M (2000) The Physics of Pulsatile Flow. New York: Springer-Verlag.
- 7. Davies JE, Whinnett ZI, Francis DP, Manisty CH, Aguado-Sierra J, et al. (2006) Evidence of a Dominant Backward-Propagating “Suction” Wave Responsible for Diastolic Coronary Filling in Humans, Attenuated in Left Ventricular Hypertrophy. Circulation 113: 1768–1778. [DOI] [PubMed] [Google Scholar]
- 8. Ishikawa J, Matsui Y, Russo C, Hyodo E, Arai K, et al. (2012) Increased aortic wave reflection and longitudinal regional diastolic dysfunction in patients with left ventricular hypertrophy. Artery Research 6: 97–102. [Google Scholar]
- 9. Manisty C, Mayet J, Tapp RJ, Parker KH, Sever P, et al. (2010) Wave Reflection Predicts Cardiovascular Events in Hypertensive Individuals Independent of Blood Pressure and Other Cardiovascular Risk Factors: An ASCOT (Anglo-Scandinavian Cardiac Outcome Trial) Substudy. Journal of the American College of Cardiology 56: 24–30. [DOI] [PubMed] [Google Scholar]
- 10. Avrahami I, Gharib M (2008) Computational studies of resonance wave pumping in compliant tubes. Journal of Fluid Mechanics 608: 139–160. [Google Scholar]
- 11. Hickerson A, Rinderknecht D, Gharib M (2005) Experimental study of the behavior of a valveless impedance pump. Experiments in Fluids 38: 534–540. [Google Scholar]
- 12. Loumes L, Avrahami I, Gharib M (2008) Resonant pumping in a multilayer impedance pump. Physics of Fluids 20: 023103. [Google Scholar]
- 13. Pahlevan NM, Gharib M (2011) Aortic Wave Dynamics and Its Influence on Left Ventricular Workload. PLoS ONE 6: e23106. [DOI] [PMC free article] [PubMed] [Google Scholar]
- 14.Attinger EO, editor (1964) Pulsatile Blood Flow: McGraw-Hill.
- 15. Elzinga G, Westerhof N (1991) Matching between ventricle and arterial load. An evolutionary process. Circ Res 68: 1495–1500. [DOI] [PubMed] [Google Scholar]
- 16.Knight GEW, Wolstenholme J (1971) Circulatory and Respiratory Mass Transport: Ciba Foundation.
- 17. Milnor WR (1979) Aortic wavelength as a determinant of the relation between heart rate and body size in mammals. Am J Physiol Regul Integr Comp Physiol 237: R3–6. [DOI] [PubMed] [Google Scholar]
- 18.Milnor WR (1989) Haemodynamics. Baltimore, Md: Williams & Wilkins Co.
- 19. O'Rourke M, Yaginuma T, Avolio A (1984) Physiological and pathophysiological implications of ventricular/vascular coupling. Annals of Biomedical Engineering 12: 119–134. [DOI] [PubMed] [Google Scholar]
- 20. Li JK, Noordergraaf A (1991) Similar pressure pulse propagation and reflection characteristics in aortas of mammals. American Journal of Physiology - Regulatory, Integrative and Comparative Physiology 261: R519–R521. [DOI] [PubMed] [Google Scholar]
- 21. Westerhof N, Elzinga G (1991) Normalized input impedance and arterial decay time over heart period are independent of animal size. American Journal of Physiology - Regulatory, Integrative and Comparative Physiology 261: R126–R133. [DOI] [PubMed] [Google Scholar]
- 22. Quick CM, Berger DS, Noordergraaf A (2001) Constructive and destructive addition of forward and reflected arterial pulse waves. American Journal of Physiology - Heart and Circulatory Physiology 280: H1519–H1527. [DOI] [PubMed] [Google Scholar]
- 23.Westerhof N, Stergiopulos N, Noble MIM (2005) Snapshots of Hemodynamics: An aid for clinical research and graduate education: Springer.
- 24.Safar M, O'Rourke MF (2006) Arterial Stiffness in Hypertension: Elsevier.
- 25.Li JK-J (2004) Dynamics of the Vascular System: World Scientific Pub Co Inc.
- 26.Klingensmith ME (2008) The Washington manual of surgery: Wolters Kluwer Health.
- 27. Zamir M (1998) Mechanics of blood supply to the heart: wave reflection effects in a right coronary artery. Proceedings of the Royal Society of London Series B: Biological Sciences 265: 439–444. [DOI] [PMC free article] [PubMed] [Google Scholar]
- 28. O'Rourke MF (1967) Steady and Pulsatile Energy Losses in the Systemic Circulation under Normal Conditions and in Simulated Arterial Disease. Cardiovascular Research 1: 313–326. [DOI] [PubMed] [Google Scholar]
- 29. O'Rourke MF (1996) Toward Optimization of Wave Reflection: Therapeutic Goal for Tomorrow? Clinical and Experimental Pharmacology and Physiology 23: s11–s15. [DOI] [PubMed] [Google Scholar]
- 30. O'Rourke MF, Hashimoto J (2007) Mechanical Factors in Arterial Aging: A Clinical Perspective. J Am Coll Cardiol 50: 1–13. [DOI] [PubMed] [Google Scholar]
- 31. Liu Z, Ting C-T, Zhu S, Yin F (1989) Aortic compliance in human hypertension. Hypertension 14: 129–136. [DOI] [PubMed] [Google Scholar]
- 32. Murgo J, Westerhof N, Giolma J, Altobelli S (1980) Aortic input impedance in normal man: relationship to pressure wave forms. Circulation 62: 105–116. [DOI] [PubMed] [Google Scholar]
Associated Data
This section collects any data citations, data availability statements, or supplementary materials included in this article.
Supplementary Materials
(DOC)
(ZIP)


