

Abstract
Sound-evoked vestibular myogenic potentials recorded from the sternocleidomastoid muscles (the cervical vestibular-evoked myogenic potential or cVEMP) and the extraocular muscles (the ocular VEMP or oVEMP) have proven useful in clinical assessment of vestibular function. VEMPs are commonly interpreted as a test of saccular function, based on neurophysiological evidence showing activation of saccular afferents by intense acoustic click stimuli. However, recent neurophysiological studies suggest that the clicks used in clinical VEMP tests activate vestibular end organs other than the saccule. To provide the neural basis for interpreting clinical VEMP testing results, the present study examined the extent to which air-conducted clicks differentially activate the various vestibular end organs at several intensities and durations in Sprague–Dawley rats. Single unit recordings were made from 562 vestibular afferents that innervated the otoliths [inferior branch otolith (IO) and superior branch otolith (SO)], the anterior canal (AC), the horizontal canal (HC), and the posterior canal (PC). Clicks higher than 60 dB SL (re-auditory brainstem response threshold) activated both semicircular canal and otolith organ afferents. Clicks at or below 60 dB SL, however, activated only otolith organ afferents. Longer duration clicks evoked larger responses in AC, HC, and SO afferents, but not in IO afferents. Intra-axonal recording and labeling confirmed that sound sensitive vestibular afferents innervated the horizontal and anterior canal cristae as well as the saccular and utricular maculae. Interestingly, all sound sensitive afferents are calyx-bearing fibers. These results demonstrate stimulus-dependent acoustic activation of both semicircular canals and otolith organs, and suggest that sound activation of vestibular end organs other than the saccule should not be ruled out when designing and interpreting clinical VEMP tests.
Keywords: vestibular, sound, VEMP, single unit recording, rat, saccule, semicircular canal
Introduction
Inner ear vestibular end organs are exquisitely sensitive to head rotation, translation, and changes with respect to gravity. In addition, they also respond to loud acoustic waves presented in the ear canal or bone-conducted vibrations. Acoustic activation of the vestibular system is not only acute in pathological conditions where the bony canal is compromised by fenestration or by canal dehiscence (Tullio 1929; Minor et al. 1998), but also it is present in healthy human subjects (Parker et al. 1978) and in animals with intact labyrinths (Young et al. 1977, in squirrel monkeys; Wit et al. 1984, in pigeons; McCue and Guinan 1994a,b, 1995, 1997, in cats; Murofushi et al. 1995; Murofushi and Curthoys 1997; Curthoys et al. 2006; Curthoys and Vulovic 2011; Curthoys et al. 2012, in guinea pig; Carey et al. 2004, in chinchilla; Zhu et al. 2011a,b, in rats). The acoustic sensitivity of vestibular labyrinth and concomitant compensatory vestibular reflexes have been exploited clinically to test vestibular function. Built upon the work of Bickford et al. (1964), Colebatch and Halmagyi (1992) introduced a new test of human vestibular function by averaging acoustic click-evoked electromyographic potentials from the tonically contracted sternocleidomastoid muscles (SCMs), i.e., the vestibular-evoked myogenic potential (cervical VEMP or cVEMP). Sound-evoked vestibular myogenic potentials are also recorded from the extraocular muscles (the ocular VEMP or oVEMP). VEMP can test each labyrinth separately. Unlike other vestibular testing methods, it is better tolerated, technically simpler, and can be done with equipment readily available in audiology clinics and does not require an expensive rotary chair or eye tracking system. Because of these features, VEMP testing is now an important part of the neuro-otological test battery. Investigators worldwide have used VEMP testing to characterize a variety of vestibulopathies, including superior canal dehiscence (SCD), vestibular neuritis, Ménière's disease, and vestibular schwannoma (Minor et al. 1998, 2001; for reviews, Colebatch 2001; Streubel et al. 2001; Zhou and Cox 2004; Halmagyi et al. 2005; Welgampola and Colebatch 2005; Rauch 2006; Rosengren et al. 2010; Colebatch 2010; Welgampola and Carey 2010; Goldberg et al. 2012).
The cVEMP is mediated by the vestibulo-collic reflex pathways, which connect vestibular receptors to neck motoneurons (for reviews, Wilson and Schor 1999; Uchino et al. 2005; Uchino and Kushiro 2011). Afferents from the three semicircular canals and the two otoliths project to the vestibular neurons that induce inhibitory postsynaptic potentials in the ipsilateral SCM motoneurons, whereas afferents from the semicircular canals and the utricle project to the vestibular neurons that induce excitatory postsynaptic potentials in the contralateral SCM motoneurons. Consistent with the anatomical studies, intramuscular recordings showed that loud clicks induced an inhibition in the ipsilateral SCM motoneurons (Colebatch et al. 1994; Colebatch and Rothwell 2004), which is believed to mediate the p13-n23 VEMP responses in the ipsilateral SCM. Because loud sound stimuli used in clinical VEMP testing are believed to primarily activate the saccule but not the semicircular canals (Murofushi et al. 1995; Murofushi and Curthoys 1997; Curthoys et al. 2006, 2012; for review, Curthoys 2010), the ipsilateral p13-n23 response is assumed to be of saccular origin. However, there is evidence suggesting that sound also activates other vestibular organs (for review, Goldberg et al. 2012). Neurophysiology studies by Young et al. (1977) and Carey et al. (2004) demonstrated that long-duration tones activate vestibular afferents that innervate the semicircular canal afferents and the otolith afferents in animals with intact labyrinth. Recently, we showed in rats that clicks or tone bursts used in clinical VEMP testing activate vestibular afferents innervating both the semicircular canals and the otoliths (Zhu et al. 2011a,b). These data call into question which vestibular end organs are responsible for the VEMP generated under various experimental and clinical conditions. The present study further quantitatively measured the input–output functions of vestibular afferents to air-conducted clicks with varying intensities and durations. We show that acoustic clicks activated both the semicircular canal afferents and the otolith organ afferents, and the extent to which different organs were activated was stimulus dependent. The results question the prevailing assumption that sound used in VEMP test solely activates the saccule and call for reinterpretation of the human VEMP test. In addition, the results provide the neural basis for developing more discriminating sound-evoked vestibular tests and interpretative guidelines.
Methods
Animals
Adult male Sprague–Dawley rats weighing 250–350 g (Harlan Sprague–Dawley, Indianapolis, IN, USA) were used in this study. All procedures were approved by the Institutional Animal Care and Use Committee at University of Mississippi Medical Center.
Surgery and extracellular single unit recording procedures
All surgical procedures were performed aseptically as described before (Zhu et al. 2011a). Briefly, each rat was implanted with a small head holder on the skull and was allowed for 7 days to recovery before vestibular nerve recording/labeling. The rat was anesthetized by sodium pentobarbital (50 mg/kg, i.p.) and maintained by injection of a dose of 5 mg/kg as needed. The head was stabilized on a stereotaxic frame (David Kopf Instruments, Tujunga, CA, USA). The animals' core body temperature was monitored and maintained at 36–37 °C with a heating pad (Frederick Haer & Company, Bowdoinham, ME, USA). After opening the left side occipital bone, the cerebellar hemisphere including the flocculus/paraflocculus was removed to allow access of the 8th nerve by a microelectrode filled with 3 M NaCl (10–20 MΩ) (Sutter Instruments, Novato, CA, USA). Extracellular recording was obtained using a MNAP system (Plexon Inc., Dallas, TX, USA). Every encountered nerve fiber that was spontaneously active was isolated and tested. First, at least 30-s background discharge activity was recorded for calculating the regularity of the afferent. Then, the afferent's responses to head rotations and acoustic clicks were recorded.
Sound stimulation
The clicks were generated by a MA3 stereo microphone amplifier (DT system, Tucker-Davis Technologies, Alachua, FL, USA) and were delivered via an insert ear phone (ER-3A) (Zhu et al. 2011a). The intensity of sound stimuli is referred to the threshold of the auditory brainstem response (ABR) of individual animals, which was determined using stainless steel subdermal needle electrodes placed at the vertex (active), behind the stimulated ear (reference), and in the hind leg (ground) (Simpson et al. 1985). ABR stimulus was a 0.1-ms click of alternating polarity. Signals were amplified, filtered, and digitized at 20 kHz over a 15-ms epoch (ICS Chartr EP 200 evoked potential assessment device, GN Otometrics, Taastrup, Denmark). To eliminate the effects of a possible conductive hearing loss, animals with elevated thresholds were excluded.
Air-conducted rarefaction clicks with several intensities (50, 60, 70, and 80 dB SL re-ABR threshold) and durations (0.1, 0.3, 0.5, and 1 ms) were delivered randomly at 5 Hz to the ear ipsilateral to the recording site. Typically, 150 trials were obtained for each condition. The click parameters are comparable to that used in the studies of Murofushi et al. (1995) (0.1 ms, 60–80 dB SL re-ABR threshold) and Murofushi and Curthoys (1997) (0.1 ms, 60–90 dB SL re-ABR threshold). They are also comparable to the stimuli used in clinical VEMP testing (for review, Colebatch 2010; Rosengren et al. 2010).
Vestibular afferent characterization
A custom-made rotation device was employed to deliver head rotations in pitch, roll, and yaw planes. First, each canal was brought into the plane of earth-horizontal rotation and whether an isolated afferent's firing rate was modulated by sinusoidal earth-horizontal rotations was tested. Second, whether the afferent's firing rate was modulated by sinusoidal pitch rotations (dynamic vertical head tilt) was tested. The rotational stimuli were ~1 Hz with amplitude of ~10 ° and peak velocity of ~60 °/s. Based on established criteria (Estes et al. 1975; Daunicht and Pellionisz 1987; Blanks and Torigoe 1989; Goldberg and Fernandez 1975; Young et al. 1977), vestibular afferents were classified as horizontal canal afferents (HC), anterior canal afferents (AC), posterior canal afferents (PC), superior branch otolith organ afferents (SO), and inferior branch otolith organ afferents (IO). While IO afferents were saccular afferents, SO afferents consisted of both saccular and utricular afferents. In the present study, we did not classify SO afferents into saccular afferents and utricular afferents.
Intra-axonal recording/labeling
The procedure was adopted from Boyle et al. (1991), Baird et al. (1988), and Holstein et al. (2004). A glass micropipettes was filled with 2 % neurobiotin (Vector Laboratories, Burlingame, CA, USA) in 0.5 M KCl and 0.05 M Tris buffer (pH = 7.2), had DC impedance of 50–100 mΩ and was positioned over the superior vestibular nerve under visual control with the assistance of the surgical microscope. Axonal penetration was signaled by −20- to −60-mV resting potentials that stabilized after several seconds. Once stable intra-axonal recording was obtained, the afferent's sensitivity to air-conducted clicks was determined. Then, the afferent was labeled by passing positive current pulses of ~20 nA (1/s, 50 % duty cycle) for 2–10 min directly through the bridged electrode. The DC membrane potential and neuronal activity were monitored throughout the procedure using an intracellular recording amplifier (Biomedical Engineering, NY, USA). Current injection was terminated if the membrane potential fell to less than −10 mV. Parameters of injection (time, current, and DC resting potentials) were recorded to aid later reconstruction. After perfusion with saline followed by 4 % paraformaldehyde, the intact cristae and maculae were removed and neurobiotin labeling was demonstrated by treatment with fluorescent streptavidin conjugate (Alexa Fluor® 488 or 647, Molecular Probes, Inc., Eugene, OR, USA). Whole mounts of cristae and maculae were examined with a multiphoton laser scanning microscope.
Data acquisition and data analysis
Extracellular and intracellular voltage signals were sampled by a CED Power 1401 system (Cambridge Electronics Devices, Cambridge, UK) at 20 kHz with 16-bit resolution and a temporal resolution of 0.01 ms. Signals of horizontal and vertical head positions and click trigger were sampled at 1 kHz. Offline data analysis was performed on PC workstations using Spike 2 (Cambridge Electronics Devices, Cambridge, UK), MatLab (The MathWorks, Inc., Natick, MA, USA) and SigmaPlot (SigmaPlot Software Inc., CA, USA).
Regularity of vestibular afferents were determined by calculating their normalized coefficient of variation of interspike intervals, i.e., CV*s using parameters in Lasker et al. (2008, mouse). An irregular afferent is defined if it's CV* was >0.2 (Young et al. 1977; Goldberg et al. 1984). To quantify an afferent's response to head rotations, the fundamental response was extracted from the averaged data using a fast Fourier transform analysis. Gains and phases relative to head velocity were calculated at the fundamental stimulus frequency (~1 Hz). In the present study, the exact canal sensitivity plane was not determined. Instead, the canal sensitivities were corrected trigonometrically according to the formula described in Hullar and Minor (1999).
Vestibular afferent sound sensitivity was quantified by computing the cumulative probability of evoking a spike (CPE) (Broussard and Lisberger 1992; Broussard et al. 1995; Zhu et al. 2011a). First, we measured the latency of the first action potential after a click for 150 clicks. Second, the latencies were arranged in ascending order and paired with a number indicating probability of firing ranging from 1/150 to 1.0 in equal increments. Third, the probability of firing was plotted as a function of the latency (“click”, Fig. 1C, left panels). To remove the effect of spontaneous firing, the same plot was made for 30 ms before click onset (“no-click”, Fig. 1C, left panels). Fourth, the probability of evoking a spike was calculated by subtracted the Y value of the linear regression line of the “no-click” data (Fig. 1C, right panels). The onset of the abrupt increase in firing probability was measured as the response latency (Fig. 1C, right panels, gray arrows), the height of the rapid change in firing probability was measured as the response amplitude [difference between the peak probability (black arrows) and the baseline probability (gray arrows)], and the duration of the rapid change in firing probability was measured as the response duration. We classified an afferent as a sound sensitive unit if it has a CPE amplitude larger than 0.1.
FIG. 1.
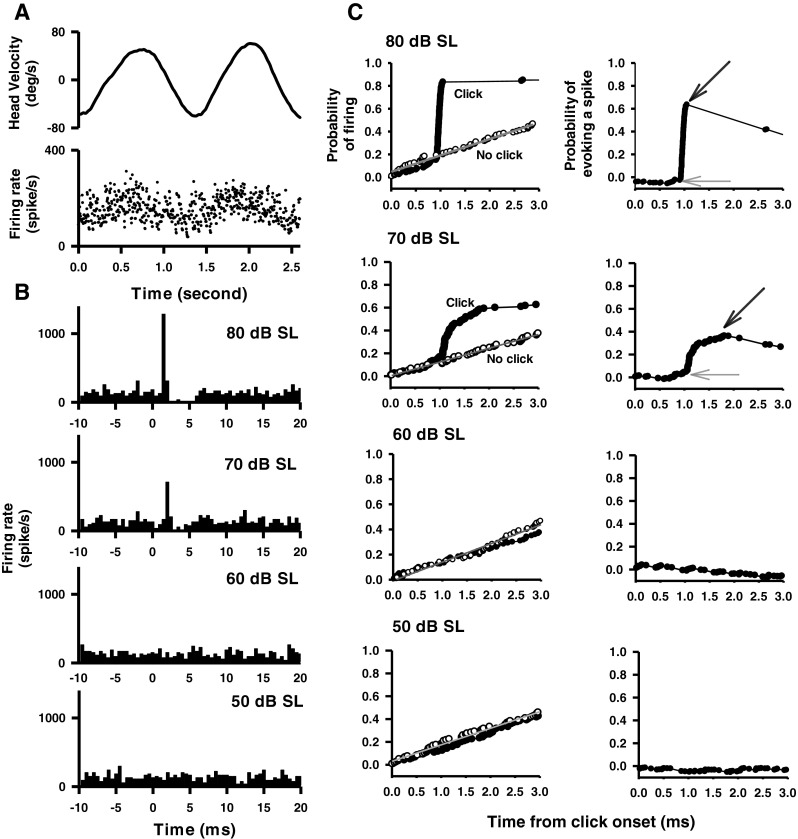
A representative anterior canal (AC) afferent's responses to clicks (0.1 ms, rarefaction, 50–80 dB SL, 0 dB is referred to the ABR threshold) delivered to the ipsilateral ear. A Top trace Head velocity. Bottom trace Instantaneous firing rate of the afferent in response to horizontal rotation. B Peristimulus time histograms of sound-evoked responses to different intensities of clicks (bin size, 0.5 ms). C Quantitative measurement of the time course of the click-evoked excitatory response. Left panels Probability of firing. Curves labeled “click” (filled symbols) plot probability of firing as a function of time after click onset. Curves labeled “no click” (open symbols) plot probability of firing as a function of time during spontaneous activity. Right panels Probability of evoking a spike as a function of time, obtained by subtracting the regression line of the “no click” condition from the data in the “click” condition. Amplitude of evoked response is defined by CPE, which is estimated as peak probability (black arrows) minus the baseline probability (gray arrows). Latency of click-evoked response is defined as the onset of the sharp increase in firing probability (gray arrows).
Results
Since our previous study showed that fewer than 5 % of regular and intermediate afferents were activated by short clicks (Zhu et al. 2011a), the present study focused on sound responses of irregular vestibular afferents. We examined the click-evoked responses of 562 irregular vestibular afferents from 83 rats: 180 innervated the anterior canal (AC), 89 innervated the horizontal canal (HC), 72 innervated the posterior canal (PC), 108 innervated the otoliths in the superior branch of the vestibular nerve (SO), and 113 innervated the saccule in the inferior branch of the vestibular nerve (IO).
Effects of intensity on click-evoked responses of vestibular afferents
Effects of click intensity (50, 60, 70, and 80 dB SL re-ABR threshold, rarefaction, and 0.1 ms duration) were studied in 492 irregular afferents: 154 innervated the AC, 72 innervated the HC, 72 innervated the PC, 88 innervated the SO, and 106 innervated IO. Figure 1 shows typical responses of an irregular AC afferent to clicks with different intensities. This afferent increased its firing rate to contralateral head rotation (~1 Hz) with a gain of 0.33 spikes/s/degree/s and a phase lead of 27.3 ° with respect to the contralateral head velocity (Fig. 1A). The peristimulus histograms exhibit short-latency excitatory responses to clicks of 70 dB SL and 80 dB SL, but not to clicks of 50 dB SL and 60 dB SL (Fig. 1B). CPEs were computed to measure the latencies and amplitudes of the click-evoked responses (Fig. 1C). This AC afferent has latencies of 1.05 and 0.75 ms for clicks at 70 and 80 dB SL, respectively (Fig. 1C, the onset of sharp increase in firing probability is indicated by gray arrows). It has amplitudes of 0.30 and 0.66 for clicks at 70 and 80 dB SL, respectively, which were estimated as the difference between the peak probability (black arrow) and the baseline probability (gray arrow).
CPE amplitudes of the vestibular afferents from various end organs are plotted as a function of CV* for different sound intensities (Fig. 2). Mean CPE amplitudes of different end organs at different intensities are shown in Figure 3A. A two-way ANOVA revealed significant effects of click intensity (F3, 1,967 = 246.05, P < 0.001) and end organs (F4, 1,967 = 144.41, P < 0.001) as well as a significant interaction between the two factors (F12, 1,967 = 29.43, P < 0.001). Post hoc analysis (Student–Newman–Keuls) revealed that all end organs except PC showed larger responses with higher intensities of stimulation (P < 0.001). At intensity levels higher than 50 dB SL, the CPEs showed significant differences among afferents from different end organs. At 80 and 70 dB SL, the IO afferents had larger CPEs than the SO afferents (80 dB: T = 4.45, P < 0.001; 70 dB: T = 5.91, P < 0.001), the AC afferents (80 dB: T = 12.54, P < 0.001; 70 dB: T = 15.18, P < 0.001), the HC afferents (80 dB: T = 16.40, P < 0.001; 70 dB: T = 14.12, P < 0.001), and the PC afferents (80 dB: T = 18.94, P < 0.001; 70 dB: T = 15.18, P < 0.001). At 60 dB SL, the SO and IO afferents had similar CPEs (T = 0.41, P = 0.99), but they had larger CPEs than the canal afferents (AC: T = 4.23, P < 0.001; HC: T = 3.31, P < 0.005; PC: T = 3.64, P < 0.002). At 50 dB SL, none of the five end organs showed significant sound-evoked responses. Among the canal afferents, the AC afferents were more sensitive to clicks than the HC afferents (T = 6.64, P < 0.001) and the PC afferents (T = 9.18, P < 0.001) at 80 dB SL, and the PC afferents at 70 dB SL (T = 2.83, P < 0.02), but AC afferents were not different from HC and PC afferents at 50 and 60 dB SL. Thus, these results established the order of click sensitivity for vestibular end organs as IO > SO > AC > HC > PC.
FIG. 2.
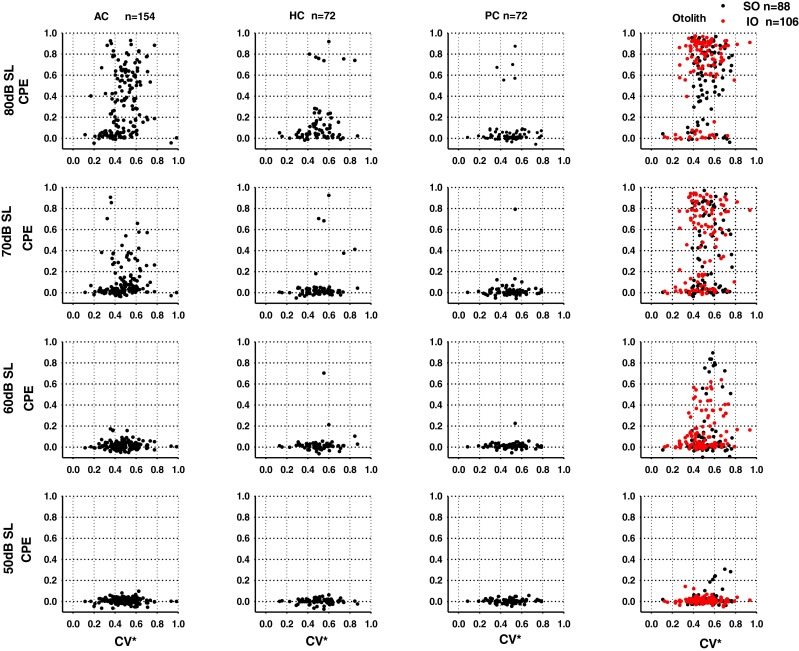
Relationship between discharge regularity and click sensitivity at different intensity levels. Response amplitude (CPE) is plotted as a function of CV*. Each symbol shows the response of one neuron. AC Anterior canal units, HC horizontal canal units, PC posterior canal units, SO otolith units in the superior branch, IO otolith units in the inferior branch.
FIG. 3.

A Averaged response amplitude (CPE) at different click intensities (50–80 dB SL, re-ABR threshold, 0.1 ms, rarefaction). Both sound sensitive and nonsensitive afferents are included in the average. B Percentage of sound sensitive afferents (CPE > 0.1) as a function of click intensity. AC Anterior canal units, HC horizontal canal units, PC posterior canal units, SO otolith units in the superior branch, IO otolith units in the inferior branch.
Effects of click intensity on vestibular afferent responses were also assessed by the percentage of sound sensitive units for each end vestibular end organ (CPE > 0.1) (Fig. 3B). The percentage of sound sensitive AC afferents was minimal at intensities of 60 and 50 dB, but it rose to 66.2 % at 80 dB SL, which was significantly smaller than that of the IO (81.1 %) afferents (chi-square, χ2 = 6.24, P < 0.05) but was not different from that of the SO (78.4 %) afferents (chi-square, χ2 = 3.44, P = 0.064). The percentage of sound sensitive HC afferents was minimal at intensities below 70 dB SL and rose to 37.5 % at 80 dB SL. Only 6.9 % of PC afferents was activated at 80 dB SL.
The averaged peristimulus histograms of the sound sensitive units (CPE > 0.1 at 80 dB SL) were compiled to compare the population responses of various end organs at different click intensities (Fig. 4). Consistent with the above analysis based on CPE, sound sensitive otolith afferents exhibited larger responses than AC and HC canal afferents. While clicks evoked larger responses in the IO and SO afferents (IO: 824.1, 669.9, and 259.4 spike/s at 80, 70, and 60 dB SL, respectively; SO: 715.8, 468.0, and 266.1 spike/s at 80, 70, and 60 dB SL, respectively), clicks also evoked significant responses in the AC and HC afferents (AC: 549.3 and 226.9 spike/s at 80 and 70 dB SL, respectively; HC: 382.4 and 223.4 spike/s at 80 and 70 dB SL, respectively). There were no canal responses for clicks at 60 dB SL and lower.
FIG. 4.

Averaged peristimulus histograms of sound-sensitive vestibular afferents (CPE > 0.1 at 80 dB SL) at several click intensities. Rarefaction clicks of 0.1 ms duration at 50–80 dB SL (bin size, 1 ms).
The relationship between CV* and CPE was examined by performing correlation analysis for each end organ. For the IO afferents, CPEs were significantly correlated with CV* at 80 dB SL (R = 0.29, P = 0.003), 70 dB SL (R = 0.22, P = 0.022) and 60 dB SL (R = 0.21, P = 0.028). For AC afferents, CPE was significantly correlated with CV* only at 80 dB (R = 0.236, P = 0.003). There were no significant correlations between CV* and CPE for the SO, HC, and PC afferents.
Latency and duration of click-evoked responses
Figure 5A summarizes the averaged latencies of afferents innervating various end organs. A two-way ANOVA revealed significant effects of intensity (F3, 541 = 14.16, P < 0.001) and end organs (F4, 541 = 29.54, P < 0.001) on latency but no significant interaction between the two factors. Post hoc analysis showed latencies at high intensities were shorter than those at low intensities, i.e., 80 < 70 < 60 < 50 dB (Student–Newman–Keuls, P < 0.05). Latencies were different among afferents innervating different end organs. While latencies were not significantly different among the otolith afferents (SO: 0.69 ± 0.02 ms; IO: 0.69 ± 0.02 ms, P > 0.05) and among the canal afferents (AC: 0.91 ± 0.03 ms; HC: 0.83 ± 0.04 ms; PC: 0.78 ± 0.07 ms; P > 0.05), the otolith afferents had shorter latencies than the AC and HC afferents (P < 0.001). Latencies of the five sound sensitive PC units were neither different from those of otolith afferents nor those of the other canal afferents.
FIG. 5.

Effects of click intensity on response latency and duration. A Averaged latency at different intensity levels. B Averaged duration at different intensity levels. AC Anterior canal units, HC horizontal canal units, PC posterior canal units, SO otolith units in the superior branch, IO otolith units in the inferior branch.
The relationship between latency and CPE was examined by correlation analysis for sound-sensitive afferents. For the SO, IO, and AC afferents, CPEs were significantly inversely correlated with latency, i.e., the larger the response, the shorter the latency. For otolith afferents, significant correlations between latency and CPE were found at intensity levels of 80 dB SL (SO: R = 0.51, P < 0.001; IO: R = 0.31, P < 0.005), 70 dB SL (SO: R = 0.59, P < 0.001; IO: R = 0.40, P < 0.001), and 60 dB SL (SO: R = 0.70, P < 0.001; IO: R = 0.40, P < 0.005). For AC afferents, however, significant correlation was only found at 80 dB SL (R = 0.33, P < 0.001). No significant correlation was found for HC and PC afferents.
Averaged durations of click-evoked responses of various end organs are shown in Figure 5B. A two-way ANOVA revealed significant effects of click intensity (F3, 541 = 14.95, P < 0.001) and end organs (F4, 541 = 15.06, P < 0.001) but no significant interaction between the two factors. Post hoc analysis showed that the durations of afferent responses were shorter at higher intensities (80 <70 < 60 dB, Student–Newman–Keuls, P < 0.05). The durations of the otolith afferent responses were significantly shorter than those of AC (P < 0.001) and HC (P < 0.001) afferents. There were no significant differences between SO and IO afferents, but the durations of the HC afferent responses were significantly longer than those of AC afferent responses (P < 0.05), i.e., IO = SO < AC < HC. The durations of the five PC afferent responses were not significantly different from other afferents.
Effects of click duration on click-evoked responses of vestibular afferents
Effects of click duration (0.1, 0.3, 0.5, and 1 ms) on click-evoked vestibular afferent responses (80 dB SL, rarefaction) were examined in 70 sound sensitive irregular afferents: 26 from AC, 17 from HC, 20 from SO, and 7 from IO (Fig. 6). One-way ANOVA analysis revealed that click durations had significant effects on responses of AC afferents (F3, 103 = 24.93, P < 0.001), HC afferents (F3, 67 = 4.37, P = 0.009), SO afferents (F3, 79 = 5.53, P = 0.002), but not on that of IO afferents (F3, 27 = 2.24, P = 0.12). For AC afferents, longer durations (0.3, 0.5, and 1 ms) clicks evoked larger CPE amplitudes than those of 0.1-ms clicks (Student–Newman–Keuls, T = 8.50, P < 0.001; T = 4.04, P < 0.001 and T = 2.89, P < 0.01). For SO afferents, 0.3- and 0.5-ms clicks evoked larger responses than those of 0.1-ms clicks (T = 3.82, P < 0.005; T = 3.10, P < 0.02). For HC afferents, 0.3-ms duration clicks evoked larger responses than those of 1 ms (T = 3.06, P < 0.05).
FIG. 6.

Averaged responses (CPE) of sound sensitive vestibular afferents at several click durations (0.1–1 ms, 80 dB SL, rarefaction). AC Anterior canal units, HC horizontal canal units, PC posterior canal units, SO otolith units in the superior branch, IO otolith units in the inferior branch.
Intracellular recording/labeling of click-sensitive units
In addition to physiological tests to identify the end organ innervated by an afferent, we used the intra-axonal recording/labeling technique to anatomically confirm sound activation of vestibular end organs other than the saccule. Figure 7 shows the whole mount of cristae and maculae reacted with fluorescent-conjugated streptavidin to reveal neurobiotin labeling. Among the 25 vestibular afferents that were electrophysiologically characterized and labeled by injection, we recovered and imaged 19 labeled nerve endings within the vestibular end organs. Among them, there were eight sound sensitive irregular afferents, which were found to innervate the AC (n = 2) and HC (n = 1) cristae as well as the utricle (n = 4) and saccule maculae (n = 1). Figure 8 shows the distribution of the recovered 19 fibers in cristae and maculae. All the eight sound sensitive irregular afferents are calyx-bearing fibers (seven calyx only fibers and one dimorphic fiber) and seven of them were located in the central region of the cristae and maculae.
FIG. 7.

Photomicrographs of neurobiotin-labeled sound sensitive afferents. A–C A sound sensitive afferent that innervated horizontal canal (HC). A Peristimulus histogram of the click-evoked responses. B Labeling of the afferent in the superior vestibular ganglion. C Labeling of the afferent in the central horizontal canal crista. D–F Labeling of sound sensitive afferents in the anterior canal crista (D), the saccular (E), and utricular (F) maculae. Insets show higher magnification of the nerve endings. Scale bars = 100 μm.
FIG. 8.

Location of nerve endings in anterior and horizontal canal crista ampullaris and saccule and utricle maculae of 19 labeled afferents identified by their response to sound stimulation. Red labels represent sound sensitive units and green labels represent nonsound sensitive units.
Discussion
The present study quantitatively examined the input–output functions of vestibular afferent responses to clicks employed in clinical VEMP testing. The main finding was that clicks activated both the otolith organ afferents and the semicircular canal afferents at intensities higher than 60 dB SL, but activated only the otolith afferents at 60 dB SL or lower. These results have important implications for VEMP testing and interpretation.
Click sensitivity of the semicircular canal afferents and the otolith organ afferents
Presently, click intensity is defined as the threshold of the ABR of individual animals (50 to 80 dB SL re-ABR threshold, equivalent to ~100 to 130 dB pSPL). This method allows click intensities comparable across animals as well as to those used in human studies (for review, Curthoys 2010). Indeed, clinical cVEMP testing uses air-conducted clicks with intensities ranging from 85 to 100 dB nHL, equivalent to 120–145 dB pSPL (0 dB nHL = 35–45 dB pSPL) (Colebatch et al. 1994; Akin et al. 2003; Ochi et al. 2001; Welgampola and Colebatch 2001; for review, Welgampola and Colebatch 2005; Colebatch 2010; Rosengren et al. 2010). We found that clicks with intensities of 70 and 80 dB SL (re-ABR threshold), which were equivalent to 120 and 130 dB pSPL, activated both semicircular canal and otolith organ afferents. At 60 dB SL (re-ABR threshold), which was equivalent to 110 dB pSPL, only otolith afferents were activated. Therefore, for current clinical VEMP testing protocol, clicks with intensities ranging from 85 to 100 dB nHL, equivalent to 120–145 dB peak sound pressure level (pSPL) (0 dB nHL = 35–45 dB pSPL), could activate both semicircular canal and otolith organ afferents.
Input–output function analysis shows that click-evoked responses of vestibular afferents increased with higher click intensity, consistent with intensity-dependent cVEMP responses in humans (Colebatch et al. 1994; Ochi et al. 2001; Akin et al. 2003). In general, the otolith organ afferents were more sensitive to clicks than the canal afferents. For example, otolith organ afferents exhibited lower thresholds than canal afferents (AC: 70 dB SL vs. SO/IO: 60 dB SL). Nevertheless, at intensity of 80 dB SL (~130 dB pSPL), clicks activated a significant number of canal afferents. In particular, the loud clicks activated 66 % of the AC irregular afferents and half of them exhibited strong responses (i.e., CPE > 0.5) to clicks. Thus, the possibility of activating canal afferents with loud clicks should be taken into consideration in adopting VEMP testing protocols and interpreting the testing results.
Compared to AC and HC, few PC afferent was activated by sound even at high click intensity. The mechanisms of how sound activates each semicircular canals and otolithic end organs are not known. Our ongoing research is examining the biomechanical origins of vestibular responses to sound by modeling the labyrinth and temporal bone as an inhomogeneous continuum for sound propagation in three dimensions. Results from the study will provide insight into why vestibular end organs exhibited different sound sensitivities.
In addition to click intensity, click duration also exhibited differential effects on the semicircular canal afferents and otolith organ afferents. Whereas the saccular afferents recorded from the inferior vestibular nerve branch did not show any click duration preference, clicks with longer durations (0.3 and/or 0.5 ms) evoked larger responses in AC (~40 % increase), HC (~60 % increase), and the SO (~10 % increase) afferents. Interestingly, Huang et al. (2005) demonstrated similar click duration effects on cVEMPs in normal human subjects, i.e., clicks of 0.5 ms duration induced larger cVEMP responses than clicks of 0.1 ms duration. Thus, future human studies need to focus on choosing appropriate click duration and intensity to develop effective and discriminating VEMP test protocols.
Comparison with previous studies
Several previous studies examined sound activation of vestibular organs in animal models. While some studies found that sound activated both the semicircular canal afferents and the otolith organ afferents (Young et al. 1977; Carey et al. 2004; Zhu et al. 2011a,b), others reported that sound primarily activated the saccular afferents (Murofushi et al. 1995; Murofushi and Curthoys 1997; Curthoys et al. 2006) and utricular afferents (Curthoys et al. 2012), but not the canal afferents even at intensities of 80 or 90 dB SL re-ABR threshold. McCue and Guinan (1994a, 1995) found that sound activated the saccular afferents from the inferior vestibular nerve branch but did not test responses of the semicircular canal afferents from the superior vestibular nerve branch. Studies by the Curthoys group employed the same sound stimuli used in clinical VEMP testing, and their results have been most often cited to interpret cVEMP testing as a clinical test of the saccular function (for review, Rosengren et al. 2010; Colebatch 2010; Curthoys 2010). In the present study, however, we found that, clicks, similar to those used in the previous studies, also activate the semicircular canal afferents. In fact, AC afferents exhibited click-evoked responses that were comparable to the otolith organ afferents at click intensity of 80 dB SL. Part of the discrepancy could arise from interspecies, but also possible from the methods used to identify the origin of a vestibular afferent. In the present study, we used both horizontal head rotation and dynamic head tilts to identify which end organ was innervated by an afferent being isolated. This avoids ambiguity that may arise from using static head tilts alone to identify otolith organ afferents. Goldberg and Fernandez (1975) reported that surgical removal of the brain tissues over the vestibular nerves can result in a thermal gradient across the labyrinth and render the semicircular canals sensitive to gravity. Thus, sensitivity to the direction of gravity prevents perfect identification of otolith organ afferents solely based on static head tilts. Differences in assessing sound sensitivity may also contribute to the discrepancies among these studies. The CPE analysis adopted in the present study provides a quantitative measurement of sound sensitivity, which makes it possible to compare sound sensitivities among various vestibular end organs. Our data show that vestibular afferent sound sensitivity forms a continuum ranging from no response (CPE < 0.1) to strong response (CPE > 0.5). For example, at 80 dB SL, while 97 % of the sound sensitive saccular afferents from the inferior branch of vestibular nerve showed strong responses (CPE > 0.5) to clicks, 50 % of the AC sound sensitive units showed strong responses to clicks. It is important to note that, to appropriately interpret clinical VEMP testing results, we should not only consider the afferents with strong responses but also those with weaker responses because they also likely contribute to the VEMP responses via synchronous activation of a population of sound-sensitive afferents.
Vestibular hair cells and afferents received innervation from efferent fibers (Lindeman 1969; Klinke and Galley 1974; Goldberg and Fernandez 1980; Sans and Highstein 1984). The efferents do not appear to modulate afferent responses during normal wakefulness because vestibular afferents exhibit similar resting discharge rates, gains, and phases to head rotation in barbiturate-anesthetized animals and in alert animals (Fernandez and Goldberg 1971; Keller 1976; Lisberger and Pavelko 1986). McCue and Guinan (1994b) further showed that efferent stimulation raised the mean firing rate of sound sensitive saccular afferents but did not change the afferents' sound threshold or the amplitude of sound-evoked responses. Therefore, even though efferent function could be suppressed in anesthetized animals, anesthesia would not affect vestibular afferents' sensitivity to sound stimulation.
Vestibular afferent sound sensitivity and peripheral innervation pattern
Previous study using extracellular biocytin injection (Murofushi and Curthoys 1997), juxtacellular labeling (Curthoys et al. 2006; Curthoys et al. 2012) and intracellular labeling (McCue and Guinan 1994a) confirmed projections of sound sensitive afferents to the saccule. In the present study, in a subset of recordings, we used intra-axonal injection of neurobiotin to label projections and identify the peripheral innervation patterns. The intra-axonal labeling results clearly showed that sound sensitive afferents innervated not only the saccule but also the utricle, the anterior canal, and the horizontal canal (Figs. 7 and 8). Furthermore, we found that all eight labeled sound sensitive afferents were calyx-bearing units, and seven of them were located in the central region of the epitheliums. Since units located in the .central (striolar) zones, including dimorphic and calyx units, are known to be more sensitive to high-frequency stimuli than their noncalyx bearing counterparts (Songer and Eatock 2013; Eatock and Songer 2011), these preliminary results provide insights into the mechanisms underlying sound activation of vestibular afferents. For example, loud sounds and vibration may cause mechanical movements of vestibular hair bundles within the organ, which activate the subset of hair-cell/afferent complexes with the capability to respond at auditory frequencies.
Implications for clinical cVEMP testing
While the saccule theory is dominating the field of cVEMP testing and is supported by many studies, there is accumulating evidence that suggests other possibilities. For examples, human cVEMP frequency tuning exhibits two peaks (Wei et al. 2013) and is different from that of oVEMP (Todd et al. 2009; Colebatch 2010). Studies in behaving monkeys demonstrated that clicks activate the horizontal canal and the utricle (Zhou et al. 2004, 2005, 2007; Xu et al. 2009). A recent study by Luis et al. (2013a,b) reported that a patient whose horizontal canal function was reversibly blocked showed reduced VEMP responses. Recordings from central vestibular nuclei revealed that vestibular nucleus neurons with canal sensitivity can be activated by clicks (Zhu et al. 2012). Anatomically, all three semicircular canals make connections with SCM motoneurons (for reviews, Wilson and Schor 1999; Uchino et al. 2005; Uchino and Kushiro 2011). Taken together with the neurophysiology data, the results suggest that the contribution of canal afferents to VEMPs should not be ruled out before the neural basis of sound activation of the vestibular system is fully understood.
In vestibular testing clinics, there are two popular approaches of VEMP analysis. One is based on measuring the VEMP thresholds (for review, Rauch 2006). For example, SCD or Tullio patients often exhibit lower VEMP thresholds than normal controls. The other approach is based on computing an asymmetry index (AI) to compare the VEMP responses of the two sides (i.e., VEMPL and VEMPR) at sound intensity levels that are ~20 dB above the VEMP threshold, e.g., AI = (VEMPL − VEMPR)/(VEMPL + VEMPR). An AI of 0 indicates symmetrical VEMP responses of the two sides, therefore normal or balanced saccule function; an AI larger than 0.3 indicates a weaker right side response and a deficit of the right saccule; and an AI smaller than −0.3 indicates a weaker left response and a deficit of the left saccule. The interpretation in both cases is based on the assumption that the saccule is the sole generator of the VEMP. However, the anatomical and physiological evidence presented here suggests that loud click-evoked cVEMPs may have two contributors, i.e., the otoliths and the semicircular canals. Deficits in either of them may result in changes in thresholds and asymmetry in the cVEMPs. Nevertheless, since vestibular end organs exhibit differential sensitivities to sound, it is possible to develop more discriminating VEMP test by choosing appropriate VEMP testing protocols to achieve selective activation of various vestibular end organs.
Studies in behaving monkeys have demonstrated that clicks activate the horizontal canal and the utricle (Zhou et al. 2004, 2005, 2007; Xu et al. 2009). Although we use sound parameters that are comparable to that used in human VEMP testing, we are aware of the differences between humans and rodents. It should be cautious to interpret the results from animal studies. While the results from animal studies provide important clues for developing optimal VEMP test protocols, the sound parameters obtained from the rat studies should not be directly applied to humans. Instead, independent research in humans should be conducted to define the proper sound parameters.
Acknowledgment
This study is supported by NIH R01DC012060 (HZ), NIH R01DC008585 (WZ), and R01DC006685 (RDR).
Disclosure
None of the authors have any conflicts of interests.
References
- Akin FW, Murnane OD, Proffitt TM. The effects of click and tone-burst stimulus parameters on the vestibular evoked myogenic potential (VEMP) J Am Acad Audiol Nov. 2003;14(9):500–509. doi: 10.3766/jaaa.14.9.5. [DOI] [PubMed] [Google Scholar]
- Baird RA, Desmadryl GL, Femandez C, Goldberg JM. The vestibular nerve of the chinchilla. II. Relation between afferent response properties and peripheral innervation patterns in the semicircular canals. J Neurophysiol. 1988;60:182–203. doi: 10.1152/jn.1988.60.1.182. [DOI] [PubMed] [Google Scholar]
- Bickford RG, Jacobson JL, Cody DTR. Nature of averaged evoked potentials to sound and other stimuli in man. Ann NY Acad Sci. 1964;112:204–218. doi: 10.1111/j.1749-6632.1964.tb26749.x. [DOI] [PubMed] [Google Scholar]
- Blanks RH, Torigoe Y. Orientation of the semicircular canals in rat. Brain Res. 1989;487(2):278–287. doi: 10.1016/0006-8993(89)90832-9. [DOI] [PubMed] [Google Scholar]
- Boyle R, Carey JP, Highstein SM. Morphological correlates of response dynamics and efferent stimulation in horizontal semicircular canal afferents of the toadfish Opsanus tau. J Neurophysiol. 1991;66(5):1504–1521. doi: 10.1152/jn.1991.66.5.1504. [DOI] [PubMed] [Google Scholar]
- Broussard DM, Lisberger SG. Vestibular input to brain stem neurons that participate in motor learning in the primate vestibuloocular reflex. J Neurophysiol. 1992;68:1906–1909. doi: 10.1152/jn.1992.68.5.1906. [DOI] [PubMed] [Google Scholar]
- Broussard DM, DeCharms RC, Lisberger SG. Inputs from the ipsilateral and contralateral vestibular apparatus to behaviorally characterized abducens neurons in rhesus monkeys. J Neurophysiol. 1995;74:2445–2459. doi: 10.1152/jn.1995.74.6.2445. [DOI] [PubMed] [Google Scholar]
- Carey JP, Hirvonen TP, Hullar TE, Minor LB. Acoustic responses of vestibular afferents in a model of superior canal dehiscence. Otol Neurotol. 2004;25:345–352. doi: 10.1097/00129492-200405000-00024. [DOI] [PubMed] [Google Scholar]
- Colebatch JG. Vestibular evoked potentials. Curr Opin Neurol. 2001;14:21–26. doi: 10.1097/00019052-200102000-00004. [DOI] [PubMed] [Google Scholar]
- Colebatch JG. Sound conclusion? Clin Neurophysiol. 2010;121:124–126. doi: 10.1016/j.clinph.2009.09.026. [DOI] [PubMed] [Google Scholar]
- Colebatch JG, Halmagyi GM. Vestibular evoked potentials in human neck muscles before and after unilateral vestibular deafferentation. Neurology. 1992;42(8):1635–1636. doi: 10.1212/WNL.42.8.1635. [DOI] [PubMed] [Google Scholar]
- Colebatch JG, Rothwell JC. Motor unit excitability changes mediating vestibulocollic reflexes in the sternocleidomastoid muscle. Clin Neurophysiol. 2004;115(11):2567–2573. doi: 10.1016/j.clinph.2004.06.012. [DOI] [PubMed] [Google Scholar]
- Colebatch JG, Halmagyi GM, Skuse NF. Myogenic potentials generated by a click-evoked vestibulocollic reflex. J Neurol Neurosurg Psychiatry. 1994;57:190–197. doi: 10.1136/jnnp.57.2.190. [DOI] [PMC free article] [PubMed] [Google Scholar]
- Curthoys IS. A critical review of the neurophysiological evidence underlying clinical vestibular testing using sound, vibration and galvanic stimuli. Clin Neurophysiol. 2010;121:132–144. doi: 10.1016/j.clinph.2009.09.027. [DOI] [PubMed] [Google Scholar]
- Curthoys IS, Vulovic V. Vestibular primary afferent responses to sound and vibration in the guinea pig. Exp Brain Res. 2011;210:347–352. doi: 10.1007/s00221-010-2499-5. [DOI] [PubMed] [Google Scholar]
- Curthoys IS, Kim J, McPhedran SK, Camp AJ. Bone conducted vibration selectively activates irregular primary otolithic vestibular neurons in the guinea pig. Exp Brain Res. 2006;175(2):256–267. doi: 10.1007/s00221-006-0544-1. [DOI] [PubMed] [Google Scholar]
- Curthoys IS, Vulovic V, Sokolic L, Pogson J, Burgess AM. Irregular primary otolith afferents from the guinea pig utricular and saccular maculae respond to both bone conducted vibration and to air conducted sound. Brain Res Bull. 2012;89(1–2):16–21. doi: 10.1016/j.brainresbull.2012.07.007. [DOI] [PubMed] [Google Scholar]
- Daunicht WJ, Pellionisz AJ. Spatial arrangement of the vestibular and the oculomotor system in the rat. Brain Res. 1987;435:48–56. doi: 10.1016/0006-8993(87)91585-X. [DOI] [PubMed] [Google Scholar]
- Eatock RA, Songer JE. Vestibular hair cells and afferents: two channels for head motion signals. Ann Rev Neurosci. 2011;34:501–534. doi: 10.1146/annurev-neuro-061010-113710. [DOI] [PubMed] [Google Scholar]
- Estes MS, Blanks RHI, Markham CH. Physiological characteristics of vestibular first-order canal neurons in the cat. I. Response plane determination and resting discharge characteristics. J Neurophysiol. 1975;38:1232–1249. doi: 10.1152/jn.1975.38.5.1232. [DOI] [PubMed] [Google Scholar]
- Fernandez C, Goldberg JM. Physiology of peripheral neurons innervating semicircular canals of the squirrel monkey. II. Response to sinusoidal stimulation and dynamics of peripheral vestibular system. J Neurophysiol. 1971;34:661–675. doi: 10.1152/jn.1971.34.4.661. [DOI] [PubMed] [Google Scholar]
- Goldberg JM, Fernandez C. Responses of peripheral vestibular neurons to angular and linear accelerations in the squirrel monkey. Acta Oto-laryngologica. 1975;80(1–6):101–110. doi: 10.3109/00016487509121307. [DOI] [PubMed] [Google Scholar]
- Goldberg JM, Fernandez C. Efferent vestibular system in the squirrel monkey: anatomical location and influence on afferent activity. J Neurophysiol. 1980;43:986–1025. doi: 10.1152/jn.1980.43.4.986. [DOI] [PubMed] [Google Scholar]
- Goldberg JM, Smith CE, Fernandez C. Relation between discharge regularity and responses to externally applied galvanic currents in vestibular nerve afferents of the squirrel monkey. J Neurophysiol. 1984;51(6):1236–1256. doi: 10.1152/jn.1984.51.6.1236. [DOI] [PubMed] [Google Scholar]
- Goldberg JM, Wilson VJ, Cullen KE, Angelaki DE, Broussard DM, Buttnwe-Ennever JA, Fukushima K, Minor LB (2012) Clinical manifestation of peripheral vestibular dysfunction. In the vestibular system: a sixth sense. Oxford University Press, Oxford, pp 495–524
- Halmagyi GM, Curthoys IS, Colebatch JG, Aw ST. Vestibular responses to sound. Ann NY Acad Sci. 2005;1039:54–67. doi: 10.1196/annals.1325.006. [DOI] [PubMed] [Google Scholar]
- Holstein GR, Rabbitt RD, Martinelli GP, Friedrich VL, Jr, Boyle RD, Highstein SM. Convergence of excitatory and inhibitory hair cell transmitters shapes vestibular afferent responses. PNAS. 2004;101:15766–15771. doi: 10.1073/pnas.0402824101. [DOI] [PMC free article] [PubMed] [Google Scholar]
- Huang TW, Su HC, Cheng PW. Effect of click duration on vestibular-evoked myogenic potentials. Acta Otolaryngol. 2005;125:141–144. doi: 10.1080/00016480410016900. [DOI] [PubMed] [Google Scholar]
- Hullar TE, Minor LB. High-frequency dynamics of regularly discharging canal afferents provide a linear signal for angular vestibuloocular reflexes. J Neurophysiol. 1999;82:2000–2005. doi: 10.1152/jn.1999.82.4.2000. [DOI] [PubMed] [Google Scholar]
- Keller EL. Behavior of horizontal semicircular canal afferents in alert monkey during vestibular and optokinetic stimulation. Exp Brain Res. 1976;24:459–471. doi: 10.1007/BF00234963. [DOI] [PubMed] [Google Scholar]
- Klinke R, Galley N. Efferent innervation of vestibular and auditory receptors. Physiol Rev. 1974;54:316–357. doi: 10.1152/physrev.1974.54.2.316. [DOI] [PubMed] [Google Scholar]
- Lasker DM, Han GC, Park HJ, Minor LB. Rotational responses of vestibular–nerve afferents innervating the semicircular canals in the C57BL/6 mouse. J Assoc Res Otolaryngol. 2008;9(3):334–348. doi: 10.1007/s10162-008-0120-4. [DOI] [PMC free article] [PubMed] [Google Scholar]
- Lindeman HH. Studies of the morphology of the sensory regions of the vestibular apparatus. Erg Anat. 1969;42:1–113. [PubMed] [Google Scholar]
- Lisberger SG, Pavelko TA. Vestibular signals carried by pathways subserving plasticity of the vestibulo-ocular reflex in monkeys. J Neurosci. 1986;6:346–354. doi: 10.1523/JNEUROSCI.06-02-00346.1986. [DOI] [PMC free article] [PubMed] [Google Scholar]
- Luis L, Costa J, Vaz Garcia F, Valls-Solé J, Brandt T, Schneider E (2013a) Spontaneous plugging of the horizontal semicircular canal with reversible canal dysfunction and recovery of vestibular evoked myogenic potentials. Otol. Neurotol 34:743–747 [DOI] [PubMed]
- Luis L, Zhu H, Costa J, Valls-Solé J, Brandt T, Zhou W, Schneider E (2013b) Reply to the commentary on Luis et al. “Spontaneous plugging of the horizontal semicircular canal with reversible canal dysfunction and recovery of vestibular evoked myogenic potentials”. Otol Neurotol (in press) [DOI] [PubMed]
- McCue MP, Guinan JJ. Acoustically responsive fibers in the vestibular nerve of the cat. J Neurosci. 1994;14:6058–6070. doi: 10.1523/JNEUROSCI.14-10-06058.1994. [DOI] [PMC free article] [PubMed] [Google Scholar]
- McCue MP, Guinan JJ. Influence of efferent stimulation on acoustically responsive vestibular afferents in the cat. J Neurosci. 1994;14:6071–6083. doi: 10.1523/JNEUROSCI.14-10-06071.1994. [DOI] [PMC free article] [PubMed] [Google Scholar]
- McCue MP, Guinan JJ. Spontaneous activity and frequency selectivity of acoustically responsive vestibular afferents in the cat. J Neurophysiol. 1995;74:1563–1572. doi: 10.1152/jn.1995.74.4.1563. [DOI] [PubMed] [Google Scholar]
- McCue MP, Guinan JJ. Sound-evoked activity in primary afferent neurons of a mammalian vestibular system. Am J Otol. 1997;18:355–360. [PubMed] [Google Scholar]
- Minor LB, Solomon D, Zinreich J, Zee DS. Sound- and/or pressure-induced vertigo due to bone dehiscence of the superior semicircular canal. Arch Otolaryngol Head Neck Surg. 1998;124:249–258. doi: 10.1001/archotol.124.3.249. [DOI] [PubMed] [Google Scholar]
- Minor LB, Cremer PD, Carey JP, Della Santina CC, Streubel SO, Weg N. Symptoms and signs in superior canal dehiscence syndrome. Ann NY Acad Sci. 2001;942:259–273. doi: 10.1111/j.1749-6632.2001.tb03751.x. [DOI] [PubMed] [Google Scholar]
- Murofushi T, Curthoys IS. Physiological and anatomical study of click-sensitive primary vestibular afferents in the guinea pig. Acta Otolaryngol. 1997;117:66–72. doi: 10.3109/00016489709117994. [DOI] [PubMed] [Google Scholar]
- Murofushi T, Curthoys IS, Topple AN, Colebatch JG, Halmagyi GM. Responses of guinea pig primary vestibular neurons to clicks. Exp Brain Res. 1995;103:174–178. doi: 10.1007/BF00241975. [DOI] [PubMed] [Google Scholar]
- Ochi K, Ohashi T, Nishino H. Variance of vestibular-evoked myogenic potentials. Laryngoscope. 2001;111(3):522–527. doi: 10.1097/00005537-200103000-00025. [DOI] [PubMed] [Google Scholar]
- Parker DE, Tubbs RL, Littlefield VM. Visual‐field displacements in human beings evoked by acoustical transients. J Acoust Soc Am. 1978;63(6):1912–1918. doi: 10.1121/1.381894. [DOI] [PubMed] [Google Scholar]
- Rauch SD. Vestibular evoked myogenic potentials. Curr Opin Otolaryngol Head Neck Surg. 2006;14:299–304. doi: 10.1097/01.moo.0000244185.65022.01. [DOI] [PubMed] [Google Scholar]
- Rosengren SM, Welgampola MS, Colebatch JG. Vestibular evoked myogenic potentials: past, present and future. Clin Neurophysiol. 2010;121:636–651. doi: 10.1016/j.clinph.2009.10.016. [DOI] [PubMed] [Google Scholar]
- Sans A, Highstein SM. New ultrastructural features in the vestibular labyrinth of the toadfish. Opsanus tau Brain Res. 1984;308:191–195. doi: 10.1016/0006-8993(84)90936-3. [DOI] [PubMed] [Google Scholar]
- Simpson GV, Knight RT, Brailowsky S, Prospero-Garcia O, Scabini D. Altered peripheral and brainstem auditory function in aged rats. Brain Res. 1985;348:28–35. doi: 10.1016/0006-8993(85)90355-5. [DOI] [PubMed] [Google Scholar]
- Songer JE, Eatock RA. Tuning and timing in Mammalian type I hair cells and calyceal synapses. J Neurosci. 2013;33(8):3706–3724. doi: 10.1523/JNEUROSCI.4067-12.2013. [DOI] [PMC free article] [PubMed] [Google Scholar]
- Streubel SO, Cremer PD, Carey JP, Weg N, Minor LB. Vestibular-evoked myogenic potentials in the diagnosis of superior canal dehiscence syndrome. Acta Otolaryngol Suppl. 2001;545:41–49. doi: 10.1080/000164801750388090. [DOI] [PubMed] [Google Scholar]
- Todd NPM, Rosengren SM, Colebatch JG. A utricular origin of frequency tuning to low-frequency vibration in the human vestibular system? Neurosci Lett. 2009;45:175–180. doi: 10.1016/j.neulet.2008.12.055. [DOI] [PubMed] [Google Scholar]
- Tullio P. Das Ohr und die Entstehung der Sprache und Schrift. Berlin: Urban & Schwarzenberg; 1929. [Google Scholar]
- Uchino Y, Kushiro K. Differences between otolith- and semicircular canal-activated neural circuitry in the vestibular system. Neurosci Res. 2011;71(4):315–327. doi: 10.1016/j.neures.2011.09.001. [DOI] [PubMed] [Google Scholar]
- Uchino Y, Sasaki M, Sato H, Bai R, Kawamoto E. Otolith and canal integration on single vestibular neurons in cats. Exp Brain Res. 2005;164:271–285. doi: 10.1007/s00221-005-2341-7. [DOI] [PubMed] [Google Scholar]
- Wei W, Jeffcoat B, Mustain W, Xu Y, Eby T, Zhu H, Tang X, Zhou W. Vestibular-evoked myogenic potentials (VEMP) recorded from different sites of the sternocleidomastoid muscles in normal human subjects. J Assoc Res Otolaryngol. 2013;14(1):37–47. doi: 10.1007/s10162-012-0360-1. [DOI] [PMC free article] [PubMed] [Google Scholar]
- Welgampola MS, Carey JP. Waiting for the evidence: VEMP testing and the ability to differentiate utricular vs saccular function. Otolaryngol Head Neck Surg. 2010;143:281–283. doi: 10.1016/j.otohns.2010.05.024. [DOI] [PMC free article] [PubMed] [Google Scholar]
- Welgampola MS, Colebatch JG. Vestibulocollic reflexes: normal values and the effect of age. Clin Neurophysiol. 2001;112:1971–1979. doi: 10.1016/S1388-2457(01)00645-9. [DOI] [PubMed] [Google Scholar]
- Welgampola MS, Colebatch JG. Characteristics and clinical applications of vestibular-evoked myogenic potentials. Neurology. 2005;64:1682–1688. doi: 10.1212/01.WNL.0000161876.20552.AA. [DOI] [PubMed] [Google Scholar]
- Wilson VJ, Schor RH. The neural substrate of the vestibulocollic reflex: what needs to be learned. Exp Brain Res. 1999;129:483–493. doi: 10.1007/s002210050918. [DOI] [PubMed] [Google Scholar]
- Wit HP, Bleeker JD, Mulder HH. Responses of pigeon vestibular nerve fibers to sound and vibration with audiofrequencies. J Acoust Soc Am. 1984;75(1):202–208. doi: 10.1121/1.390396. [DOI] [PubMed] [Google Scholar]
- Xu Y, Simpson I, Tang X, Zhou W. Acoustic clicks activate both the canal and otolith vestibulo-ocular reflex pathways in behaving monkeys. J Assoc Res Otolaryngol. 2009;10(4):569–577. doi: 10.1007/s10162-009-0178-7. [DOI] [PMC free article] [PubMed] [Google Scholar]
- Young ED, Fernandez C, Goldberg JM. Responses of squirrel monkey vestibular neurons to audio-frequency sound and head vibration. Acta Otolaryngol. 1977;84:352–360. doi: 10.3109/00016487709123977. [DOI] [PubMed] [Google Scholar]
- Zhou G, Cox LC. Vestibular evoked myogenic potentials: history and overview. Am J Audiol. 2004;13:135–143. doi: 10.1044/1059-0889(2004/018). [DOI] [PubMed] [Google Scholar]
- Zhou W, Mustain W, Simpson I. Sound-evoked vestibulo-ocular reflexes (VOR) in trained monkeys. Exp Brain Res. 2004;156:129–134. doi: 10.1007/s00221-003-1778-9. [DOI] [PubMed] [Google Scholar]
- Zhou W, Simpson I, Xu Y, Fong A. Activity-dependent modulation: a non-linearity in the unilateral vestibulo-ocular reflex (VOR) pathways. Exp Brain Res. 2005;163:267–272. doi: 10.1007/s00221-005-2304-z. [DOI] [PubMed] [Google Scholar]
- Zhou W, Xu Y, Simpson I, Cai YD. Multiplicative computation in the vestibulo-ocular reflex (VOR) J Neurophysiol. 2007;97:2780–2789. doi: 10.1152/jn.00812.2006. [DOI] [PubMed] [Google Scholar]
- Zhu H, Tang X, Wei W, Xu Y, Mustain W, Zhou W. Click-evoked responses in vestibular afferents in rats. J Neurophysiol. 2011;106(2):754–763. doi: 10.1152/jn.00003.2011. [DOI] [PubMed] [Google Scholar]
- Zhu H, Tang X, Wei W, Mustain M, Zhou W (2011b) Air-conducted short tone bursts-evoked vestibular responses in rats. Society for Neuroscience, Program No. 579.05/FF12 Neuroscience Meeting Planner, Washington
- Zhu H, Tang X, Mustain M, Zhou W (2012) Air-conducted click-evoked responses in the vestibular nuclei of rats. Program No. 574.10/II2 Neuroscience Meeting Planner. New Orleans, Society for Neuroscience