Abstract
Currently there are no routine methods to delineate the primary auditory cortex (PAC) of humans in vivo. Due to the large differences in the location of the PAC between subjects, labels derived from post-mortem brains may be inaccurate when applied to different samples of in-vivo brains. Recent magnetic resonance (MR) imaging studies suggested that MR-tissue properties can be used to define the location of the PAC region in vivo. The basis for such an approach is that the PAC region is more strongly myelinated than secondary areas.
We developed a fully automatic method to identify the PAC in conventional anatomical data using a combination of two complementary MR contrasts, i.e. T1 and T2, at 3 Tesla with 0.7 mm isotropic resolution. Our algorithm maps the anatomical MR data to reconstructed cortical surfaces and uses a classification approach to create an artificial contrast that is highly sensitive to the effects of an increased myelination of the cortex. Consistent with the location of the PAC defined in post-mortem brains, we found a compact region on the medial two thirds of Heschl’s gyrus in both hemispheres of all 39 subjects. With further improvements in signal-to-noise ratio of the anatomical data and manual correction of segmentation errors, the results suggest that the primary auditory cortex can be defined in the living brain of single subjects.
Keywords: human primary auditory cortex, localization, in vivo, MRI
1. Introduction
The knowledge of the exact location and delineation of cortical areas in the living human brain would benefit the interpretation of activation obtained using functional imaging methods such as functional magnetic resonance imaging (fMRI) and positron emission tomography (PET). Currently functional imaging studies mostly rely on parcellation schemes that have been obtained from post-mortem brains using architectonic methods (e.g. Brodmann, 1909; von Economo and Koskinas, 1925). The scheme of Brodmann (1909) has been implemented into standard brain templates such as the Talairach atlas which is based on one brain or the Montreal Neurological Institute (MNI) which is based on an average of more than 100 brains. However, the precision of the location of cortical brain areas, which have been defined in only a few brains, is limited because of the large anatomical differences between subjects. A current approach to overcome this problem is to use surface–based alignment of the cortical folding patterns (Fischl et al.,2008) or template-free registration (Tahmasebi et al., 2009) in conjunction with probability maps that are based on newly defined architectonic properties of cortical areas in ten different brains (Mazziotta et al., 2001; Zilles et al., 2002). The results suggest that cortical folds are much better predictors of the cytoarchitectonically defined regions than had been previously thought. Therefore this approach is extremely valuable for group analyzes of brain imaging studies. However, it may still fail when applied to brain activity of individual subjects and even groups of subjects if the cortical area of interest is small, and it seems useful to acquire additional information to robustly localize specific brain regions in individual brains. In the visual system, such additional information has been obtained from retinotopic mapping experiments (e.g. Sereno et al., 1995). In addition, anatomical information from individual subjects can be used to estimate the shape of primary visual cortex as recently suggested by Hinds et al. (2008). In the auditory modality, however, comparable routine methods are not available, and recent attempts to prove the mirror-symmetric tonotopic organization of the primary auditory cortex (PAC) areas using high resolution fMRI showed contradictory results (Schonwiesner et al., 2002; Formisano et al., 2003; Talavage et al., 2004; Langers et al., 2007; Woods et al., 2009; Humphries et al.,2010; Striem-Amit et al., 2011; Costa et al., 2011; Dick et al., 2012; Moerel et al., 2012). Thus, even the localization of the primary auditory cortex areas of humans and even more so its delineation form the neighboring areas is still an unsolved issue. The consequence is that activation observed on or near Heschl’s gyrus (HG) in functional imaging studies is often attributed to primary auditory cortex irrespective of its exact location. This is misleading even more so when coordinates of the primary auditory cortex (Brodmann area 41) in Talairach or MNI brain templates are used. ¿From a number of architectural parcellation schemes (Beck, 1930; Hopf, 1954a,1954b; von Economo and Horn, 1930; Flechsig, 1908; Galaburda and Sanides, 1980; Clarke and Rivier, 1998; Morosan et al., 2001), it is evident that a large number of functionally separate fields occupy Heschl’s gyrus and its immediate vicinity. If the functional parcellation scheme of the core and medial and lateral beltareas that are known from the monkey (see Kaas and Hackett, 1998; Hackett et al., 2001) also applies to the human auditory cortex, about ten such fields are to be expected (i.e. the primary areas A1, R and RT, the medial belt areas CM, RM, RTM, and the lateral belt areas CL, ML, AL, RTL). To better understand the processing in these primary and secondary areas, routine methods are needed to delineate these areas in humans in vivo.
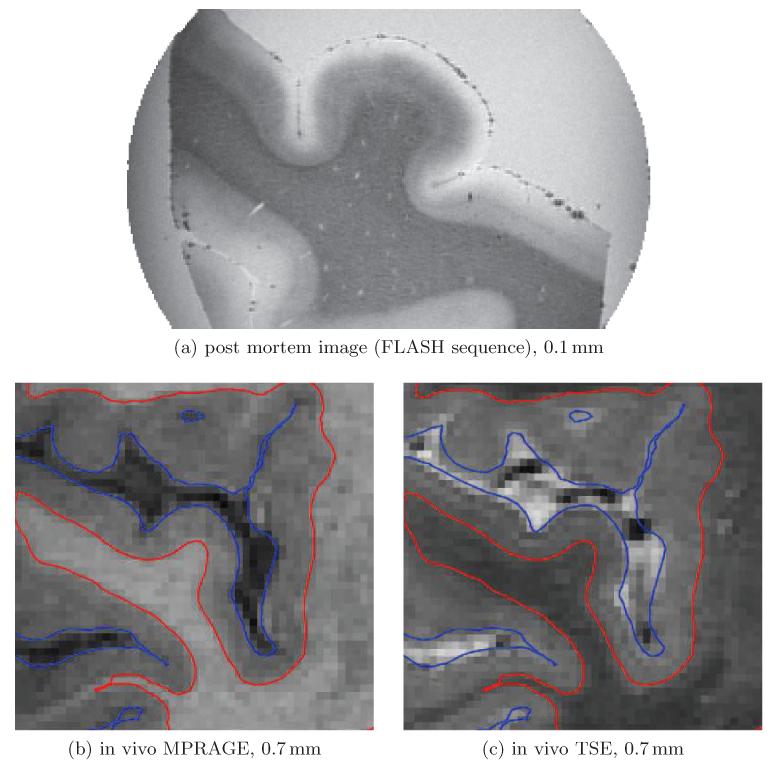
In recent years anatomical MR imaging has been used to determine fine grain differences in tissue properties in post-mortem material (e.g. Fischl et al., 2008). First attempts have also been made in-vivo mainly to delineate the primary visual cortex (Bridge et al., 2005; Eickhoff et al., 2005;Duyn et al., 2007). An anatomical imaging approach has been suggested by Sigalovsky et al. (2006) by mapping an intrinsic MR property, i.e. the longitudinal relaxation rate (R1), of gray matter in auditory cortex. The basis for such a definition is that the gray matter of primary areas is more strongly myelinated than that of secondary areas. In high resolution MR images of post-mortem tissue such differences can be observed (Fig. 1a), but in vivo images of humans must be acquired at much lower resolution such that the fine grain details of tissue MR contrast are much less evident (Figures 1b, 1c).
Figure 1.
Post mortem tissue scanned at 0.1 mm with a FLASH sequence (a) and the two contrasts we acquired for our study (b-c). Each image is in coronal orientation and centered to Heschl’s gyrus. In (a) the lower two thirds of the gray matter in this region clearly show a shift in intensity similar to the white matter. This, however, is not apparent in the in vivo images. Also note that the lower layers seem to be compressed within deep sulci left and right of Heschl’s gyrus in Figure (a).
Sigalovsky et al. (2006) showed the distribution of R1 values within the auditory cortex of a limited number of five subjects scanned at 1.5 Tesla at 1.3 × 1.0 × 1.3 mm3 resolution. In most of the hemispheres they found the highest R1 values in posteriomedial Heschl’s gyrus, which is consistent with the location of PAC in architectural studies. However, in four out of five subjects they obtained large areas with similar relaxation rates on the planum temporale, which have not been described in any of the histological studies and are thus a matter of debate.
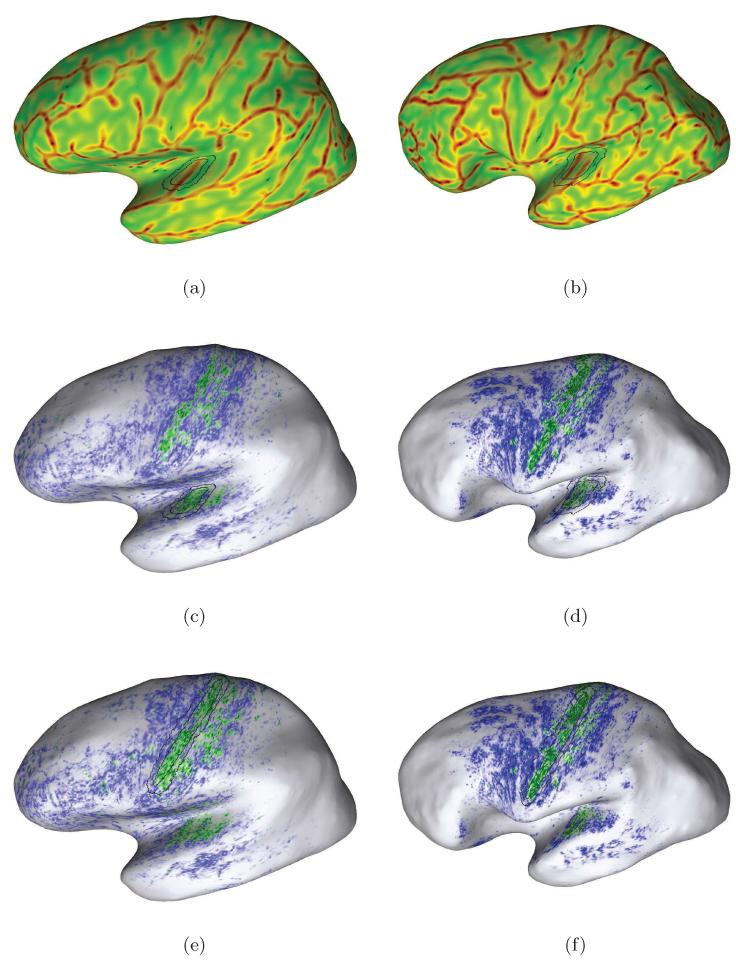
The aim of the current study was to identify the human primary auditory cortex (PAC) area as defined in human architectonic studies, e.g. Brodmann area 41 (Brodmann, 1909), area TC (von Economo and Horn, 1930) or area Te1 (Morosan et al., 2001). We follow a fully automatic approach of combining two different, complementary MR contrasts, i.e. T1 and T2 weighted anatomical imaging, of 39 brains at 3 Tesla with 0.7 mm isotropic resolution. These reflect both longitudinal and transversal relaxation properties of brain tissue. Compared to using only one contrast, this combination will thus be more reliable for identifying the PAC in individual subjects and reduce the labeling of non-PAC areas, i.e. on planum temporale. This was also recently shown by Glasser and Van Essen (2011) using a global approach to combine T1 and T2 weighted MRI. Here, we propose a novel data-driven technique to map the differences in the likelihood of increased myelin content in the primary auditory cortex and adjacent higher-order regions.
In contrast to previous work, our mapping approach is based on a local, unsupervised classification technique. It takes into account the limitations of MR imaging as well as the variability of the auditory cortex anatomy without having to resort to model-based or interactive outlier removal, nonlinear transformations and extensive low pass filtering of the data. This ensures the reliability and reproducibility of the mapping results. Another important advantage is that our method can be easily extended to compare the feature distributions of further regions as well as to combine information from any number of different measurements. For example, the method may in the future be adapted to delineate functional areas within and outside the PAC by considering additional, complementary MR scans as input, such as susceptibility weighted imaging and angiography data or functional activation maps.
We carefully analyze the reliability of the estimated PAC regions in the individual brains based on anatomic definitions of the human auditory cortex (Brodmann, 1909; von Economo and Horn, 1930; Morosan et al., 2001) and investigate the robustness of our approach.
A true validation of the individual localization results would require additional information, in particular functional measurements that reveal stable, comparable patterns of the functionally separate fields, such as tonotopy. Unfortunately, irrespective of the ongoing attempts at parcellating the auditory cortex based on topographic maps (e.g. Costa et al., 2011;Dick et al., 2012), the robust localization and precise delineation of the human PAC areas in-vivo remain elusive, as recently summarized by Moerel et al. (2012): “To date, it remains unclear how the location and orientation of the auditory core relates to these tonotopic gradients. Several imaging studies suggested that the primary tonotopic gradient is oriented in posteromedial to anterolateral direction along HG (Formisano et al., 2003; Seifritz et al., 2006; Riecke et al., 2007). Conversely, recent studies argued that the main gradient runs in anterior–posterior direction (Humphries et al., 2010; Da Costa et al., 2011; Striem-Amit et al., 2011)”. Unfortunately, no tonotopic results are available that describe individual or group maps in standard space. These limitations complicate the interpretation and empirical evaluation of functionally separate fields by a comparison with different in-vivo topographic maps. Hence, despite their inherently limited use for a precise localization of the human PAC areas, architectonic probability maps must currently be considered as state of the art, with which we compare our in-vivo group maps, i.e. to the probability maps of the PAC region from the ex-vivo studies by Morosan et al. (2001).
2. Material and Methods
2.1. Concept of Mapping
The presented algorithm generates from d ≥ 1 MR measurements per subject a cortical surface overlay that reveals individual differences in the local cortical myelination. Highlighted regions in the in-vivo maps can be understood as brain regions with high likelihood of increased myelin content similar to that of the primary cortex region of interest.
For the purpose of localizing the PAC in the in-vivo maps, we acquired anatomical MR images with two different contrasts (d = 2). For each subject and hemisphere we generated a reconstruction of the inner (i.e. gray–white matter) and outer (i.e. gray matter–CSF) cortical boundary in the form of triangle meshes. The MR intensities perpendicular to the inner cortical boundary were then mapped to these surfaces. The MR contrasts (T1 and T2) provide partial, indirect and complementary information about average myelin density. By combined analysis of the MR feature distribution the differences in tissue properties between Heschl’s gyrus and adjacent areas are boosted by using a statistical classifier.
Unlike with previous work, we propose an unsupervised, local approach that provides a robust, reproducible, data–driven classification of the MR intensities, and implies a reliable estimate of the individual location and shape of the PAC region. Each individual PAC area can be defined by analyzing in the resulting surface overlays the spatial layout of highlighted patches in the temporal lobes of each of the cortical hemispheres under study. In each case, the final classification result is obtained by iteratively optimizing the separability of the two different MR feature distributions that are estimated based on the local feature samples from a compact, ellipsoid sampling region over the subject’s Heschl’s gyrus and an adjacent sampling region that more likely covers other cortex areas within the subject’s temporal lobe. The ellipsoid embeddings of the sampling regions are initialized by mapping the Heschl’s gyrus label from a standard atlas to the single cortical surfaces, and labelling the surrounding surface region, respectively. These sampling regions are then iteratively deformed until the overlap of the two local distributional estimates in the feature space is minimized. Finally, the optimal decision boundary is used to compute the cortical surface overlays, and highlighted, hyper-intense surface regions overlapping the deformed ellipsoids are considered as the most likely in-vivo estimates of the human PAC area.
Our algorithm avoids extensive, model-based improvements of the raw data. That is, possible artifacts due to imaging limitations and (pre-) processing error are taken into account, but outliers are currently neither explicitly modelled nor removed. The chosen regularization constraints follow basic anatomical knowledge about myelin distribution, cortex anatomy and structure-function relationships that do not introduce a strong bias.
2.2. Image Acquisition
In this study, we used two specific MR contrasts, namely T1 weighted MPRAGE (Magnetization–Prepared Rapid Acquisition Gradient Echo) and T2 weighted TSE (Turbo Spin–Echo). These two protocols have been chosen because of their myelin sensitivity, and give a good gray/white matter contrast.
We acquired data of 39 subjects in a 3 Tesla scanner (Siemens Trio) using an 8-channel head coil for RX and a body coil for TX. While the typical resolution for structural MRI is 1 mm, we decided to scan at a higher resolution in order to reduce partial volume effects. More specifically, the MPRAGE images were acquired with an isotropic spatial resolution of 0.7 mm (TR = 2500 ms, TE = 4.94 ms, TI = 1100 ms, 7° flip angle, matrix size 320 × 320 × 256, , 1 average), and the TSE images were scanned with 0.7 mm isotropic resolution (TR = 3000 ms, TEeff = 355 ms, matrix size 320 × 320 × 256, , ETL = 161, 1 average). Both scans were acquired for each subject in one session in about 14 and 18 minutes respectively.
Field maps have not been acquired. The product sequences were changed in matrix size and FOV (given by matrix size and pixel resolution), without applying pre-scan normalization.
2.3. Segmentation and Surface Reconstruction
Segmentations and cortical surface reconstructions were obtained from the MPRAGE images using the Freesurfer toolkit (FST). This included by default the re-sampling of the data to 1 mm isotropic resolution, brain extraction, intensity normalization and surface topology correction (for an overview of the underlying algorithms and procedures see Dale et al., 1999;Fischl et al., 1999a, 2001; Ségonne et al., 2004).
The surfaces generated by Freesurfer share the same topology and differ only in their spatial embedding. That is, each mesh vertex is identified via an unique label, and is defined at different coordinates, e.g. on the white/gray matter boundary, the gray matter–CSF boundary and on the inflated mesh.
One important aspect of Freesurfer’s MGZ file format is that the available metadata supports the transformation of each individual brain into a normalized space without modifying the underlying data. For example, the spherical registration w.r.t. the anatomical information present in the “fsaverage” surface modifies the spatial embedding of the surface meshes only. Moreover, it allows registering the MPRAGE image with the TSE image of each subject without re-sampling (i.e. by running spmregister and mri vol2vol with the attribute no-resample). From our experience, an affine transformation of the different brain scans provides sufficient accuracy of the co-registration. Severe differences were not identified by manual inspection using the surface overlays. If the image distortion is low (or similar for both contrasts), the cortical surfaces generated by Freesurfer will then fit both data sets (see Figures 1b and 1c). Other cases should be excluded, or the distortions should be corrected, which was not necessary in the present study.
2.4. Volume-to-Surface Mapping
Our method uses the cortical surfaces for two main reasons. First, the surfaces provide a compact representation and more reliable estimates for the spatial extent and relations of the identified brain regions on the folded cortex. For example, we will use the surfaces in their inflated configurations for visualization purposes. Compared with the original, anatomically correct surfaces, the inflated versions are less occlusive.
Second, it allows us to use the anatomical knowledge that the cortex is a highly folded sheet of gray matter with an average thickness of 2 – 4 mm and a spatially variant columnar and laminar organization to reduce the complexity of the input data prior to analysis (Fischl and Dale, 2000).
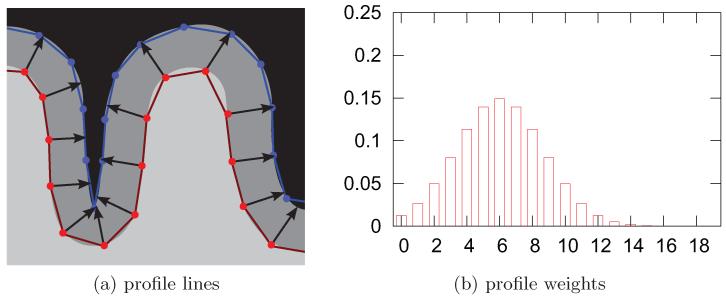
In the cortex-based representation of the MR intensities one value per MR contrast is assigned to each surface vertex. In order to obtain an accurate representation, our mapping approach samples the MR volumes in surface normal direction. It uses orthogonal profile lines from the vertices of the inner cortical surface (see Fig. 2a), and samples the MR intensities along these profile lines at 20 equidistant points. These samples are then averaged in order to generate a value that is representative for the MR intensity of the gray matter over this vertex. The length of each of these profiles is chosen in accordance with the local cortical thickness estimated by Freesurfer (Fischl and Dale, 2000) and determines the local scale of the weighting function.
Figure 2.
This figure illustrates the surface mapping by stochastic sampling of the MR volumes. Fig. (a) shows how transcortical profiles lines were defined, and Fig. (b) shows how the values sampled along these profiles lines were weighted (b). The x-axis in (b) indicates the relative position of the sample, zero denoting the start point on the gray-white matter interface and 19 the last point on the pia mater. The kernel weights are given at the y-axis.
In order to emphasize intensities of the inner two thirds of the gray matter and minimize partial volume effects at the border of the gray matter, these values are combined using a Gaussian weighting function centered on the sixth sample point, see Fig. 2b. Taking samples at 20 equidistant points gives a good trade-off between the numerically optimal approximation of a Gaussian kernel and computational efficiency.
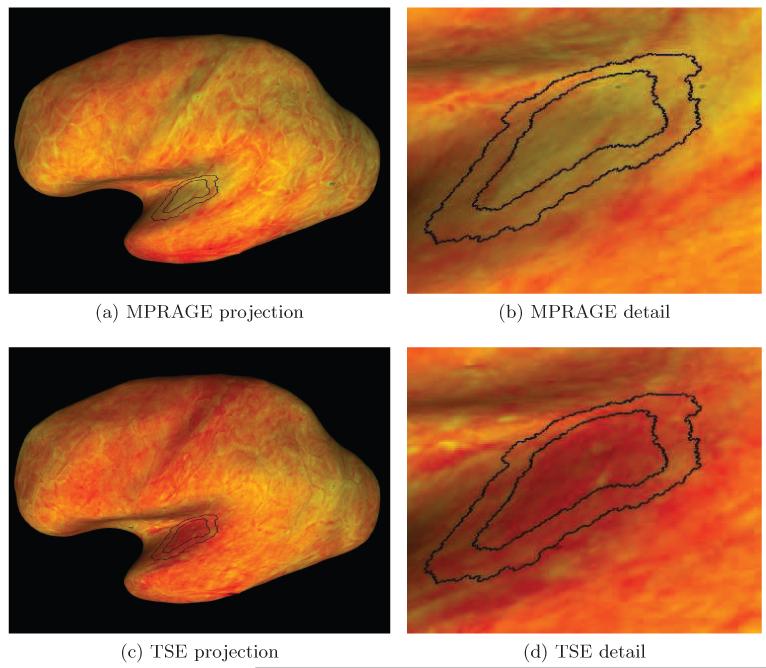
The resulting mapping of the two MR volumes (MPRAGE and TSE) to the cortical surfaces is exemplarily shown for one subject in Figures 3a and 3c.
Figure 3.
This Figure shows the values of MPRAGE (a) and TSE (c) computed for the left hemisphere of one representative subject, and projected onto the inflated inner cortical surface. Figures (b,d) show a portion of the maps centered at the estimated location of the transverse temporal gyrus in detail. The heat scale used for the MPRAGE and TSE values uses red for low and yellow for high intensities. The black lines indicate the boundaries of the initial regions Rin and Rout (cf. Sec. 2.5).
2.5. Properties of The Feature Space
After the MR values were mapped to the surface vertices, each vertex provides a sample in a d-dimensional feature space. Here, d = 2, i.e. this space is spanned by the intensities of the two MR contrasts we acquired.
The resulting feature space cannot be readily analyzed by using a global, unsupervised approach, because intensity variations within the gray matter due to different contribution of the receiver coils and magnetic field inhomogeneities may outweigh the intensity variations caused by the regionally varying cortical myelination. The standard practice of correcting shading artifacts by employing a model of intensity variations within the different tissue types and experimental estimates of the transmit and receive field inhomogeneities may, however, introduce its own bias. To address this problem, rather than modifying the raw data, we take advantage of one important property of these inhomogeneities, namely their low spatial frequency. As indicated by our results, the sensitivity to uncertainty in the intensity variations can be effectively reduced by restricting the feature space analysis to spatially compact regions.
We therefore define two sampling regions on the surfaces, Rin and Rout. As exemplarily shown in Figure 3, these regions are compact and of sufficiently small size regarding the cortex region of interest. Intensity variations caused by magnetic field inhomogeneities within and between these two regions are negligible compared with the global variations, and should not have a significant effect on the performance of the statistical classifier. The inner region Rin is based on the anatomical label “transversetemporal” generated by Freesurfer (Fischl et al., 2004; Desikan et al., 2006). It represents Heschl’s gyrus, whereas the surrounding sampling region Rout is defined as a dilated version of the former.
These regions not primarily define the anatomical search space, but imply an initial classification of the samples that is sufficiently robust to regionally varying cortical myelination due to shading. Moreover, if Heschl’s gyrus has been properly labelled in the individual cortical surfaces, the induced classifier allows to distinguish samples taken from the two differently myelinated tissue classes within the PAC and adjacent non-PAC areas.
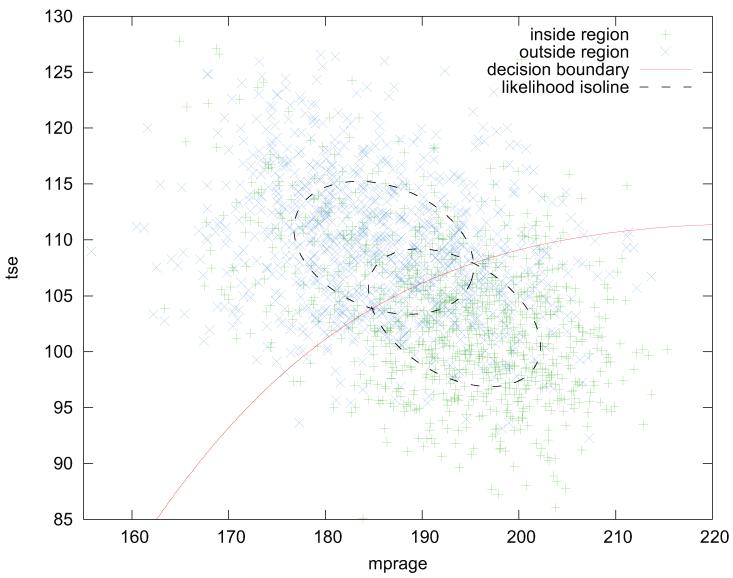
Figure 5 shows a plot of the distribution of feature vectors from both initial regions. Evidently, the samples taken from the inner region (colored in green) are shifted towards increased MPRAGE and decreased TSE intensities compared to the samples taken from Rout. As the inner region is initialized using the “transversetemporal” gyrus label, this observation is in accordance with our presumption of an increased myelination of the PAC, which is related to this gyrus.
Figure 5.
Initial feature space due to the atlas labelling of the “transver-setemporal” gyrus (matching Figs. 3, 4). The shapes of the estimated feature distributions within the inner and outer sampling regions are indicated by dashed isolines. The decision boundary that is imposed by the initial distributional estimates is indicated by the red contour.
Our results indicate that the automatic, atlas-based approach produces sufficiently accurate and robust initializations for the unsupervised tissue classification.
The two MR contrasts only provide partial, indirect information about the myelin content, which can be used to delineate the core areas of the auditory cortex. These presumably comprise three fields according to the myeloarchitectonic literature (e.g. Beck, 1930; Kaas and Hackett, 1998; Hackett et al., 2001; Morosan et al., 2001; Wallace et al., 2002), which show only subtle differences in myelin content. As indicated by the dashed isolines in Figure 5, the MR contrasts reveal clear differences in myelin content between the highly myelinated primary auditory cortex and the less densely myelinated higher order areas adjacent to the PAC. Thus, rather than implying a parcellation into the multiple functionally different auditory cortex fields, the desired classifier will optimally separate the two clusters (k = {in, out}) in the feature space that correspond to the highly myelinated PAC and the less densely myelinated non-PAC areas.
2.6. Mapping the Differences in the Likelihood of Increased Myelin Content
Using the feature space that is defined by the projected MR intensities and the two predefined surface regions, the parameters of a multivariate normal distribution can be estimated for each of the classes k = {in, out}. With these distributions it is possible to assign to each surface vertex a likelihood for following the distribution Lin of features from the inside class (i.e. showing MR intensities similar to those within the highly myelinated PAC region), or the outside distribution Lout (i.e. representing dissimilar MR intensities). Therefore, we evaluate the probability density function,
| (1) |
where d is the number of dimensions of the feature space (in our case d = 2).
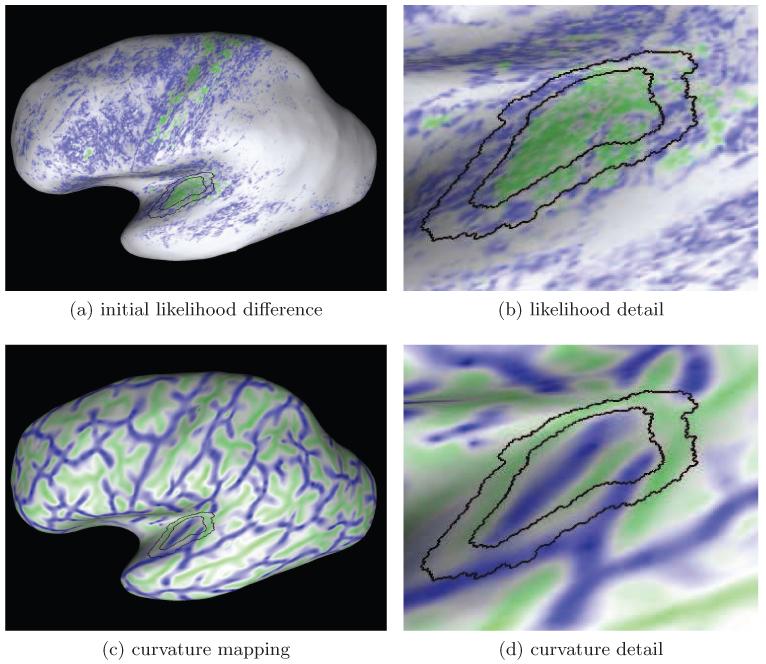
The values Lin – Lout allow a visual representation of the properties of the initial feature space in a convenient manner. For example, Figures 4a and 4b provide a visual display of the map resulting from the classification in terms of a surface overlay, which refers to as likelihood-difference map. The likelihood-difference will be positive (colored in green) if a feature vector is better represented by the inside distribution Lin, negative (i.e. blue) if it is better represented by the outside distribution Lout, or close to zero (i.e. white) if both distributions fit equally well. In order to avoid numerical problems, we use the difference in the values Lin and Lout instead of log-likelihood or likelihood ratios for computing the classification (inside, outside and neither).
Figure 4.
This Figure shows the initial likelihood difference map (a) and the curvature map due to the embedding of the cortical sheet in 3D (c) for the left hemisphere shown in Figure 3. Figures (b,d) show a portion of the maps centered at the transverse temporal gyrus. The color scale in the likelihood-difference map uses blue for negative, white for values near zero and green for positive values. In Figures (c-d) green color indicates positive curvature values (i.e. gyri) and blue color indicates negative curvature (i.e. sulci). The black contours represent the boundaries of the sampling regions.
As a consequence of our local analysis it will be highly probable that likelihood-difference values close to zero represent features fitting neither of the distributions. If the feature values are – due to global inhomogeneities – not comparable to the locally estimated gray value distributions, both likelihoods (Lin and Lout) will be close to zero for many vertices on the surface. Thus, taking the likelihood–difference does not allow for the global analysis of the myelin distribution, but greatly reduces the risk of false positive tissue classifications at the local basis. That is, the likelihood-difference may or may not allow a complete and detailed parcellation of the cortex, but will significantly differ locally between the estimated PAC and non-PAC areas.
2.7. Optimization
Our algorithm compares the two distributions drawn from the regions Rin and Rout. A classifier amplifies the regions’ complementary properties being represented by MR intensities, which are sensitive to myelination. It is therefore critical that the regions are initialized in a way that the inside region will overlap the PAC to a higher degree than the outside region, i.e. contains more samples from the higher myelinated cortical region. This condition is easily fulfilled by the gyrus label “transversetemporal” provided by Freesurfer. The PAC is known to mainly reside on the first transverse temporal gyrus, called Heschl’s gyrus (HG) and the location of HG can therefore be used as anatomical landmark for setting up the initial sampling region Rin in each of the cortical hemispheres under study. The exact shape and extent of the PAC in relation to this simple estimate of a compact, higher myelinated area along HG is, however, not known in individual subjects. Moreover, the initial estimate may be very weak because the quality of the anatomical labelling highly depends on the anatomical information in the Freesurfer atlas, which may not be representative for every subject. That is why the individual PAC estimate is refined in a data-driven optimization.
We use an iterative process for simultaneously optimizing the placement of the regions (Rin and Rout), the resulting likelihood estimates and induced classifier. The optimization is implemented as a gradient ascent in parameter space using the Jensen–Shannon divergence as criterion.
More precisely, we evaluate the separability of the two probability density functions, which are estimated based on the classification induced by the regions Rin and Rout. It is defined as the Jensen–Shannon divergence between two multivariate normal distributions (Bar-Hillel et al., 2006), which is given by
| (2) |
The region Rin is represented as the intersection of an ellipsoid with the inflated surface. This ellipsoid w is defined by the parameter vector
where the center point () is given by the coordinates of a vertex of the inflated surface; three orthogonal unit vectors define the main axes (, and ) with lengths a, b and c. As Rout is a function of the inner region, it has no degrees of freedom (see below).
The parameter values at iteration m ≥ 0 are denoted wm. Initially (m = 0), we define the center vertex to be the surface point closest to the center of mass given by the coordinates of vertices assigned to the aparc label “transversetemporal”. To initialize the axes’ orientation and length, we use the eigenvectors {} and eigenvalues {λi, i = 1, 2, 3}, of the covariance matrix § of the coordinates of the labeled vertices. That is,
The separability criterion (2) is then iteratively maximized by finding in each step the value
i.e. by applying perturbations h to the parameter values wm of the ellipsoid embedding known from the previous iteration. The iterative process stops if no further improvement is being made (i.e. wm+1 = wm). The function h for changing the center point coordinates, rotating and adjusting the lengths of the main axes of an ellipsoid with parameters wm is given by
with
In order to evaluate the divergence DJS(wm’), the regions Rin and Rout have to be reconstructed in each iteration based on the estimates wm’. As before, the inner region Rin is generated by intersecting the reconstructed ellipsoid with the inflated surface. Rout is determined by expanding Rin using a vertex-based dilatation. If the resulting surface patch Rout has approximately twice the size of the inner region, Rin is removed from the outer region.
2.8. Analysis of the Mapping Results
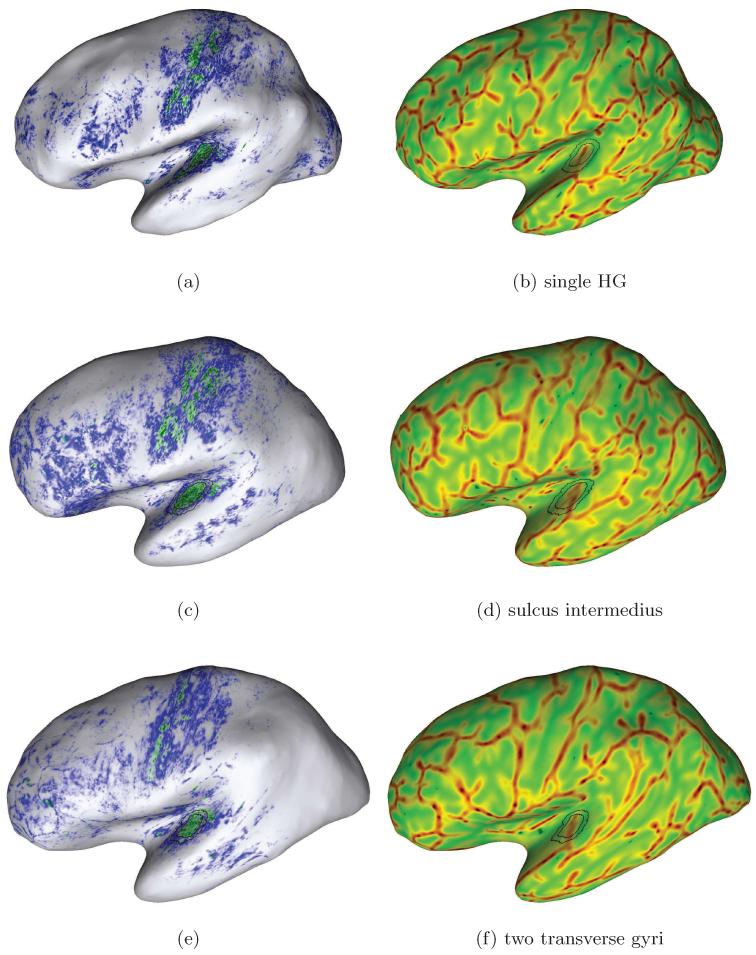
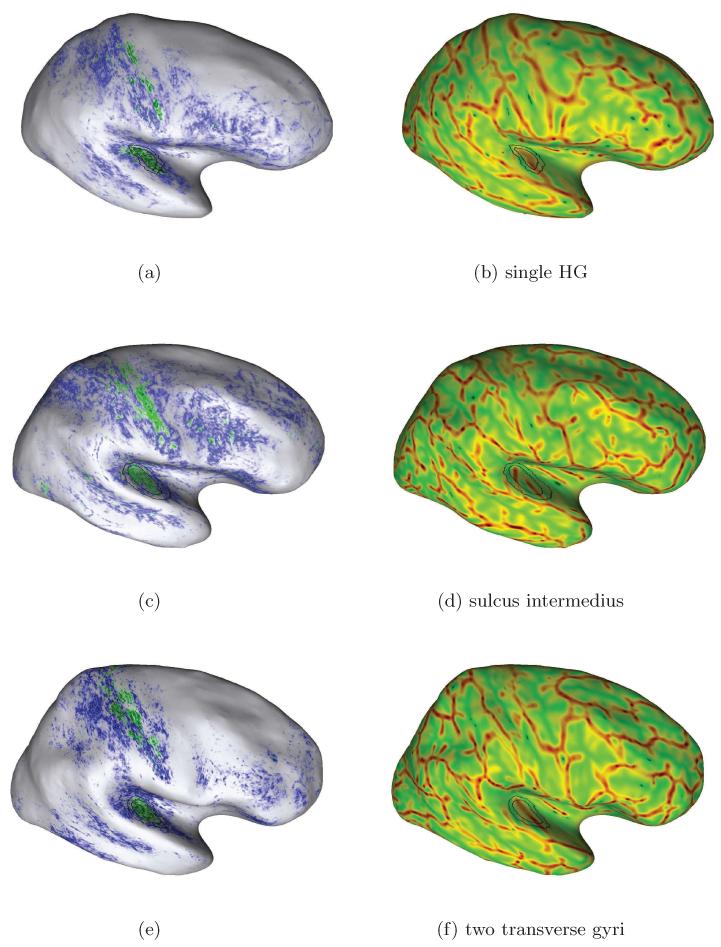
The likelihood-difference maps can be directly used for the systematic evaluation of the method as well as for the validation and comparison of the localization results with anatomic definitions of the PAC (see Figures 7,8, 9 and 10).
Figure 7.
Examples of individual mapping results due to our approach for in-vivo localization of the human PAC area. Each row shows the likelihood map (left) and curvature overlay (right) for one of our subjects. The final sampling regions are drawn in each map for anatomical orientation. Here, we selected subjects with different temporal cortex anatomy in the left hemispheres: Heschl’s gyrus with (second row) and without sulcus intermedius (top and bottom) and one subject with an additional transverse temporal gyrus (bottom row). A higher myelinated region (green labelling) of plausible size can be identified on the medial two thirds of Heschl’s gyrus in each hemisphere (cf. Sect. 3.2).
Figure 8.
Additional examples of individual mapping results due to our approach for in-vivo localization of the human PAC area. Here, we selected further subjects with different temporal cortex anatomy in the right hemispheres: Heschl’s gyrus with (second row) and without sulcus intermedius (top and bottom) and one subject with an additional transverse temporal gyrus (bottom row). A higher myelinated region (green labelling) of plausible size can be identified on the medial two thirds of Heschl’s gyrus in each case (cf. Sect. 3.2).
Figure 9.
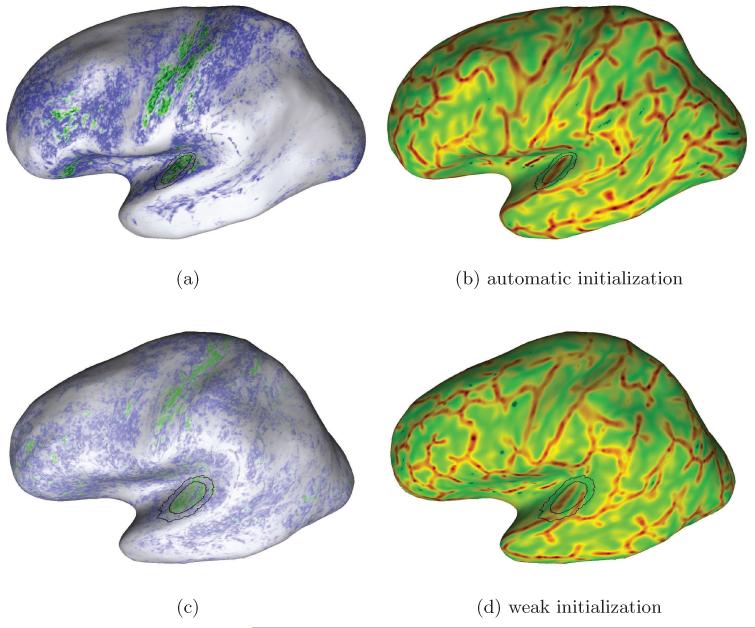
This figure compares mapping results due to the automatic (top row) and weak initializations (bottom) of the sampling regions. As discussed in Section 3.1, the mis-initialization of the inner sampling region over the second transverse temporal gyrus (bottom row) affects the discriminatory power of the classifier. In these cases the PAC region tends to be overestimated in individual subjects, and the overall likelihood-difference (i.e. intensity of the labellings) tends to decrease.
Figure 10.
Mapping results due to the automatic initialization (middle row) of the sampling regions and the initialization in the motor cortex area (bottom row) for two subjects. The black contours in Figs. 10e and 10f represent the primary motor cortex in terms of a probability map of BA 4p taken from the Freesurfer atlas at the threshold p > 0.1 (FST). In both hemispheres and cases, the regions of hyper-intense green labelling within the temporal cortex represent anatomically correct in-vivo estimates of the individual PAC area. Notice that the overall likelihood patterns were largely unaffected, i.e. the discriminatory power of the statistical classifier was comparable in both cases of initialization. This demonstrates the robustness of our method to atlas-based initialization.
In the present study, we also investigated the robustness of the proposed classification approach to initialization and optimization (i.e. sampling and weighting) parameters. An extensive further evaluation of a possible bias due to imaging and model errors, e.g. in the pre-processing steps of the Freesurfer pipeline, further improvements and fine-tuning of the mapping approach will be subject to future work.
A histogram analysis has been performed to assess the robustness of the optimization to the initial anatomical labelling of the gyrus–based (“transversetemporal”) region of interest (cf. Desikan et al., 2006). The proposedlocal approach can be expected to fail in cases where the underlying assumption does not hold that the inner sampling region Rin overlaps the highly myelinated PAC to a higher degree than the region Rout. Due to the inherent limitations of image registration techniques to precisely map brain regions of high anatomical variability, the initial, atlas-based estimate of the inner sampling regions in the individual brains may or may not properly cover Heschl’s gyrus, and the contained PAC area, respectively. The robustness of our method to initialization error has been shown by comparing the estimated parameters of the joint distribution of likelihood values over the entire hemispheres due to the automatic, atlas-based initialization of Rin (case 1) and selectively introduced initialization error (cases 2 and 3). For the case study 2, the over- and underestimation of the shape and location of HG have been simulated by largely perturbing the parameter values wm, m = 0, of the automatically estimated ellipsoid embedding. More precisely, we let
For case study 3, we selected subjects with multiple transverse temporal gyri and systematically mis-initialized Rin on the second transverse temporal gyrus. We also initialized Rin within the motor cortex region of single subjects and compared the different mapping results.
Further, the results due to the Gaussian weighing of the raw MR intensities have been compared with that due to an experimentally defined optimal kernel.
The anatomical information provided by the curvature overlays (see, e.g. Fig. 7) helps neuroscientists to identify hyper–intense patches (i.e. compact cortex regions with high likelihood–difference values) in the temporal region of each individual hemisphere and to compare the location and extend of these regions with anatomic definitions of the human auditory cortex due to Brodmann (1909); von Economo and Horn (1930); Morosan et al. (2001).
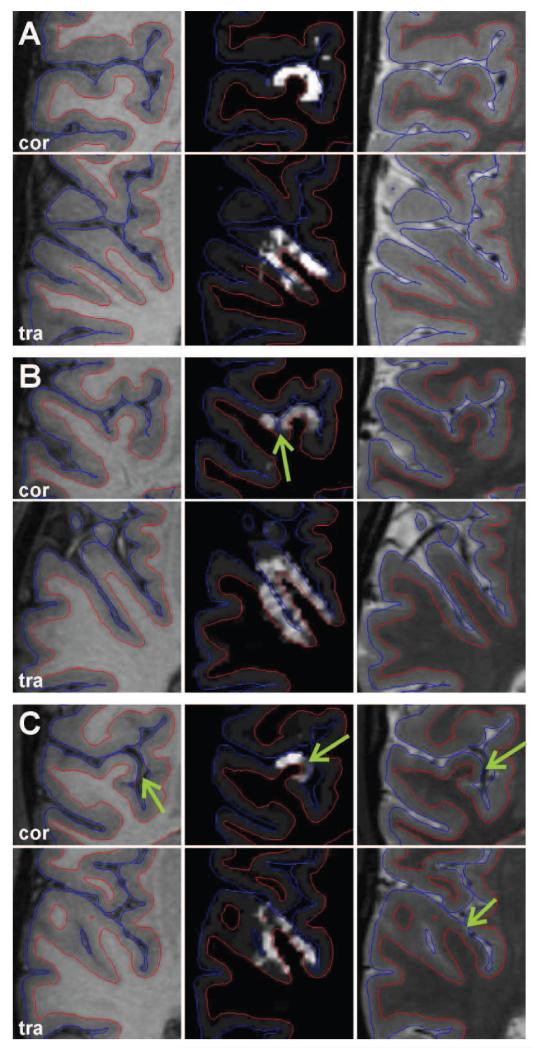
In addition to the surface overlays we used volumetric representations of the resulting maps in the form of gray matter ribbons (Fig. 11). These ribbons have been initialized as empty matrices that are in register with the underlying MR data sets and have the same spatial resolution. The positive likelihood-difference values have then been projected from the vertices back to voxels between the individual anatomical surfaces, such that locally maximum intensities in the ribbons indicate the PAC region and possibly further areas with similar tissue properties (middle column in Fig. 11). The superimposed pial surfaces and gray-white matter boundaries (blue and red contours in Fig. 11) provide anatomical information and support the visual inspection of the results. These individual 3D representations have been used for the analysis of possible misclassifications due to partial volume effects and artifactual intensity fluctuations present in the MR data, as well as pre-processing and mapping errors.
Figure 11.
Auditory cortex area of three individual brains (A, B, C) in coronal and transversal views. The middle column shows the cortical area with high likelihood-difference values. The corresponding T1 weighted and T2 weighted images are shown in the left and right columns, respectively. The red and blue contours indicate the location of the inner and outer cortical boundary, respectively. The arrows point at erroneous classification results which are due to segmentation errors (B) or artifacts in the anatomical data due to large blood vessels (C).
2.9. Evaluation of the PAC Estimate
In combination with the anatomical information provided by the MPRAGE volumes, the gray matter ribbons have been used to compare the location, shape and extent of the individual PAC estimates with anatomic definitions of the human PAC according to Brodmann (1909); von Economo and Horn (1930); Morosan et al. (2001).
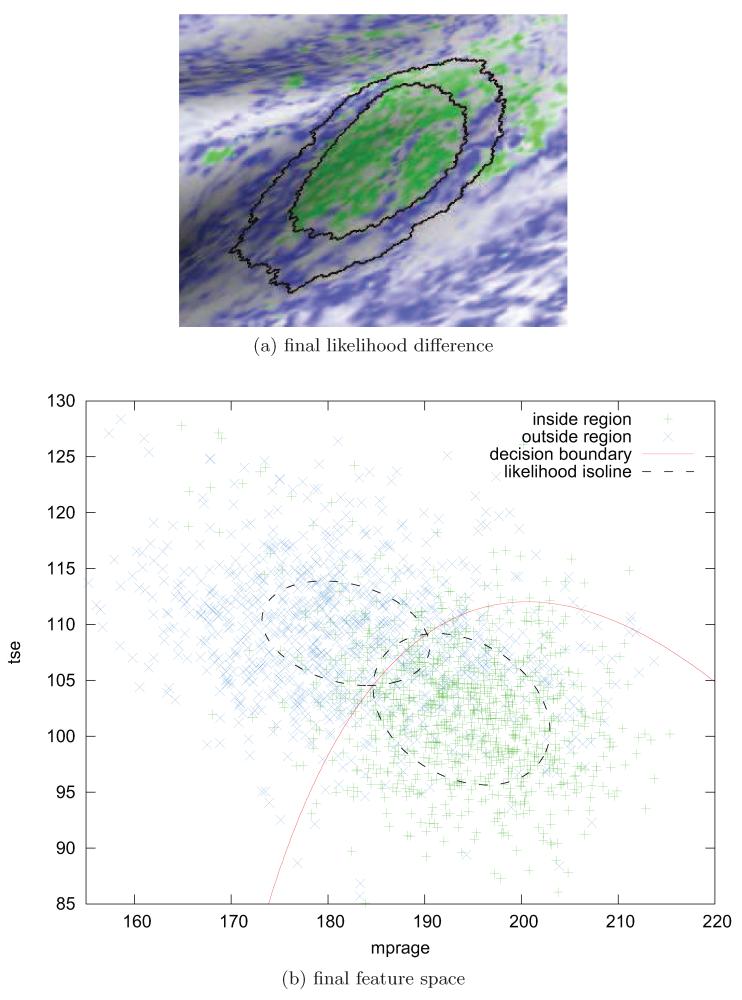
Since our algorithm does not employ smoothness constraints, it does not necessarily provide accurate segmentations of the cortex regions of interest. The chosen constraints rather imply a classification of the MR features, from which a segmentation of the PAC regions could be derived in a further step. For example, the contour shown in Figure 6a has been drawn after convergence based on the parametrization of the optimal sampling region Rin. It indicates the location of the PAC estimate in one of our subjects, but does not represent the PAC area boundary. In this case, the optimal, elliptic sampling region underestimates the PAC area, and does not completely cover the hyper–intense surface patch that can be considered as the PAC. While being relatively straightforward for a neuroscientist to outline the corresponding surface region based on the color-coded overlay and anatomical knowledge, the automatic segmentation must be seen as an ill-posed, inverse problem. This is due to the fact that the solution does not continuously depend on the data (as both, the raw input data and the final in-vivo maps provide noisy and incomplete information), while the problem may have multiple possible solutions (because the shape and spatial extend of the PAC area may vary dramatically across subjects and hemispheres). These difficulties can be alleviated by imposing additional constraints – in form of variational principles or information about the statistical properties of the solution space (e.g. a model of the human PAC shape variation) – into an adequate segmentation algorithm, which will be subject to future work. Hence, the surface overlays were used here in combination with the location of the final contours to manually inspect the underlying hyper–intense regions within the temporal lobes (green color in Figs. 7 to 10) w.r.t. their spatial extend and homogeneity.
Figure 6.
This Figure shows in (a) the final estimate of the PAC region as the green labelled surface patch together with the deformed contour of the inner sampling region due to the initial atlas label in black for the same data set used in Figs. 3, 4. Notice the increase in hyper–intensities within the PAC estimate compared with the initial likelihood mapping in Fig. 4b. Fig. (b) shows the feature space after optimization of the distributional estimates and induced classifier. The underlying MR feature distributions are optimally separable compared with the two clusters in Fig. 5.
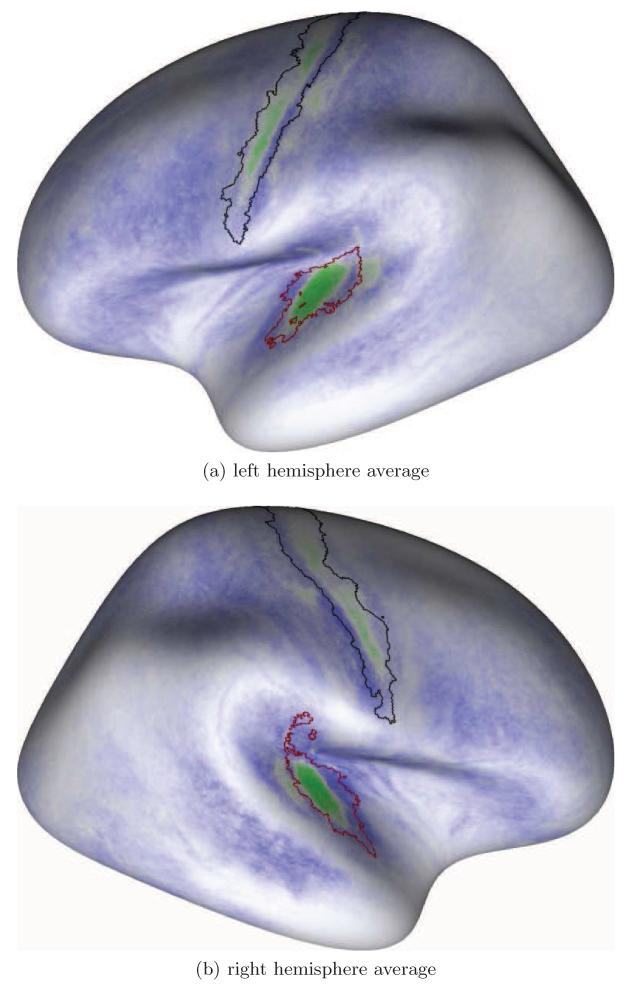
Further, group average maps have been computed over the left and right hemispheres and directly compared with the maximum probability maps of the PAC due to Morosan et al. (2001) (see Fig. 13). Therefore, the surfaces have been aligned across individuals using spherical registration (Fischl et al., 1999b) with the anatomical information present in Freesurfers “fsaverage” template and then the individual likelihood of increased myelination has been averaged at each surface node. Areas in the population average map were finally identified by comparisons with the probabilistic cytoarchitectonic areas of interest that have been independently mapped to the Freesurfer template. In order to generate the surface label for region Te1 the volume-based maximum probability map of each post-mortem subject provided by Morosan et al. (2001) has been mapped to a surface reconstruction of the subject’s cortical hemispheres. These surfaces have then been brought into register as described above and the individual surface labels were mapped to the “fsaverage” surface using a vertex-wise logical disjunction. As a result, the red contour in Figure 13 encloses the maximum extent of region Te1 in the surface-based maximum probability maps of Te1.
Figure 13.
Likelihood-difference maps averaged across all subjects. Green areas indicate population average regions with higher myelin content. The region of hyperintense green labelling within the temporal cortex is our probabilistic in-vivo estimate of the PAC area. The red line represents the maximum probability for the boundary of area Te1, i.e. the PAC area as defined in post-mortem brains (Morosan et al., 2001) and projected onto the template surface. The black contour represents the primary motor cortex in terms of a probability map of BA 4p taken from Freesurfer at p > 0.1 (FST).
3. Results
In our study, the algorithm always converged after 10 to 25 iterations and identified a higher myelinated region of plausible size on the medial two thirds of Heschl’s gyrus in each of the 78 hemispheres. Representative examples are provided in Figures 7 and 8. The optimization strategy with default parametrization boosted effects of differences in the tissue–specific MR properties between the primary and secondary auditory cortex areas.
3.1. Robustness of the Classification Algorithm
We found evidence that the presented analysis is robust to initialization. The over-simplified shape constraint in combination with a lower bound on the sampling region size effectively prevented trivial solutions (i.e. the inside region did not converge into a single point or became too large to allow correct classifications) without imposing a strong bias on the individual shape and size of the PAC estimates. The atlas-based approach produced sufficiently accurate and robust initializations, from which the final estimates identified a higher myelinated region of plausible size on the medial two thirds of Heschl’s gyrus in all hemispheres under study (see Sect. 3.2).
Another strong hint for the robustness of the method to initialization is provided by the observed regions that indicate primary cortex areas beyond the PAC (see Sect. 3.2).
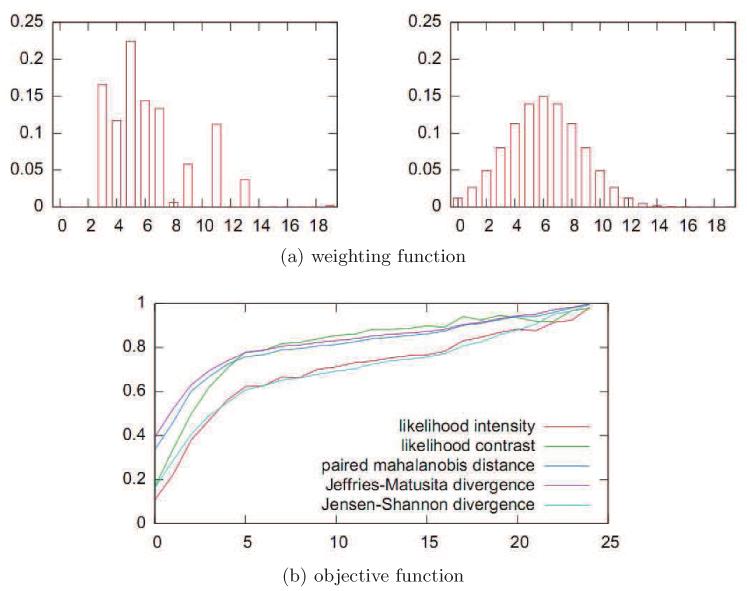
Furthermore, the Gaussian weighting of MR intensities along the normal profiles provided a good approximation of the weighting that optimized the separability of the distributions induced by the initial classifier (see Fig. 12a).
Figure 12.
Evaluation of the robustness of the algorithm: Fig. (a) indicates that the experimentally defined optimal weighting (left) can be approximated by a Gaussian kernel (right) that is centered and scaled such that MR values sampled from the lower layers of the gray matter are emphasized. (b) shows the experimental behavior of the Jensen–Shannon divergence (light blue curve) and other possible choices for the objective function during optimization (here, over 23 iterations).
Optimization of the Jensen–Shannon divergence (Eq. 2) resulted in fitting the inside region to a cortex region with positive likelihood–difference, and hence higher myelination. Figure 12b shows that the algorithm always converged after 10 to 25 iterations and produced comparable results for further possible choices for the objective function. That is, optimizing the Jensen–Shannon divergence optimized other criteria as well. There were, however, advantages of the chosen criterion, most importantly that the Jensen-Shannon divergence encouraged reasonably small regions and ensured convergence of the gradient ascent implementation. Local classification errors, as further discussed below, did not appear in the group average map in Figure 13, and could be attributed to sampling error rather than ill-posed optimization criteria.
The myelin maps were robust to the precision of the automatic initializations (case 1). However, as expected, the local approach failed in cases where the inner sampling region Rin did not overlap the highly myelinated PAC to a higher degree than the region Rout. We observed no significant difference (i.e., p > 0.2, paired t-tests) in the parameters of the joint distribution of likelihood values in the resulting surface overlays when comparing the automatic (case 1) and weakened (case 2) initial estimates. However, the results differ significantly when reducing the histogram analysis from the entire cortical hemispheres to the temporal lobes only. In particular, a mis-initialization of the inner sampling region on the second transverse temporal gyrus, if present, yielded misclassifications. As visible in Figure 9, in these cases the PAC region tends to be overestimated in individual subjects, while the overall likelihood-difference and the discriminatory power of the classifier tends to decrease. This effect is indicated by the less intense labelling in Figure 9c compared with Figure 9a. An exception was observed in case study 3: We found no striking impact of the initializations in the motor cortex on the shape and location of the individual PAC estimates (see Figure 10). This clearly indicates the robustness of the method to initialization given that the inner sampling region Rin overlaps a region with tissue properties that are similar to those of the highly myelinated PAC.
3.2. Shape, Anatomical Location and Spatial Extent of the PAC Estimate
The group result given in Figure 13 shows that the average location of the PAC area as defined by our method in-vivo (the intense green pattern in Fig. 13) is well within the maximum probability location of the primary auditory cortex (red line in Fig. 13) as defined in post-mortem brains by Morosan et al. (2001). The regularity of the pattern even indicates that our method provides a more compact definition of the PAC region across subjects compared with the surface-based representation of area Te1. More precisely, the location of strongest labelling with a more medial geometric center compared to the maximum probability map for Te1 may suggest a better correspondence to areas Te1.1 and Te1.0. However, this observation needs further investigation. Also, it must be noted that the maximum probability map of the PAC region is originally defined in post-mortem volume data and had to be brought into register with the template surface shown in Figure 13. Observed differences in the shape of the in-vivo and post-mortem estimates of the PAC area may be attributable to registration error.
A second auditory area of less intense labeling was observed in the group map posterior to the medial part of Heschl’s gyrus outside the probability map for primary auditory cortex.
We did not repeatedly observe hyper–intense patches on planum polare such as identified in the R1-maps by Sigalovsky et al. (2006). The single observations were cancelled out in the group map.
The green pattern enclosed by the black contour in Figure 13 indicates that the primary motor cortex can be identified in the group map.
In addition to the primary auditory and motor cortex regions, we further observed less intense patches of labeling within the location of the somatosensory cortex posterior to the motor cortex. In direct comparison with the results presented by Glasser and Van Essen (2011); Dick et al. (2012) and anatomic definitions of the primary motor and somatosensory cortices (e.g. Brodmann, 1909), these estimates were less reliable.
The primary visual cortex was not apparent in the group result. Our algorithm classified the MR feature values within the visual cortex as fitting “neither” known local distribution (indicated by the white labelling in Figure 13).
On a single subject level, visual inspection of the results showed that a region on the medial two thirds of Heschl’s gyrus was labelled in each subject and hemisphere (see Figures 7, 8 and 11 for examples of in-vivo maps of single subjects with different temporal cortex anatomy). This area can be identified in each of the individual brains under study with a similar precision compared to the population-average map.
However, depending on the signal to noise ratio of the anatomical data, which mainly depends on the subjects head motion during the anatomical scans, the likelihood–difference values can vary (compare Figs. 11A and 11B). Furthermore, misclassifications could be observed that are due to artifacts in the MR, such as artifacts produced by blood flow within large vessels (Fig. 11C). We also observed errors in segmentation especially in deep sulci that introduce large bias to the classification result, and alter the homogeneity and shape of the estimated cortex regions.
4. Discussion
The results of our study show that the proposed local, data-driven approach is able to boost the effects of the differences in the measured tissue properties between the PAC and secondary auditory cortex. These differences are mainly due to higher myelin content within lower layers of primary cortical areas that have been adequately emphasized by the definition of the profile lines and Gaussian weighting (Fig. 2). The primary auditory cortex area due to the statistical classifier could be identified in all individual subjects with a similar precision compared to the population-average map and is in close correspondence with anatomic definitions of the PAC.
We are fully aware of the problem that there is currently no gold standard of defining the PAC in vivo. Therefore any firm conclusion on the power of in vivo architectonic methods in general and ours in particular must await future progress in tonotopic mapping and/or combined in-vivo and subsequent post-mortem studies (e.g. Seewann et al., 2012) on the same subjects. However, comparison with the current state of the art, i.e. the probabilistic maps provided by Morosan et al. (2001) suggests the feasibility of our approach. Its full potential must, however, be refined in future studies (see below).
A second argument on the feasibility of our approach is that it elucidated a second auditory area with high myelin content located posterior to the medial part of Heschl’s gyrus. Its location is outside the probability map for primary auditory cortex as defined by cytoarchitecture (Morosan et al., 2001), but may be consistent to the medial part of area ttrII described by Beck (1930) as an area that is most similar to the primary areas w.r.t. myelin content. Wallace et al. (2002) described an area PA with a similar location and also stated that the myelin staining profile was similar to that of the PAC area. A similar auditory area was also observed in some subjects of a tonotopic fMRI study by Formisano et al. (2003) and more recently by Dick et al. (2012) using functional and myeloarchitectonic mapping. This second auditory area has not been described by Sigalovsky et al. (2006) possibly due to lower resolution and/or field strength. Also the study of Glasser and Van Essen (2011) did not resolve this additional area possibly due to the whole brain approach and compensation of MR intensity variations (by bias field and outlier removal, re-sampling and smoothing). The benefit to be gained from the combination of d ≥ 1 MR contrasts to reduce the labelling of non-PAC areas on planum temporale thus needs further investigation.
Our method further generated feasible labellings in the group map along the pre- and post-central gyri, corresponding to the strongly myelinated primary motor cortex and somatosensory cortex, which is also a primary region. These results demonstrate the validity and robustness of our method, since our classifier was optimized for the localization of the auditory cortex region.
However, the primary motor and somatosensory cortices have been more clearly revealed by recent global approaches that are based on alternative concepts for myelin mapping, for example Glasser and Van Essen (2011);Dick et al. (2012). Reduction of the MR signal inhomogeneities due to different sensitivities of the MR coil elements could probably delineate these regions more clearly in future studies. We are convinced that methods will be developed that produce more homogeneous data than we used in this study. Moreover, we think that with homogeneous data our method would work without the atlas-based initialization step. The impact of field inhomogeneities and the bias due to (local) curvature and anatomical labelling nonetheless need further investigation.
The primary visual cortex was not apparent in the group result, presumably due to larger intensity variations and partial volume effects in this cortex region. It is well known that automatic segmentation does not reliably extract the primary visual cortex due to the comparatively small cortical thickness. It is common practice to manually refine automated segmentations and correctly identify the pial surface and gray–white matter boundary (e.g. Schira et al., 2009). The result of our study suggest that the unsupervised, local approach does not account for such variations in the measured tissue properties and for possible sampling error due to suboptimal pre-processing.
We found evidence that our method is robust to the chosen constrains on the sampling and optimization parameters. The data–driven approach is however sensitive to the signal to noise ratio of the anatomical data that mainly depends on the subjects head motion and spatial resolution of the MR measurements. Partial volume effects and possible artifacts in the MR data (e.g. due to blood flow within large vessels) caused misclassifications. Although these misclassifications were rather small in size, this is a serious problem that can only be solved in an automatic way if the data are acquired at higher spatial resolution. Unfortunately, this is not feasible due to toolong scan time and head motion. However, averaging repeated scans of single subjects acquired in several sessions and using e.g. a 32 channel coil instead of only 8 channels as done here could improve the signal to noise ratio and thus the precision of the localization of PAC in individual brains.
5. Conclusion
We presented a fully automatic method that was shown to be able to define the human primary auditory cortex area in vivo. A statistical classifier was applied to a combination of anatomical MR intensities to compute individual maps of regional differences in the myelin content in cortical gray matter. The primary auditory cortex area due to the classifier could be identified in individual subjects with a similar precision compared to the population-average map and exhibited close correspondence with anatomic definitions of the PAC.
In contrast to previous work, our method is based on a standard atlas for observer-independent initialization and simple prior models of cortex anatomy and regional myelin content homogeneity. Most notably, our results showed that the PAC area can be estimated without resorting to re-sampling and surface–based smoothing of the data, as well as removal of artifacts and outliers in the raw data. This largely avoids bias at the cost of obtaining neither necessarily smooth segmentations of the PAC, nor a complete, detailed parcellation of the entire cortices of individuals. However, the method may be improved towards smooth area delineation by adapting more sophisticated, global optimization schemes, e.g. combinatorial approaches such as graph cuts (Rohkohl and Engel, 2007), for template–free simultaneous classification and estimation under spatial smoothness constraints.
As this method is based on conventional anatomical MR images, the necessary data can be acquired on a routine basis. Thus, the primary auditory and also motor cortex areas could be extracted from the data of exactly those subjects who participated in an MR experiment and be used as specific templates for fMRI data analysis. Future validations must determine whether such an approach is more precise than using probability maps defined in post-mortem data(e.g. Fischl et al., 2008; Tahmasebi et al., 2009). To use this method for single subject delineation of the PAC area from neighboring secondary cortex, the data must be improved e.g. by minimizing head motion and/or averaging across repeated scans, by correcting for global intensity variations during data acquisition, by eliminating small artifacts produced by blood vessels and by improving automatic cortex segmentation. In particular precise segmentations of the gray matter would provide the necessary prerequisite for several model-based improvements and possible fine-tuning of the in-vivo maps: It is for example known that the myelin content varies with curvature and cortical thickness, and the measured MR intensities may be adjusted to compensate for this effect (e.g. Sereno et al.,2012). A more sophisticated sampling of the MR volumes in radial distance or a curvature-dependent weighting of the samples may then much better account for regional differences in the “true” columnar organization and compression of the lower cortex layers (as apparent in Fig. 1a) and reveal much smoother, more clearly separable PAC areas in the individual maps.
To further increase the quality of the results, it may be beneficial to utilize ultra-high field MRI (Duyn, 2012a; Cohen-Adad et al., 2012) and/or other MR contrasts, e.g. proton density, magnetization transfer, or susceptibility weighted imaging (Duyn, 2012b) to exploit additional complementary tissue information that more clearly reveal the myeloarchitectonic differences between the multiple human cortex areas. Finally, the results in single subjects must be compared to other means of defining the primary auditory cortex, i.e. by tonotopic mapping experiments using high resolution fMRI.
We think that the proposed classification approach supports a multi-modal approach of joint functional detection and estimation of specific brain regions in-vivo. In contrast to previous work, inclusion of further MR scans as well as functional activation maps (and possibly data from other modalities at different resolution) is straightforward. Adding data sets would simply alter the dimensions d of the feature space. Our approach further supports the quantitative evaluation of the benefit to be gained from additional experimental data. Moreover, it preserves the spatial resolution and specificity of current MRI by largely avoiding the unquantifiable bias possible due to re-sampling, correction and smoothing of the raw data. This is essential for the robust localization and precise delineation of the human PAC areas, and even more so of higher-order functional fields.
Highlights.
Fully automatic definition of human primary auditory cortex in-vivo.
Conventional 3 Tesla anatomical data are sufficient for the method.
Unsupervised approach without bias-field removal or resampling.
Results reveal a secondary area known to be highly myelinated.
Acknowledgment
The authors would like to thank Katrin Amunts and Patricia Morosan for providing the probability maps of Te1 and Te2 and Monika Dobrowolny for data acquisition. The work was supported by the BMBF grant “Prosody and Song”(FKZ: 01GW0621),the DFG SFB-TRR 31 “Active Listening”, and 5P41EB015896-15, the center for functional neuroimaging technologies.
Footnotes
Publisher's Disclaimer: This is a PDF file of an unedited manuscript that has been accepted for publication. As a service to our customers we are providing this early version of the manuscript. The manuscript will undergo copyediting, typesetting, and review of the resulting proof before it is published in its final citable form. Please note that during the production process errors may be discovered which could affect the content, and all legal disclaimers that apply to the journal pertain.
References
- Bar-Hillel A, Spiro A, Stark E. Spike sorting: Bayesian clustering of non-stationary data. J Neuroscience Nethods. 2006;157(2):303–316. doi: 10.1016/j.jneumeth.2006.04.023. 11. [DOI] [PubMed] [Google Scholar]
- Beck E. Die Myeloarchitektonik der dorsalen Schl̈afenlappenrinde beim Menschen. J. Psychol. Neurol. 1930;41:129–263. 2, 9, 18. [Google Scholar]
- Bridge H, Clare S, Jenkinson M, Jezzard P, Parker AJ, Matthews PM. Independent anatomical and functional measures of the v1/v2 boundary in human visual cortex. Journal of Vision. 2005;5(2):93–102. doi: 10.1167/5.2.1. ISSN 1534-7362. 3. [DOI] [PubMed] [Google Scholar]
- Brodmann K. Vergleichende Lokalisationslehre der Großhirnrinde. Johann Ambrosius Barth; Leipzig: 1909. 2, 3, 4, 13, 14, 17. [Google Scholar]
- Clarke S, Rivier F. Compartments within human primary auditory cortex: evidence from cytochrome oxidase and acetylcholinesterase staining. Eur J Neurosci. 1998;10(2):741–745. doi: 10.1046/j.1460-9568.1998.00043.x. 2. [DOI] [PubMed] [Google Scholar]
- Cohen-Adad J, Polimeni JR, Helmer KG, Benner T, McNab JA, Wald LL, Rosen BR, Mainero C. T 2* mapping and b 0 orientation-dependence at 7t reveal cyto- and myeloarchitecture organization of the human cortex. NeuroImage. 2012;60(2):1006–1014. doi: 10.1016/j.neuroimage.2012.01.053. 21. [DOI] [PMC free article] [PubMed] [Google Scholar]
- Da Costa S, van der Zwaag W, Marques JP, Frackowiak RSJ, Clarke S, Saenz M. Human primary auditory cortex follows the shape of heschl’s gyrus. J Neuroscience. 2011;31(40):14067–14075. doi: 10.1523/JNEUROSCI.2000-11.2011. 2, 4. [DOI] [PMC free article] [PubMed] [Google Scholar]
- Dale AM, Fischl B, Sereno MI. Cortical Surface-Based Analysis 1. Segmentation and Surface Reconstruction. Neuroimage. 1999;9(2):179–194. doi: 10.1006/nimg.1998.0395. 6. [DOI] [PubMed] [Google Scholar]
- Desikan RS, Ségonne F, Fischl B, Quinn BT, Blacker D, Dickerson BC, Buckner RL, Dale AM, Maguire RP, Hyman BT, Albert MS, Killiany RJ. An automated labeling system for subdividing the human cerebral cortex on mri scans into gyral based regions of interest. Neuroimage. 2006;31(3):968–980. doi: 10.1016/j.neuroimage.2006.01.021. 8, 12. [DOI] [PubMed] [Google Scholar]
- Dick F, Tierney AT, Lutti A, Josephs O, Sereno MI, Weiskopf N. In vivo functional and myeloarchitectonic mapping of human primary auditory areas. J Neuroscience. 2012;32:16095–16105. doi: 10.1523/JNEUROSCI.1712-12.2012. 2, 4, 17, 18, 19. [DOI] [PMC free article] [PubMed] [Google Scholar]
- Duyn JH, van Gelderen P, Li TQ, de Zwart JA, Koretsky AP, Fukunaga M. High-field MRI of brain cortical substructure based on signal phase. Proc Natl Acad Sci USA. 2007;104:11796–11801. doi: 10.1073/pnas.0610821104. 3. [DOI] [PMC free article] [PubMed] [Google Scholar]
- Duyn JH. The future of ultra-high field mri and fmri for study of the human brain. NeuroImage. 2012a;62(2):1241–1248. doi: 10.1016/j.neuroimage.2011.10.065. 21. [DOI] [PMC free article] [PubMed] [Google Scholar]
- Duyn JH. Mr susceptibility imaging. Journal of Magnetic Resonance. 2012b doi: 10.1016/j.jmr.2012.11.013. 21. [DOI] [PMC free article] [PubMed] [Google Scholar]
- Eickhoff S, Walters NB, Schleicher A, Kril J, Egan GF, Zilles K, Watson JD, Amunts K. High-resolution MRI reflects myeloarchitecture and cytoarchitecture of human cerebral cortex. Hum Brain Mapp. 2005;24:206–215. doi: 10.1002/hbm.20082. 3. [DOI] [PMC free article] [PubMed] [Google Scholar]
- Fischl B, Dale AM. Measuring the thickness of the human cerebral cortex from magnetic resonance images. Proceedings of the National Academy of Sciences of the United States of America. 2000;97(20):11050. doi: 10.1073/pnas.200033797. 7. [DOI] [PMC free article] [PubMed] [Google Scholar]
- Fischl B, Sereno MI, Dale AM. Cortical Surface-Based Analysis 2. Inflation, Flattening, and a Surface-Based Coordinate System. Neuroimage. 1999a;9(2):195–207. doi: 10.1006/nimg.1998.0396. 6. [DOI] [PubMed] [Google Scholar]
- Fischl B, Sereno MI, Tootell RBH, Dale AM. High-resolution intersubject averaging and a coordinate system for the cortical surface. Human Brain Mapping. 1999b;8(4):272–284. doi: 10.1002/(SICI)1097-0193(1999)8:4<272::AID-HBM10>3.0.CO;2-4. 15. [DOI] [PMC free article] [PubMed] [Google Scholar]
- Fischl B, Liu A, Dale AM. Automated manifold surgery: constructing geometrically accurate and topologically correct models of the human cerebral cortex. IEEE Transactions on Medical Imaging. 2001;20(1):70–80. doi: 10.1109/42.906426. 6. [DOI] [PubMed] [Google Scholar]
- Fischl B, Van Der Kouwe A, Destrieux C, Halgren E, Segonne F, Salat DH, Busa E, Seidman LJ, Goldstein J, Kennedy D, et al. Automatically parcellating the human cerebral cortex. Cereb Cortex. 2004;14(1):11. doi: 10.1093/cercor/bhg087. 8. [DOI] [PubMed] [Google Scholar]
- Fischl B, Rajendran N, Busa E, Augustinack J, Hinds O, Yeo BT, Mohlberg H, Amunts K, Zilles K. Cortical folding patterns and predicting cytoarchitecture. Cereb Cortex. 2008;18(8):1973–80. doi: 10.1093/cercor/bhm225. 2, 3, 20. [DOI] [PMC free article] [PubMed] [Google Scholar]
- Flechsig P. Bemerkungen über die Hörspḧare des menschlichen Gehirns. Neurol. Zentralbl. 1908;27:2–7. 50-57. 2. [Google Scholar]
- Formisano E, Kim DS, Di Salle F, van de Moortele PF, Ugurbil K, Goebel R. Mirror-symmetric tonotopic maps in human primary auditory cortex. Neuron. 2003;40:859–869. doi: 10.1016/s0896-6273(03)00669-x. 2, 18. [DOI] [PubMed] [Google Scholar]
- FST The FreeSurfer toolkit (and Brodmann area labels) 6:36–39. URL http://surfer.nmr.mgh.harvard.edu/ [Google Scholar]
- Galaburda A, Sanides F. Cytoarchitectonic organization of the human auditory cortex. J Comp Neurol. 1980;190:597–610. doi: 10.1002/cne.901900312. 2. [DOI] [PubMed] [Google Scholar]
- Glasser MF, Van Essen DC. Mapping human cortical areas in vivo based on myelin content as revealed by t1- and t2-weighted mri. J Neuroscience. 2011;31(32):11597–11616. doi: 10.1523/JNEUROSCI.2180-11.2011. 3, 17, 18, 19. [DOI] [PMC free article] [PubMed] [Google Scholar]
- Hackett TA, Preuss TM, Kaas JH. Architectonic identification of the core region in auditory cortex of macaques, chimpanzees, and humans. J Comparative Neurology. 2001;441(3):197–222. doi: 10.1002/cne.1407. 3, 9. [DOI] [PubMed] [Google Scholar]
- Hinds O, Polimeni JR, Rajendran N, Balasubramanian M, Wald LL, Augustinack JC, Wiggins G, Rosas HD, Fischl B, Schwartz EL. The intrinsic shape of human and macaque primary visual cortex. Cereb Cortex. 2008;18(11):2586–95. doi: 10.1093/cercor/bhn016. 2. [DOI] [PMC free article] [PubMed] [Google Scholar]
- Hopf A. Zur Frage der Konstanz und Abgrenzbarkeit myeloarchitektonischer Rindenfelder. J. Neurology. 1954a;172(2):188–200. 2. [PubMed] [Google Scholar]
- Hopf A. Die Myeloarchitektonik des Isocortex temporalis beim Menschen. J. Hirnforsch. 1954b;1:208–279. 2. [Google Scholar]
- Humphries C, Liebenthal E, Binder JR. Tonotopic organization of human auditory cortex. Neuroimage. 2010;50:1202–1211. doi: 10.1016/j.neuroimage.2010.01.046. 2. [DOI] [PMC free article] [PubMed] [Google Scholar]
- Kaas JH, Hackett TA. Subdivisions of auditory cortex and levels of processing in primates. Audiol. Neurootol. 1998;3:73–85. doi: 10.1159/000013783. 3, 9. [DOI] [PubMed] [Google Scholar]
- Langers DR, Backes WH, van Dijk P. Representation of lateralization and tonotopy in primary versus secondary human auditory cortex. Neuroimage. 2007;34:264–273. doi: 10.1016/j.neuroimage.2006.09.002. 2. [DOI] [PubMed] [Google Scholar]
- Mazziotta J, Toga A, Evans A, Fox P, Lancaster J, Zilles K, Woods R, Paus T, Simpson G, Pike B, et al. A probabilistic atlas and reference system for the human brain: International Consortium for Brain Mapping (ICBM) Philosophical Transactions B. 2001;356(1412):1293. doi: 10.1098/rstb.2001.0915. 2. [DOI] [PMC free article] [PubMed] [Google Scholar]
- Moerel M, De Martino F, Formisano E. Processing of natural sounds in human auditory cortex: Tonotopy, spectral tuning, and relation to voice sensitivity. J Neuroscience. 2012;32(41):14205–14216. doi: 10.1523/JNEUROSCI.1388-12.2012. 2, 4. [DOI] [PMC free article] [PubMed] [Google Scholar]
- Morosan P, Rademacher J, Schleicher A, Amunts K, Schormann T, Zilles K. Human primary auditory cortex: cytoarchitectonic subdivisions and mapping into a spatial reference system. Neuroimage. 2001;13(4):684–701. doi: 10.1006/nimg.2000.0715. 2, 3, 4, 9, 13, 14, 15, 17, 18, 39. [DOI] [PubMed] [Google Scholar]
- Rohkohl C, Engel K. Efficient image segmentation using pairwise pixel similarities. In: Hamprecht F, Schnörr C, editors. Proc. 29th DAGM Symposium. Vol. 4713. Springer; 2007. pp. 254–263. of LNCS. 20. [Google Scholar]
- Schira MM, Breakspear M, Tyler CW, Spehar B. The foveal confluence in human visual cortex. J Neurosci. 2009;29(28):9050–9058. doi: 10.1523/JNEUROSCI.1760-09.2009. 19. [DOI] [PMC free article] [PubMed] [Google Scholar]
- Schonwiesner M, von Cramon DY, Rubsamen R. Is it tonotopy after all? Neuroimage. 2002;17:1144–1161. doi: 10.1006/nimg.2002.1250. 2. [DOI] [PubMed] [Google Scholar]
- Seewann A, Kooi E, Roosendaal SD, Pouwels PJW, Wattjes MP, Van Der Valk P, Barkhof F, Polman CH, Geurts JJG. Postmortem verification of ms cortical lesion detection with 3d dir. Neurology. 2012;78(5):302–308. doi: 10.1212/WNL.0b013e31824528a0. 18. [DOI] [PubMed] [Google Scholar]
- Ségonne F, Dale AM, Busa E, Glessner M, Salat D, Hahn HK, Fischl B. A hybrid approach to the skull stripping problem in MRI. Neuroimage. 2004;22(3):1060–1075. doi: 10.1016/j.neuroimage.2004.03.032. 6. [DOI] [PubMed] [Google Scholar]
- Sereno MI, Dale AM, Reppas JB, Kwong KK, Belliveau JW, Brady TJ, Rosen BR, Tootell RB. Borders of multiple visual areas in humans revealed by functional magnetic resonance imaging. Science. 1995;268(5212):889. doi: 10.1126/science.7754376. 2. [DOI] [PubMed] [Google Scholar]
- Sereno MI, Lutti A, Weiskopf N, Dick F. Mapping the human cortical surface by combining quantitative t1 with retinotopy. Cerebral Cortex. 2012;21 doi: 10.1093/cercor/bhs213. [DOI] [PMC free article] [PubMed] [Google Scholar]
- Sigalovsky IS, Fischl B, Melcher JR. Mapping an intrinsic MR property of gray matter in auditory cortex of living humans: a possible marker for primary cortex and hemispheric differences. Neuroimage. 2006;32(4):1524–1537. doi: 10.1016/j.neuroimage.2006.05.023. 3, 17, 18. [DOI] [PMC free article] [PubMed] [Google Scholar]
- Striem-Amit E, Hertz U, Amedi A. Extensive cochleotopic mapping of human auditory cortical fields obtained with phase-encoding fmri. PLoS One. 2011;6:e17832. doi: 10.1371/journal.pone.0017832. 2. [DOI] [PMC free article] [PubMed] [Google Scholar]
- Tahmasebi AM, Abolmaesumi P, Geng X, Morosan P, Amunts K, Christensen GE, Johnsrude IS. A new approach for creating customizable cytoarchitectonic probabilistic maps without a template. MICCAI (1) 2009:795–802. doi: 10.1007/978-3-642-04271-3_96. 2, 20. [DOI] [PubMed] [Google Scholar]
- Talavage TM, Sereno MI, Melcher JR, Ledden PJ, Rosen BR, Dale AM. Tonotopic organization in human auditory cortex revealed by progressions of frequency sensitivity. J Neurophysiol. 2004;91:1282–1296. doi: 10.1152/jn.01125.2002. 2. [DOI] [PubMed] [Google Scholar]
- von Economo C, Horn L. Über Windungsrelief, Maße und Rindenar-chitektonik der Supratemporalfl̈ache, ihre individuellen und ihre Seitenun-terschiede. Z. Neurol. Psychiat. 1930;130:678–757. 2, 3, 4, 13, 14. [Google Scholar]
- von Economo C, Koskinas GN. Die Cytoarchitektonik der Hirnrinde des erwachsenen Menschen. Springer; 1925. 2. [Google Scholar]
- Wallace MN, Johnston PW, Palmer AR. Histochemical identification of cortical areas in the auditory region of the human brain. Exp Brain Res. 2002;143:499–508. doi: 10.1007/s00221-002-1014-z. 9, 18. [DOI] [PubMed] [Google Scholar]
- Woods DL, Stecker GC, Rinne T, Herron TJ, Cate AD, Yund EW, Liao I, Kang X. Functional maps of human auditory cortex: effects of acoustic features and attention. PLoS One. 2009;4:e5183. doi: 10.1371/journal.pone.0005183. 2. [DOI] [PMC free article] [PubMed] [Google Scholar]
- Zilles K, Schleicher A, Palomero-Gallagher N, Amunts K. Quantitative analysis of cyto- and receptorarchitecture of the human brain. In: Toga AW, Mazziotta JC, editors. Brain mapping: The methods. Academic Press; 2002. 2. [Google Scholar]


