Abstract
The subsynovial connective tissue (SSCT) in the carpal tunnel may play a role in the etiology of carpal tunnel syndrome (CTS), yet the material properties of the SSCT remain unclear. Thus, we investigated the mechanical response of the SSCT in a rabbit model. Twenty-four rabbit cadaver paws were used for mechanical testing; two paws were used for scanning electron microscopy (SEM) imaging. After testing normal tendon excursion, the divided third digit flexor digitorum superficialis (FDS) tendon was pulled to displacements of 2, 3.5, 5, or 8 mm, maintained at that position until force decay, and then the process was repeated. Normal excursion of the FDS averaged 4.8 mm. The ratio of the second peak force to the first peak force in the 2 mm group was 0.98 (SD = 0.16), which was significantly higher than the other groups (3.5 mm: 0.74, 5 mm, 0.63, and 8 mm: 0.59; p < 0.05). SEM showed ruptured fibrils in the displaced specimen. The declining force ratio with displacements >2 mm suggests damage to the SSCT within the physiological tendon excursion. These data may be useful in understanding SSCT mechanics in CTS, which is associated with SSCT fibrosis.
Keywords: carpal tunnel, subsynovial connective tissue, biomechanics, rabbit, repeated relaxation test
Carpal tunnel syndrome (CTS), a compression neuropathy of the median nerve, is a common diagnosis, with an incidence of 3.5/1,000 person-years.1 From an epidemiologic perspective, it is widely accepted that repetitive, forceful hand or wrist motion is a risk factor for CTS.2–13 While the direct cause of CTS is unknown in many cases, one hypothesis is that tendon excursion creates microtears in the subsynovial connective tissue (SSCT) surrounding the tendon and the median nerve in the carpal tunnel, which in turn initiate fibrosis of the SSCT and thereby create CTS.14–19
The SSCT is composed of layered bundles of collagen running parallel to the tendon. These layers are interconnected by smaller vertical fibers. By stretching and relaxing the SSCT during finger movement, the loose fibers between adjacent layers are stretched, and the fibrous bundles move layer by layer, pulled by the interconnections, like an arm would move within layers of sleeves.20 The carpal tunnel and SSCT anatomy of animals has been compared to the relevant human anatomy and ultrastructure.21 Humans and rabbits have a similar SSCT organization within the carpal canal.21
Yamaguchi et al.22 used a rabbit carpal tunnel model to study excursion of the third digit flexor digitorum superficialis (FDS) and the failure load of the SSCT. One limitation of their study was that they tested one continuous motion in rupturing the SSCT, which may be an appropriate simulation of acute injury, but does not simulate chronic, repetitive injury, which s implicated in the etiology of CTS. In addition, the point of SSCT rupture observed by Yamaguchi et al. was well beyond the normal excursion of the third digit FDS. In this study, we analyzed the mechanical response of the rabbit SSCT subjected to different levels of displacement ranging from below to above the normal excursion, comparing the data acquired from two repeated displacement relaxation tests, allowing an intervening interval for viscoelastic recovery. Our hypothesis was that the normal SSCT displacement with full digit motion would be the threshold of displacement beyond which SSCT damage would occur.
MATERIALS AND METHODS
Specimen Preparation and Setup
We used 26 forepaws obtained at necropsy from rabbits (body weight 3.89 ± 0.47 kg) euthanized for other IACUC-approved studies. All paws were cut at the mid-forearm. In 24 specimens, the FDS tendons were exposed at the ante-brachial level with the carpal tunnel intact. While all digits were held in full extension, the third FDS tendon was transected 5 mm proximal to the proximal edge of the tunnel and was used for testing. Then, the proximal end of the tendon was sutured with a single suture of 6-0 polypropylene (Prolene, Ethicon, Somerville, NJ), and the suture was used as a marker in measuring tendon excursion. A second suture was placed on the flexor carpi ulnaris tendon, which served as a fixed reference point. The excursion of the third FDS tendon from full middle finger extension to full flexion was measured using a digital caliper. The tendon was also exposed distal to the tunnel and cut at the level of the A1 pulley. The distal end of the tendon was also sutured with 6-0 polypropylene.
After the preparation of the third FDS tendon, the whole specimen was mounted on a custom specimen holder on a mechanical actuator. The other digits were pinned to the holder in the fully extended position. The proximal part of the other FDS tendons and the FDP muscle were also pinned to the holder to maintain their position while testing. The wrist joint was fixed in neutral using a 1.0 mm Kirschner wire. The security of the fixation was checked manually without radiographic confirmation. The proximal end of the third FDS tendon was connected to a 500-g load cell (Transducer Techniques, Temecula, CA); the distal end was connected to a 2.0 N weight for 3 min to pre-tension the suture-tendon fixation and to remove any slack in the system. After pre-tensioning, the distal end was connected to a 0.4 N weight to maintain tension in the tendon during testing. This load was chosen based on an unpublished pilot study, in which this amount of load produced 8 mm of tendon excursion. Motion of the actuator with the specimen mounted generated relative motion between the tendon and carpal tunnel. The specimen was maintained at room temperature (20°C) for the duration of all testing (Fig. 1).
Figure 1.

Testing setup. 1: load transducer; 2: needle dripping saline; 3: actuator; 4: K-wire fixing the wrist joint; 5: exposed third FDS tendon connected to load transducer and actuator by sutures; 6: specimen mounted on the corkboard with multiple needles; 7: string connected to the dead weight.
Repeated Relaxation Test
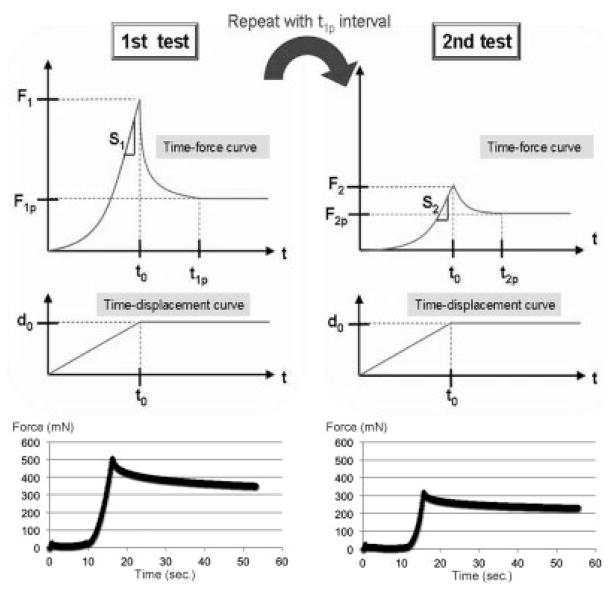
In a first relaxation test, the tendon was moved by the actuator to simulate flexion at a speed of 0.5 mm/s. The tendons were moved to excursions of 2, 3.5, 5, or 8 mm. The amount of displacement was checked after each excursion by measuring the displacement of the actuator and the suture marker using the digital caliper. These were concordant in each case (Fig. 2).
Figure 2.
Scheme and data plot of an 8 mm repeated relaxation test. F1: first peak force; F1p: first plateau force; S1: stiffness in the first cycle; T1p: first plateau time; F2: second peak force; F2p: second plateau force; S2: Stiffness in the second cycle; and T2p: second plateau time force.
Six randomly chosen tendons were tested at each excursion level. The readings from the load transducer and the corresponding excursions were recorded with a data acquisition system at a sampling rate of 10 Hz. All specimens were kept moist by a continuous saline drip.
In the relaxation test, we defined the following terms for analysis: peak force (F): the highest force observed while testing; stiffness (S): the slope of linear region of the force-displacement curve; decay time (Tp): the point in time when the decline in force across a 30-min time interval was <1% of F; and Plateau force (FP): the force at the decay time.
The first relaxation test was stopped when the decay time limit was achieved, as measured by a simultaneous analysis using a MATLAB (Mathworks, Natick, MA) search algorithm. After the first relaxation test, the tendon was moved in the extension direction to the original position and maintained in that position for an additional amount of time equal to the measured decay time.
After recovery from the first test, a second relaxation test was performed. The tendon was moved in the flexion direction again for the same excursion distance as the first test. The readings from the load transducer and the corresponding excursions were recorded in the same manner. The test was stopped when it fulfilled the same criteria described above.
Scanning Electron Microscopy (SEM)
In two specimens, SEM imaging was used to determine the ultrastructural morphology of the SSCT: one with the FDS tendon in the neutral position, and the other with the FDS in the 8 mm displaced position. Immediately after euthanasia and the removal of the skin, these forepaws were fixed in Trump’s fixative (1% glutaraldehyde and 4% formaldehyde in 0.1 M phosphate buffer, pH 7.223) for 48 h. The tissue was then cut in the longitudinal direction in the plane containing the middle digit FDS tendon. Tissue was then rinsed for 30 min in two changes of 0.1 M phosphate-buffered saline (pH 7.2). The tissue was dehydrated in progressive concentrations of ethanol to 100% and critical point dried. The specimens were then mounted on aluminum stubs and sputter coated with gold-palladium. Images in one randomly chosen SSCT area around the third FDS tendon on each specimen were captured on a cold-field emission SEM operating at 3 KV (Hitachi S-4700; Hitachi High Technologies America, Inc., Pleasanton, CA).
Statistical Analysis
The data from the relaxation tests were analyzed (Fig. 2). The ratio of “F2 to F1,” “S2 to S1,” “F2p to F2,” “F1p to F1,” and “T2p to T1p” in each group were compared using one-way ANOVA with a Tukey-Kramer post hoc test for the difference among the excursion groups. All tests were two-sided and p-values <0.05 were considered significant.
Sample size requirements were determined by a power calculation. According to a pilot study, the mean value of F2/F1 was 93.0% (SD = 17.3%) and 66.5% (SD = 6.7%) for 2 and 5 mm of excursion, respectively. Assuming similar variance in this experiment, a sample of six specimens in each group provided 80% power to detect a difference of 25% between any two of the four-test excursions. F2/F1 was chosen for the sample size calculation based on an assumption that the amount of relative difference in peak force reflects damage to the SSCT. We chose 25% as a scientifically important difference. This value is close to the difference of means observed with 2 and 5 mm of excursion in the pilot study.
RESULTS
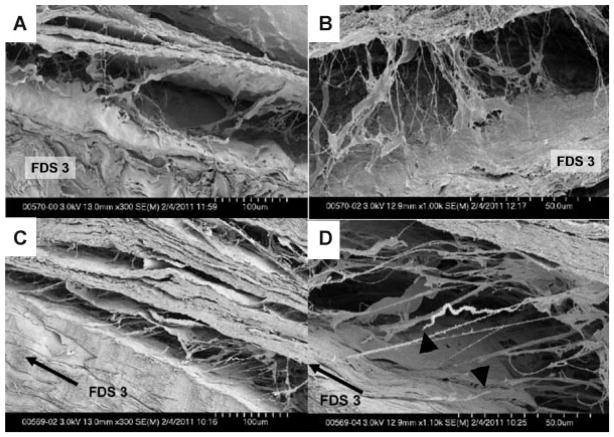
The measured excursion of the third FDS tendon ranged from 3.9 to 5.2 mm (4.79 ± 0.45 mm). Under SEM, the thin fibrils within the SSCT appeared to be relaxed in the specimen with the neutrally positioned FDS tendon. The direction of the fibrils was not uniform. In contrast, fibrils were stretched in the same direction and some of the fibrils were even ruptured in the specimen with the 8 mm displaced FDS tendon (Fig. 3).
Figure 3.
SEM images. Neutral positioned specimen (A) ×300 magnification and (B) ×1,000 magnification; 8 mm displaced specimen (C) ×300 magnification and (D) ×1,100 magnification. Black arrow indicates the direction of the third FDS tendon displacement (C and D). Black triangles point to stumps of ruptured fibrils (D).
The ratios of “F2 to F1,” “S2 to S1,” “F2p to F2,” “F1p to F1,” and “T2p to T1p” in each group are summarized on Table 1. The F2 to F1 ratio was significantly higher in the 2 mm group compared to the other groups. No significant difference was found in the S2 to S1 ratio among the groups. The F2p to F2 ratio for the 2 mm displacement was significantly lower than for the 8 mm displacement. No significant difference in the T2p to T1p ratio was found among the groups.
Table 1.
Ratio in Different Displacement
| Ratio | Displacement
|
|||
|---|---|---|---|---|
| 2 mm | 3.5 mm | 5 mm | 8 mm | |
| F2/F1 | 0.98 ± 0.16a | 0.74 ± 0.11a | 0.63 ± 0.04a | 0.59 ± 0.07a |
| S2/S1 | 1.12 ± 0.16 | 0.97 ± 0.12 | 1.00 ± 0.10 | 1.05 ± 0.07 |
| F1p/F1 | 0.17 ± 0.10 | 0.28 ± 0.03 | 0.25 ± 0.05 | 0.28 ± 0.03 |
| F2p/F2 | 0.27 ± 0.09b | 0.36 ± 0.01 | 0.33 ± 0.06 | 0.42 ± 0.04b |
| T2p/T1p | 1.02 ± 0.13 | 0.95 ± 0.19 | 1.02 ± 0.21 | 0.99 ± 0.20 |
There was a significant difference between 2 mm group and the other groups.
There was a significant difference between 2 and 8 mm group (p < 0.05).
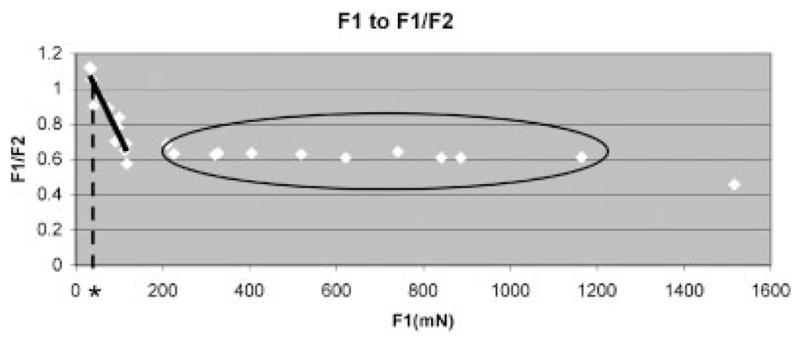
As shown in Figure 4, beyond 200 mN of loading, the F1/F2 ratio remained fairly constant, at roughly 0.6. The recovery time (T1p) of each group was 2.1 h (SD = 0.4 h), 2.4 h (SD = 0.3 h), 2.2 h (SD = 0.2 h), and 2.8 h (SD = 0.4 h) in the 2, 3.5, 5, and 8 mm groups, respectively. The recovery time after 2 mm displacement was significantly shorter than after 8 mm displacement.
Figure 4.

Ratio of F1 to F1/F2. Black solid line shows linear approximation of the data in the range of F1 < 150 mN (F2/F1 = −0.005 F1 + 1.237, R2 = 0.877). Black dotted line is a tangent drawn from the cross point of the linear approximated line and F2/F1 = 1 (asterisk indicates its cross point to the x-axis). Black circle indicates data with relatively constant F2/F1, ~0.6.
DISCUSSION
Guimberteau13 was one of the first to describe the shearing behavior of the SSCT. He hypothesized that as one SSCT layer shears past another, the fibrils connecting the layers act like rubber cables; they can stretch to some extent, but not indefinitely. Once these fibrils reach their maximum length, the shear force will either rupture the fibrils or deform them irreversibly.
The ratio of the measured peak force results showed that >2 mm of displacement caused a significant decrease in the second test (F2) compared to the first (F1). This suggests that >2 mm of displacement causes an irreversible change in the structure of the rabbit SSCT. Interestingly, our next highest test level, 3.5 mm, is less than the normal excursion of the tendon. This refutes our hypothesis and suggests that even motion within the physiological range can cause some damage to the SSCT. This could be evidence of a microtear,17–19 and the rupture of thin fibrils seen on SEM might be an example of a microtear itself (Fig. 3D).
As F1, the first peak force, is a force created by the SSCT in response to displacement of the FDS tendon, it is equal to the force which was applied to the SSCT in testing. In that sense, Figure 4 is interpreted as the change of peak force in relation to the force applied to the SSCT. Our findings suggest that there is a threshold of applied force, beyond which SSCT damage occurs. Figure 4 suggests that a linear correlation of damage to applied force might exist in some cases; we believe that this evidence supports Guimberteau’s hypothesis of the layered SSCT with progressive recruitment of layers.
The threshold of applied force for damage to the SSCT appears to be ~200 mN. We have not tried using this force value and the linear loading phase of the stress-relaxation test to estimate the tendon displacement at this load; ideally, this would fall between the 2.0 and 3.5 mm displacement groups and would be a good check of our data. We plan to do this in a future study.
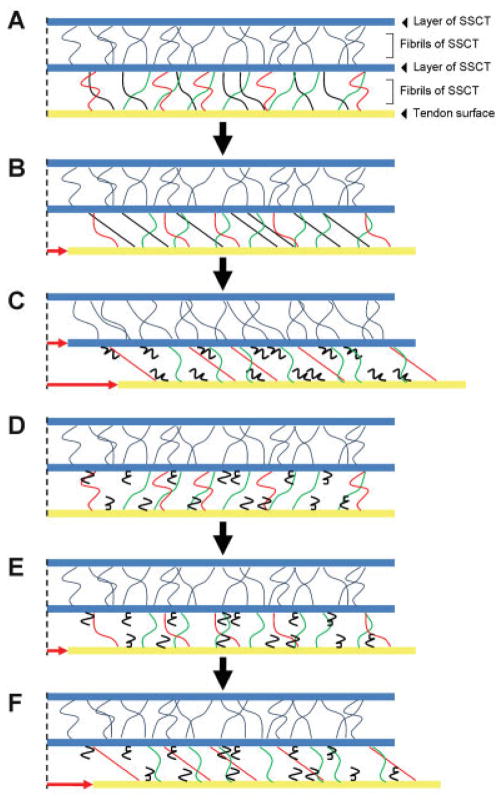
Figure 5 is our model of the SSCT. The direction of the small fibrils between each SSCT layer is randomly oriented and thus, only some of the fibrils are tensioned at any one time (e.g., black fibrils in Fig. 5B and red fibrils in Fig. 5C and F). With progressive loading, additional fibrils are recruited and then fail. The constant F1/F2 ratio is consistent with this hypothesis, that is, sequential failure of different, previously intact fascicles with increasing excursion. It is unlikely that progressive damage to the same fascicles with increasing excursion would show such a constant ratio. We also believe that further investigation of the structure of SSCT is well warranted, to further explore these observations and to correlate them with findings in both normal and abnormal human SSCT.
Figure 5.
Schema of the SSCT while performing the relaxation testing. The fibrils between the tendon and the first layer of SSCT are colored separately in black, red, and green based on differences in tension while testing. (A) Resting position of the tendon and the SSCT. (B) The point of displacement at which black fibrils were tensioned and the tendon movement was transmitted to the first SSCT layer. (C) The end of the first cycle; the black fibrils were ruptured and red fibrils were subsequently tensioned. (D) Beginning of the second test. (E) The point of displacement at which the first SSCT layer had begun to move in the first testing; as the black fibrils were ruptured, the force was not transmitted to the first layer at this point in the second test. (F) The point of displacement at which the force was transmitted to the next SSCT layer by tensioning green fibrils; the amount of displacement of the tendon was larger than the first testing (compare B and F). [Color figure can be seen in the online version of this article, available at http://wileyonlinelibrary.com/journal/jor]
In contrast to the change of peak force in tendons with >2 mm of displacement, stiffness did not change in the second relaxation test in any group. This observation can be explained if, again, each layer of the SSCT has similar stiffness, and if, as Guimberteau hypothesized, the layers are engaged one at a time, with each layer having similar material properties. Further support for this hypothesis comes from Ettema et al.,21 who showed that patients with more mild CTS had SSCT fibrosis close to the tendon, while patients with more severe CTS had fibrosis that extended farther out from the tendon, as one would expect if the SSCT fibrils and layers had failed sequentially, starting with those closest to the tendon.
The principal limitation of our study is that it was a cadaveric study. In vivo material properties might be different. In addition, the set up, in which one tendon was moved and the other digits were held still, is not a normal physiological motion for the rabbit paw.
The principal strength of our study is that this is the first study to our knowledge to investigate the viscoelastic properties of the carpal tunnel SSCT. Future studies might examine the effect of relaxation time, cycle time, strain rate, and other parameters on these properties, and the propensity of the SSCT to both in vitro and in vivo injury. We are planning to do similar experiments using human SSCT, which we believe will give us further insights regarding the etiology of idiopathic CTS.
References
- 1.Nordstrom DL, DeStefano F, Vierkant RA, et al. Incidence of diagnosed carpal tunnel syndrome in a general population. Epidemiology. 1998;9:342–345. [PubMed] [Google Scholar]
- 2.Amadio PC. Pyridoxine as an adjunct in the treatment of carpal tunnel syndrome. J Hand Surg Am. 1985;10:237–241. doi: 10.1016/s0363-5023(85)80112-x. [DOI] [PubMed] [Google Scholar]
- 3.Amadio PC. Repetitive stress injury. J Bone Joint Surg Am. 2001;83-A:136–137. doi: 10.2106/00004623-200101000-00018. (author reply 138–141) [DOI] [PubMed] [Google Scholar]
- 4.English CJ, Maclaren WM, Court-Brown C, et al. Relations between upper limb soft tissue disorders and repetitive movements at work. Am J Ind Med. 1995;27:75–90. doi: 10.1002/ajim.4700270108. [DOI] [PubMed] [Google Scholar]
- 5.Hadler NM. Arm pain in the work place. Bull Rheum Dis. 1993;42:6–8. [PubMed] [Google Scholar]
- 6.Latko WA, Armstrong TJ, Franzblau A, et al. Cross-sectional study of the relationship between repetitive work and the prevalence of upper limb musculoskeletal disorders. Am J Ind Med. 1999;36:248–259. doi: 10.1002/(sici)1097-0274(199908)36:2<248::aid-ajim4>3.0.co;2-q. [DOI] [PubMed] [Google Scholar]
- 7.Mackinnon SE, Novak CB. Repetitive strain in the workplace. J Hand Surg Am. 1997;22:2–18. doi: 10.1016/S0363-5023(05)80174-1. [DOI] [PubMed] [Google Scholar]
- 8.Masear VR, Hayes JM, Hyde AG. An industrial cause of carpal tunnel syndrome. J Hand Surg Am. 1986;11:222–227. doi: 10.1016/s0363-5023(86)80055-7. [DOI] [PubMed] [Google Scholar]
- 9.Pickering SA, Stevens A, Davis TR. Work practices and histopathological changes in the tenosynovium in carpal tunnel syndrome in men. J Hand Surg Br. 2004;29:325–328. doi: 10.1016/j.jhsb.2003.10.015. [DOI] [PubMed] [Google Scholar]
- 10.Saleh SS, Fuortes L, Vaughn T, et al. Epidemiology of occupational injuries and illnesses in a university population: A focus on age and gender differences. Am J Ind Med. 2001;39:581–586. doi: 10.1002/ajim.1057. [DOI] [PubMed] [Google Scholar]
- 11.Szabo RM. Carpal tunnel syndrome as a repetitive motion disorder. Clin Orthop Relat Res. 1998:78–89. [PubMed] [Google Scholar]
- 12.van Tulder M, Malmivaara A, Koes B. Repetitive strain injury. Lancet. 2007;369:1815–1822. doi: 10.1016/S0140-6736(07)60820-4. [DOI] [PubMed] [Google Scholar]
- 13.Guimberteau JC. The sliding system. Vascularized flexor tendon transfers. Bordeaur, France: Aquitaine domaine forestier; 2001. New ideas in hand flexor tendon surgery. [Google Scholar]
- 14.Cobb TK, Dalley BK, Posteraro RH, et al. The carpal tunnel as a compartment. An anatomic perspective. Orthop Rev. 1992;21:451–453. [PubMed] [Google Scholar]
- 15.Ettema AM, Zhao C, Amadio PC, et al. Gliding characteristics of flexor tendon and tenosynovium in carpal tunnel syndrome: A pilot study. Clin Anat. 2007;20:292–299. doi: 10.1002/ca.20379. [DOI] [PubMed] [Google Scholar]
- 16.Zhao C, Ettema AM, Osamura N, et al. Gliding characteristics between flexor tendons and surrounding tissues in the carpal tunnel: A biomechanical cadaver study. J Orthop Res. 2007;25:185–190. doi: 10.1002/jor.20321. [DOI] [PubMed] [Google Scholar]
- 17.Lluch AL. Thickening of the synovium of the digital flexor tendons: Cause or consequence of the carpal tunnel syndrome? J Hand Surg Br. 1992;17:209–212. doi: 10.1016/0266-7681(92)90091-f. [DOI] [PubMed] [Google Scholar]
- 18.Ugbolue UC, Hsu WH, Goitz RJ, et al. Tendon and nerve displacement at the wrist during finger movements. Clin Biomech (Bristol, Avon) 2005;20:50–56. doi: 10.1016/j.clinbiomech.2004.08.006. [DOI] [PubMed] [Google Scholar]
- 19.van Doesburg MH, Yoshii Y, Villarraga HR, et al. Median nerve deformation and displacement in the carpal tunnel during index finger and thumb motion. J Orthop Res. 2010;28:1387–1390. doi: 10.1002/jor.21131. [DOI] [PMC free article] [PubMed] [Google Scholar]
- 20.Ettema AM, Amadio PC, Zhao C, et al. Changes in the functional structure of the tenosynovium in idiopathic carpal tunnel syndrome: A scanning electron microscope study. Plast Reconstr Surg. 2006;118:1413–1422. doi: 10.1097/01.prs.0000239593.55293.c7. [DOI] [PubMed] [Google Scholar]
- 21.Ettema AM, Zhao C, An KN, et al. Comparative anatomy of the subsynovial connective tissue in the carpal tunnel of the rat, rabbit, dog, baboon, and human. Hand (NY) 2006;1:78–84. doi: 10.1007/s11552-006-9009-z. [DOI] [PMC free article] [PubMed] [Google Scholar]
- 22.Yamaguchi T, Osamura N, Zhao C, et al. The mechanical properties of the rabbit carpal tunnel subsynovial connective tissue. J Biomech. 2008;41:3519–3522. doi: 10.1016/j.jbiomech.2007.06.004. [DOI] [PMC free article] [PubMed] [Google Scholar]
- 23.McDowell EM, Trump BF. Histologic fixatives suitable for diagnostic light and electron microscopy. Arch Pathol Lab Med. 1976;100:405–414. [PubMed] [Google Scholar]


