Abstract
Reciprocating microfluidic drug delivery, as compared to steady or pulsed infusion, has unique features which may be advantageous in many therapeutic applications. We have previously described a device, designed for wearable use in small animal models, which periodically infuses then withdraws a sub-microliter volume of drug solution to and from the endogenous fluid of the inner ear. This delivery approach results in zero net volume of liquid transfer while enabling mass transport of compounds to the cochlea by means of diffusion and mixing. We report here on an advanced wearable delivery system aimed at further miniaturization and complex dose protocols. Enhancements to the system include the incorporation of a planar micropump to generate reciprocating flow and a novel drug reservoir which maintains zero net volume delivery and permits programmable modulation of the drug concentration in the infused bolus. The reciprocating pump is fabricated from laminated polymer films and employs a miniature electromagnetic actuator to meet the size and weight requirements of a head-mounted in vivo guinea pig testing system. The reservoir comprises a long microchannel in series with a micropump, connected in parallel with the reciprocating flow network. We characterized in vitro the response and repeatability of the planar pump and compared the results with a lumped element simulation. We also characterized the performance of the reservoir, including repeatability of dosing and range of dose modulation. Acute in vivo experiments were performed in which the reciprocating pump was used to deliver a test compound to the cochlea of anesthetized guinea pigs to evaluate short-term safety and efficacy of the system. These advances are key steps toward realization of an implantable device for long-term therapeutic applications in humans.
Introduction
Recent advances in molecular biology have led to new discoveries and new therapeutic possibilities for the treatment of a wide range of diseases, including those of the inner ear1–5. Major clinical targets include sensorineural and noise-induced hearing loss, ototoxicity protection, balance disorders, and tinnitus. A hurdle to effective deployment of therapeutic compounds is delivery to target organs that may be relatively inaccessible through conventional routes6, 7. Therefore, there is an urgent clinical need for implantable drug delivery devices capable of local, programmable delivery to such organs in a safe and efficacious manner. For the inner ear, systemic drug delivery generally requires high drug concentrations, with the consequence that compounds may reach unintended targets. This problem is exacerbated by the presence of the blood-cochlear barrier, which effectively blocks most drugs that are administered through oral or intravascular routes6, 7. Even when systemic delivery may be efficacious, severe side effects may result, such as with the use of corticosteroids for autoimmune inner ear disease8. These are challenges for both human clinical applications and for researchers aiming to use pre-clinical in vivo models to discover new compounds to treat inner ear diseases. A safe and effective delivery system that could be worn or implanted for extended periods would succinctly address these needs.
Currently, the most common approach to local delivery to the inner ear is placement of drug in a gel format in the middle ear at the round window membrane via intratympanic injection, with reliance on passive transport through the membrane into the cochlea9–15. The main drawback to this approach is that transport is not controllable and the resulting delivery kinetics can be unpredictable. Other researchers have investigated the use of injected nanoparticles, gene delivery, cell-based therapies and related approaches16–29; however all of these avenues ultimately require a reliable method for drug introduction into the cochlea.
A preferred approach for delivery from a pharmacological perspective is direct infusion of drug, where the volume and concentration of drug infused into the cochlea is known, and an understanding of the fluid dynamics and pharmokinetics can enable predictable delivery. Direct infusion to the cochlea is complicated by the size and location of the cochlea: the cross-sectional area of the human scala tympani is at its largest a few millimeters, and access requires penetration through the round window membrane, or performing a cochleostomy by drilling through the petrous bone. Further, the hair cells inside the organ of Corti are very delicate and can be damaged by fluidic and mechanical forces. The volume of the scala tympani is approximately 30 µl30; rapid injection of fluid into this volume can increase pressure, which may cause permanent damage. In pre-clinical studies, direct infusion has been achieved with commercial osmotic pumps via a cannula inserted into a cochleostomy. However these devices do not afford wide control over flow rates and dosage, and expend their drug payload within a few weeks31.
Therefore, our goals for safe and efficacious drug delivery include direct infusion to the inner ear, low mechanical and fluidic perturbation of the cochlea and the cochlear fluid, and variable flow parameters and dose levels. Specifications for the pumping mechanism are largely driven by the very small fluidic spaces within the cochlea and the sensitivity of the hair cells and other structures to changes in pressure and fluid shear. The system components should be suitable for miniaturization and implantation32, precise flow rates, high energy efficiency, and long-term (months to years) functionality. Several microsystems for drug delivery have demonstrated the capability to meet some of these requirements, but none is yet suitable for intracochlear applications in humans. Excellent review articles give an overview of microscale drug delivery devices developed for a variety of therapies33–36. Among the emerging devices engineered specifically for intracochlear delivery, Johnson et al. fabricated a tapered silicone interface for sealing to a rodent cochleostomy37 and also designed a cannula interface and flow sensor for integration with a micropump38. Others have tested modified cochlear prosthesis electrodes that contain a microchannel for drug transport39, 40. Microsystems designed for drug delivery to the inner ear were reviewed by Pararas et al.41
Previously, we reported the performance of reciprocating flow for intracochlear drug delivery, and we described a wearable system for in vivo animal testing with these capabilities42–46. However, essential components of the system were of a size scale that prohibited the miniaturization needed for an implantable system. Another drawback was that the system relied heavily on passive components (fluidic capacitors and resistive tubing) to achieve drug loading in a way that could not be tuned after assembly and did not allow for dose modulation. Here, we report on the implementation of new pumping and reservoir components, capable of reciprocating volumes of up to 1.5 µL, with designs that are consistent with our goals of miniaturization and dose control.
System overview
We designed the system to periodically infuse microliter-scale doses of concentrated drug directly into the endogenous fluid of the cochlea (perilymph), then withdraw an identical volume of less-concentrated fluid. This results in mass transfer of the drug with zero net volume displacement of fluid. A cannula is surgically implanted in the base of the scala tympani, and delivery occurs through diffusion and mixing with the perilymph during the infuse step. Infusion and withdrawal flow rates are limited to prevent damage to the sensitive inner ear hair cells. Consistent drug concentration is maintained with a reservoir and a drug loading pump which delivers fresh solution to the infusion line prior to each infuse-withdraw stage. The system is packaged in a pod that is mounted to the head of a guinea pig for in vivo chronic drug delivery experiments. Guinea pigs are used in these experiments for several reasons. Historically, they have been utilized extensively in auditory research, and much literature is available on their inner ear anatomy and physiology. These rodents are large enough to support a reasonably weighted device, and they have a relatively large cochlea for their size. The delivery system was designed to be self-contained rather than tethered in order to prevent the animal from damaging it.
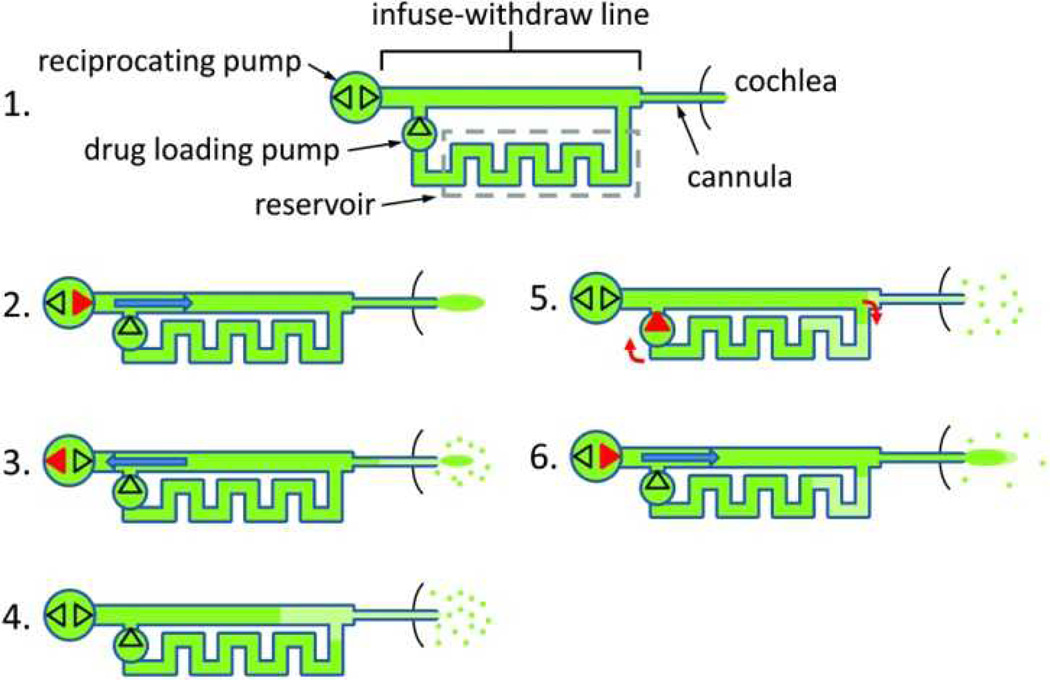
Two independent pumps and a microfluidic network accomplish the reciprocating flow and drug loading. The drug reservoir is a long microchannel connected in parallel with the infuse-withdraw line. A schematic of this network is shown in Figure 1. A typical delivery sequence comprises the following steps: 1) The device is fully loaded with concentrated drug dissolved in a biocompatible solution. 2) The reciprocating pump is activated to infuse drug through the cannula into the cochlea. 3) After a time interval, the reciprocating pump withdraws a mixture of perilymph and diluted drug back into the network, while some amount of concentrated drug remains in the cochlea. 4) At the end of the withdraw step, the diluted drug solution fills the distal end of the device. The system then enters an idle state, during which drug in the cochlea disperses away from the delivery site by diffusion. Convective mixing is minimal in microscale devices, so the diluted solution in the distal end of the device remains localized. 5) To prepare the next dose, the drug loading pump is momentarily activated, moving the diluted drug into the waste end of the reservoir, and loading fresh drug from the opposite end of the reservoir into the infuse-withdraw line for the next infusion. 6) The cycle repeats beginning with the infusion phase (step 2). This infusion comprises concentrated drug and a known, consistent volume of diluted drug from the previous withdraw step.
Figure 1.
Schematic of the controllable dose drug delivery system and the operation sequence. Red features indicate which of the pumping components is active at each step. The dots near the cannula outlet represent drug dispersal by diffusion. The dark green segments show drug solution at full concentration and the light green segments show drug diluted with endogenous fluid (perilymph). Channels are not drawn to scale.
The process described in steps 2 through 6 is repeated at a time interval required to achieve and sustain therapeutic levels of drug in the cochlea. The system will deliver a consistent dose of drug until the diluted drug has traveled through the reservoir and drug loading pump, reaching the infuse-withdraw line. After this time, either the drug could be delivered at a diluted concentration and the control variables changed to maintain therapeutic drug levels, or the system could be replenished. Data is presented later on dose consistency and duration.
In this paper, we describe the design and testing of the components of the microfluidic network and their integration into a wearable device for animal tests. We first characterize the operation of the reciprocating pump, compare it with a lumped element simulation, and demonstrate its ability to deliver a test drug to the guinea pig cochlea. We then characterize performance of the complete controllable dose system, and measure dosing of a dye in vitro.
Methods
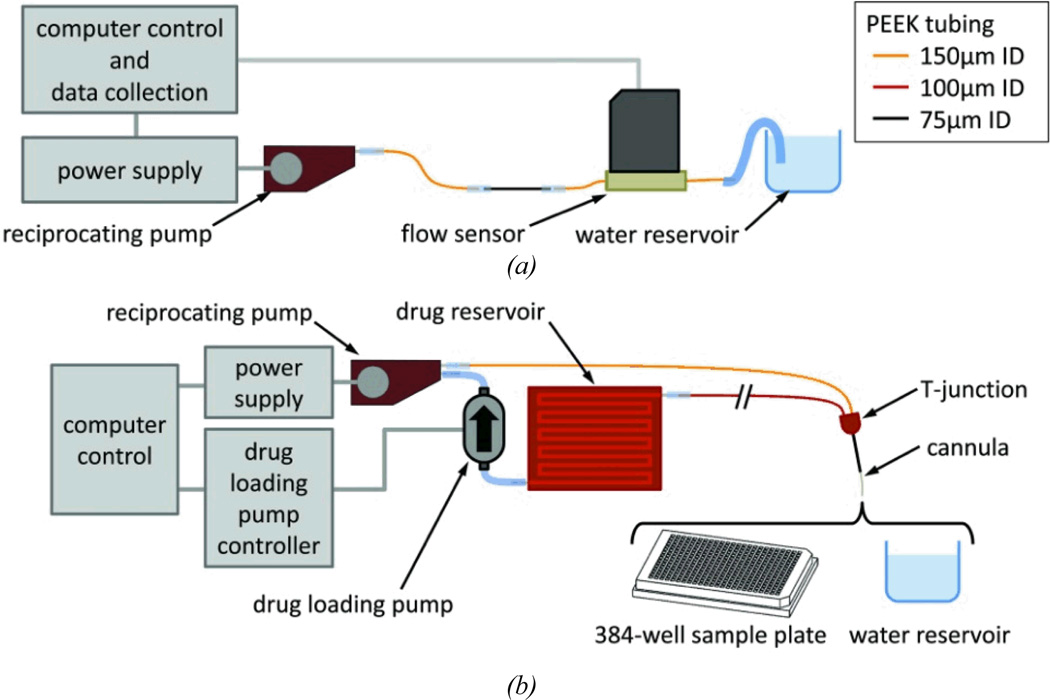
We tested two configurations of the fluid network, using the components and instruments described in this section. These assemblies are shown in Figure 2. The first configuration (Figure 2a) omits the drug loading pump and reservoir and only performs reciprocating flow (repeating steps 2–4 in Figure 2). The second configuration (Figure 2b) shows the complete controllable dose system with benchtop controls for in vitro experiments. Methods of fabrication, assembly, testing are summarized below. More comprehensive descriptions, including methods of connecting the various tubing and components, are found in the Electronic Supplement.
Figure 2.
Test setup for (a) the reciprocating flow pump and (b) the complete controllable dose system, which includes the reciprocating pump, drug reservoir, and drug loading pump.
Components and fabrication
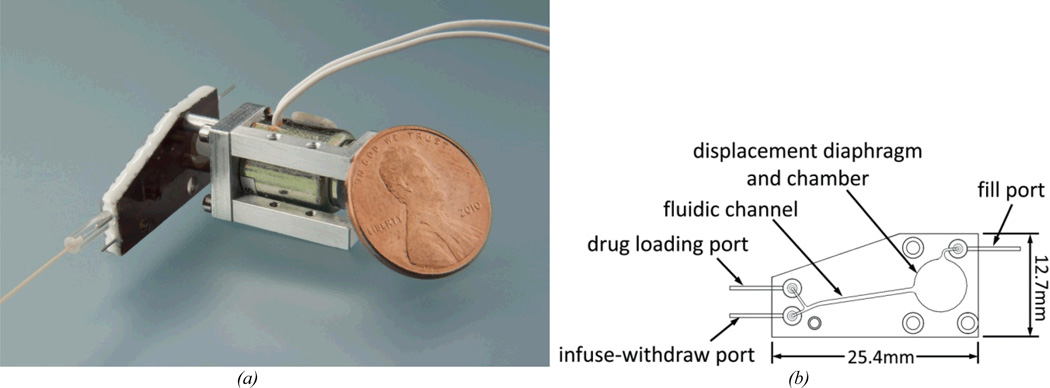
The reciprocating flow pump is responsible for the infusion and withdrawal cycles of the system. The pump consists of an enclosed displacement chamber capped with a flexible diaphragm. Channels connect the chamber to multiple ports that connect the pump to the other fluidic components in the system. Infusion is driven by a miniature commercial electromechanical actuator (Bicron, Canaan CT) that, when powered, presses on the diaphragm and drives fluid out of the displacement chamber and ultimately through the cannula outlet. When the actuator is turned off, a small spring causes the actuator to retract its initial position; the diaphragm relaxes and spontaneously returns to its neutral state, drawing the same volume of fluid back into the chamber. The diaphragm dimensions were selected to optimize the actuation force required to deflect the diaphragm against the opposing fluid pressure and membrane restoring force. These calculations are described in “Modeling the reciprocating flow pump.” The diaphragm is a 25.4 µm thick polyimide film, the displacement chamber is 6.5 mm in diameter by 483 µm deep. The chamber and channels were fabricated from machined and laminated polyimide sheets, chosen for biocompatibility and process compatibility. We have described the fabrication method in detail elsewhere44. The actuator was powered either by a computer-controlled power supply, or by custom electronics in the packaged animal-mountable system described in “System control and packaging.” The displacement chamber was connected to the drug loading and infuse-withdaw ports via the fluidic channel, as illustrated in Figure 3b.
Figure 3.
(a) The polyimide-based reciprocating flow pump with miniature electromechanical actuator. (b) Drawing of the reciprocating flow pump fluidics.
In the complete controllable dose system, the reciprocating pump was connected to the drug reservoir and cannula through a T-junction (see Figure 2b). The T-junction was fabricated from laminated machined polyimide. Its design minimized internal fluid volume (175nL) and facilitated the placement and securing of the cannula during implantation in the animal. The internal volume of the fluid path between the T-junction and the cannula outlet determines the amount of residual drug that is infused in each cycle. One branch of the T-junction connected to the proximal segment of the cannula. The other branches of the T-junction connected to the infuse-withdraw port of the reciprocating pump and to the drug reservoir. The lengths and inner diameter dimensions were used to tune the relative resistances in the fluid network so that the fluid preferentially flows through the infuse-withdraw line and the cannula during the infuse-withdraw stage, and not through the reservoir loop. The use of designed passive resistances here enabled operation of the system without the need for active valves. The cannula was designed to be inserted into the cochlea through a drilled cochleostomy (~200 µm in diameter). The implanted portion of the cannula was made from a 12 mm length of polytetrafluoroethylene tubing (Sub Lite tubing, 101 µm ID × 201 µm OD, Zeus Inc., Branchburg NJ).
The drug reservoir was designed to store drug solution at high concentration for delivery through the cannula. It consisted of a long serpentine channel with cross sectional dimensions of 1.0 × 0.381 mm and total length of 61.2 cm. The total volume of fluid contained in the reservoir was 233 µl; the outside dimensions were 40 × 30 × 1.1 mm. The channel dimensions were selected to satisfy tradeoffs in performance: A small hydraulic diameter reduces unwanted diffusion and Taylor dispersion, and therefore helps to isolate the fresh drug supply from the diluted withdrawn solution; however, a small diameter also increases fluidic resistance and therefore the work required of the drug loading pump; additionally, a small diameter results in a less compact component, since more volume is taken up by channel sidewalls as the length of the reservoir increases. The serpentine channel layout minimizes the footprint of the reservoir, though its turns may introduce some convective mixing. The reservoir was fabricated using the polyimide lamination process. To reduce vapor transport, a glass cover slide (0.23 mm thick, Fisher Scientific, Hampton NH) was attached to each reservoir face with 0.05 mm thick acrylic adhesive film (type 465, 3M, Maplewood MN)
The drug loading pump drives flow around the internal fluid circuit from its outlet to the drug fill port, the internal connecting channel of the reciprocating pump, the infuse-withdraw port, the infuse-withdraw line, the T-junction, the reservoir, and back to the loading pump. We used a commercially manufactured micropump (Model mp6, Bartels Mikrotechnik, Dortmund Germany). The pump is driven by dual piezoelectric-actuated diaphragms in series, opposite in phase, each flanked by embedded check valves. For bench tests the pump was controlled by an external controller (Bartels Mikrotechnik) and a computer running Labview. The flow rate of the pump is set by adjusting the frequency and amplitude of its drive signal. We operated at a target flow rate of 10 µL/min, as measured with appropriate fluid resistance load. A low rate is desirable to reduce Taylor dispersion in the reservoir; this rate is near the pump’s minimum continuous rate.
Measurement and controller
Flow rate was measured by a thermal flow sensor with a range of ±40 µL/min (Model SLG1430-480, Sensirion AG, Switzerland). The flow sensor was used to measure flow at the cannula outlet, as well as flow between components within the system. When testing the reciprocating pump (see Figure 2a), the fill port and drug loading port were sealed with clamps, and the infuse-withdraw outlet of the pump was connected to the flow sensor with 8 cm of PEEK tubing with an inner diameter of 150 µm, and 3.2 cm of PEEK tubing with an inner diameter of 75 µm, to simulate the hydraulic resistance of the cannula and the tubing linking it to the reciprocating pump in the controllable dose system. A tube was connected to the flow sensor outlet and immersed in an open vessel. Both the flow sensor and outlet tubing had relatively large inner bore diameters and contributed negligible resistance to the fluid path.
To measure the mass delivered in a single cycle (i.e., the “dose”), we loaded the system with fluorescent dye and observed the resulting dye concentration in individual wells in a 384-well plate. The wells were pre-loaded with 35 µL of deionized water. The system was filled with 1.0 mg/ml sodium fluorescein solution and the outlet cannula was placed into a large water reservoir (>35 mL). To initialize the system, typically 10 cycles were completed prior to data collection. During the idle phase of the cycle, the tip of the cannula was positioned into a well and was held there while a single load, infuse, and withdraw cycle completed. Just prior to the next cycle, the cannula was positioned in a new well. When the measurement series was complete, the fluorescence intensity was recorded on a plate reader (Spectramax M2, Molecular Devices, Sunnyvale CA) which had been previously calibrated by serial dilutions. For ongoing, longer term measurements, the cannula outlet was submerged in the large water reservoir for multiple cycles until the next measurement series began.
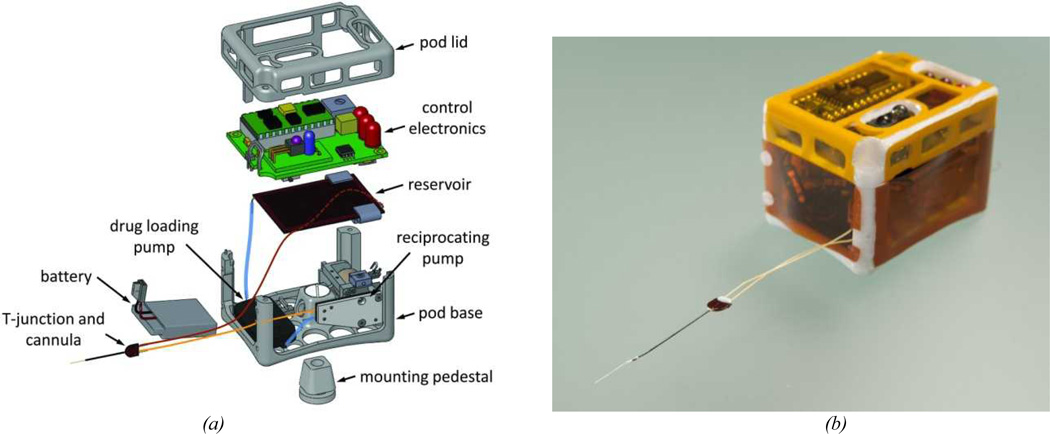
The wearable system, shown in Figure 4, was controlled by a programmable microcontroller chip (BASIC stamp, Parallax Inc., Rocklin CA). Operating conditions, including pumping durations, time interval between cycles, etc., were set using an infrared remote control and a board-mounted sensor (IR Buddy, Parallax Inc.). LEDs on the circuit board provided visual read-outs of the settings and preceded each pump cycle. A small potentiometer was used to adjust the voltage powering the reciprocating pump. The drug loading pump was controlled by a daughter board (Bartels Mikrotecknik), and the entire system was powered by a small polymer Lithium-ion battery (3.8 V output, 240 mAh charge, Tenergy, Fremont CA). The electronic and fluidic components were housed in a pod consisting of a 3D-printed polycarbonate frame enclosed in 25.4 µm thick polyimide film. The control unit and housing are similar to that reported previously43.
Figure 4.
(a) Exploded drawing of the controllable dose system packaged in a wearable system for guinea pig testing. Tubing is shown to indicate connectivity of components and is not drawn to scale. (b) Photograph of the assembled system.
Modeling the reciprocating flow pump
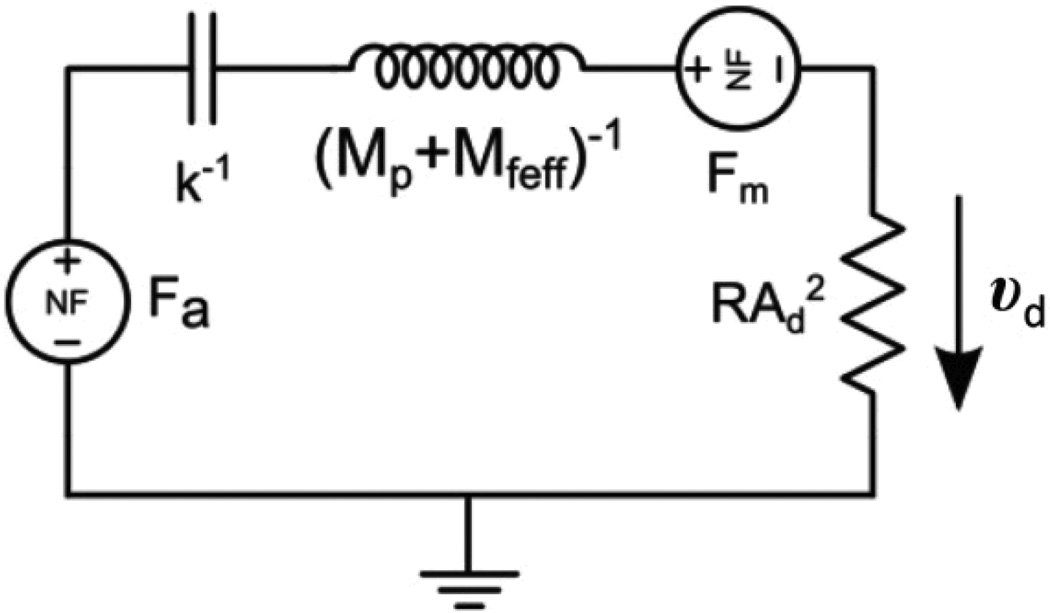
The reciprocating pump was designed using a combination of analytical and empirical models. We employed electrical circuit simulation tools and transformed the elements of our system to their electrical analogs (Microcap, Spectrum Software, Sunnyvale CA). For example, flow corresponds to current, pressure to voltage, and so forth. Fluid flows through the tubing, pump, and T-junction channels at low Reynolds numbers (<0.42) and produces pressure differentials that are linear with flow rate; hence fluid resistance was simulated with linear electrical resistance. In our model, we take the viscosity of the fluid to be that of water. The pump contains a combination of linear and non-linear elements, due to transduction from actuator voltage, to mechanical force on the diaphragm, and then to fluid displacement. In the iterated electrical simulation, the inputs are voltage to the actuator and the resulting position of the diaphragm; the output is a current, which is converted back to volumetric flow rate.
The variables used in the model are defined in Table 1. The flow rate Q, imparted by the pump, is proportional to the diaphragm velocity through the relationship Q = υd Ad /2, where we have approximated the deflected shaped of the diaphragm with a revolved parabola. The fluid thus exerts a restoring force on the diaphragm proportional to its velocity, and as such can be modeled as a damping element, or equivalently a resistor. The actuator applies a force to the diaphragm and the diaphragm develops a restoring force as it is deflected. Both the actuator and diaphragm forces are non-linear functions of displacement, and thus non-linear voltage elements were required in the simulations. The net force on the diaphragm is then a function of the actuator voltage and the position of diaphragm’s center and may be summarized as Meff dυd/dt = Fa(Vc,z) + Fs(z) + Ff(Vc,z) + Fd(z). These force elements are listed in Table 2 and shown in Figure 5. The initial positions z0a and z0s are incorporated in the expressions for the force output of the actuator (Fa) and spring (Fs), respectively. The center displacement of the diaphragm under no load (z0d) accounts for buckling of the diaphragm due to plastic deformation that can occur during the fabrication process. This deviation affects the restoring force function of the diaphragm (Ff)44. For the simulations, actuator shaft velocity was integrated to find diaphragm position, and this position was fed back to the (position-dependent) non-linear diaphragm and actuator force elements. The actuator shaft velocity is assumed equivalent to the diaphragm velocity (υd) and was obtained from the equation of motion using Fa and an effective inertial mass Meff as indicated in Table 2. The term Mfeff is the inertial mass of fluid in the infuse-withdraw line, scaled by the diaphragm-to-channel area ratio, because channel fluid velocity is higher than diaphragm velocity by this ratio.
Table 1.
Summary of variables used in the reciprocating pump model.
| Variables Used in the Model | |
| F | Force |
| Q | Flow rate |
| R | Fluidic resistance due to fluid viscosity and component geometry |
| υd | Axial velocity of diaphragm center |
| vol | Displaced fluid volume due to diaphragm deflection |
| Ma | Mass of actuator armature, includes shaft and head |
| Mfeff | Effective mass of moving fluid |
| z | Diaphragm center deflection |
| V | Actuator coil voltage |
| B | Stiffness term |
| D | Empirical coefficient for non-linear actuator force response to input coil voltage |
| Initial Conditions | |
| z0a | Actuator displacement offset |
| z0s | Spring deflection when fluid displacement volume is zero and actuator head is in contact with diaphragm |
| z0d | Diaphragm center deflection under no load (buckle displacement) |
| Pump Properties | |
| Ad | Diaphragm area |
| Ac | Cross sectional area of flow channel |
| a | Diaphragm radius |
| t | Diaphragm thickness |
| k | Spring constant of actuator return spring |
| Material Properties | |
| E | Tensile modulus of diaphragm |
| ν | Diaphragm Poisson ratio |
Table 2.
Summary of the system components and their models.
| Element | Model | Value(s) | Electrical analog and symbol: |
|
|---|---|---|---|---|
| Restoring force on diaphragm due to viscous pressure loss of fluid flow in tubing or channels | Ff = Q · R · Ad = υd · R · Ad2 |
R = 0.09 psi/(µL/min) Ad = πa 2 = 33 mm2 |
 |
|
| Restoring force of circular elastic diaphragm (Bending forces neglected because displacements > thickness44) |
Fd = B[(vol/C)3 – z0d3] (vol = Cz) |
C=πa2/2; |
E = 3.5 GPa t = .025 mm ν = 0.3 a = 3.25 mm z0d = 0.01 mm |
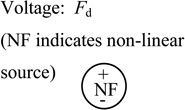 |
| Restoring force of coil spring | Fs = k(z0s - z) |
k = 0.162 N/mm z0s = 0.70 mm |
 |
|
| Inertial masses | Meff = Ma + Mfeff |
Ma = 1 gram Mfeff = 5 milligram · (Am/Ac) = 9.1 gram |
 |
|
| Actuator force (empirical fit to published data for small displacements) | Fa = D (z + z0a) V2 |
D = 0.296 N/(V2·mm) z0a = 0.195 mm |
 |
|
Figure 5.
Schematic of electric circuit simulation used to model the reciprocating flow pump. The model includes the transduction of electrical input to fluidic output via the actuator.
Results
Reciprocating pump performance
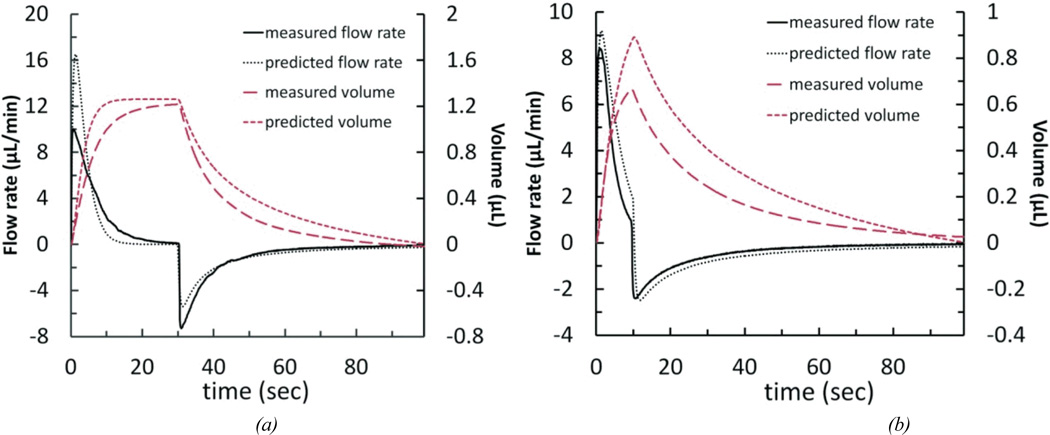
We measured the output flow of the simplified reciprocating flow pump system in the configuration shown in Figure 2a. Figure 6 shows measured and modeled output flow and volume for two cases: a 3.5 V step voltage with 30-second duration achieving about 1.23 µL of infused-withdrawn fluid volume, and a 2.8 V step voltage with 10-second duration producing about 0.67 µL. When actuator power ceases, the spring causes the head on the actuator shaft to retract and the flow reverses direction as the diaphragm returns to its neutral position. The displaced volume was calculated by integrating the flow rate over time. Volume calculations, as well as measured displacement of the meniscus of a partially-filled transparent tube at the cannula outlet, confirmed zero net fluid volume change in the system. The data demonstrates the ability to control the maximum displaced volume through applied voltage. Increases in voltage amplitude increase peak flow rates and the diaphragm distention and thus volume for a given duration. Step duration also impacts volume, but, except for very short durations, does not alter peak flow rate. These two variables, over a limited range, can be used to tune the displaced volume while keeping the peak flow rate below the desired maximum.
Figure 6.
Simulation results for the simplified reciprocating flow pump system, compared with experimental flow data. (a) 3.5 V held for 30 seconds; measured values are from the average of 2 pump cycles. (b) 2.8 V held for 10 seconds; measured values are from the average of 3 pump cycles.
The model predicts both of these control elements, in addition to capturing the essential non-linear force characteristics of the diaphragm (The parameters are shown in Table 2 and Figure 5.). This is demonstrated by the nearly pulse-like nature of the flow. Immediately after the drive voltage is applied, the actuator force increases rapidly, while the diaphragm restoring force is initially low because it is not distended. This condition does not persist because the diaphragm restoring force is a much stronger function of displacement and thus quickly neutralizes the actuator force. Despite using our best measurements of initial actuator position and diaphragm buckle, however, the model produces substantial error in quantitatively predicting the maximum flow rate. Multiple error sources are likely to contribute. Bubbles are removed from the system to the extent possible, but any remaining produce a compliance which will reduce peak flow rates. In addition, the relative opposing forces of the actuator and the diaphragm depend strongly on the point in the actuator’s throw range where it first engages the diaphragm and the diaphragm’s extent of buckle. Because the diaphragm force curve is highly non-linear (third order over much of the deflection range), small errors in measuring this point of engagement (which is captured in the model by the actuator offset term z0a) result in significant error in maximum predicted flow rate44. With these limitations, the model still provides utility as a design guide.
Non-step function voltage waveforms
We have shown that the properties of the flow rate profile can be tuned using different voltages and voltage durations. The output flow waveform can be further manipulated by replacing the simple step voltage with more complex voltage wave forms. This permits a degree of variability between the relative flow rates and infuse volumes. For example, by controlling the voltage and hence the force of the actuator on the diaphragm, the infuse flow rate can be reduced while maintaining a fixed infuse volume. This is useful in our therapeutic application, where low flow rates may be safer for the cochlea.
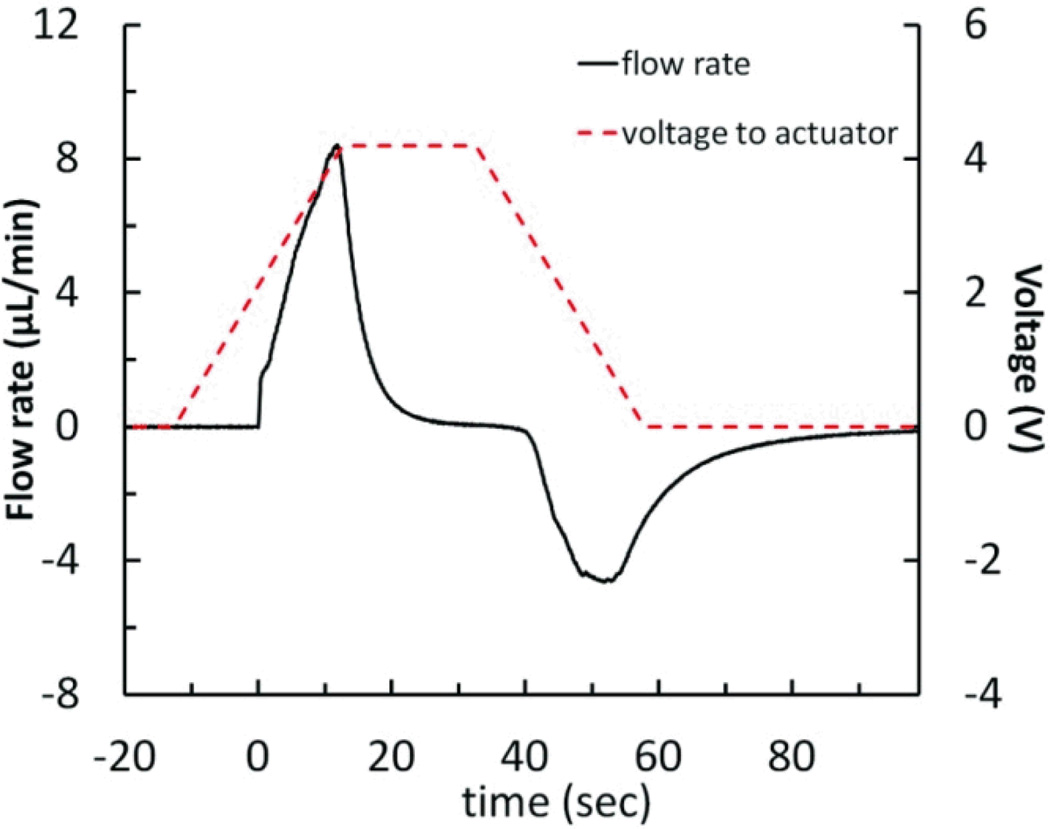
A simple application of this principle utilizes a ramped actuator voltage profile with the reciprocating pump system (Figure 7). As the voltage is ramped from 0 to 4.2 V at 1.67 V/sec, the actuator gradually increases the force on the diaphragm over time. The force of the actuator on the diaphragm as it begins to deform is low, resulting in a sloped increase in flow rate, as opposed to the impulse-like behavior seen with the step voltage. As the diaphragm restoring force increases with displacement, the ramped voltage profile causes the deforming force on the diaphragm to increase. The infuse flow rate peaked at +8.41 µL/min. The held voltage of 4.2 V is higher than that used in a typical step voltage-driven pump cycle, resulting in greater-than-typical fluid displacement of 1.52 µL. Finally, the voltage ramps down from 4.2 to 0 V at −1.67 V/sec. Again, instead of the typical rapid diaphragm restoration, the actuator supports the diaphragm as it gently relaxes, generating a peak withdraw flow rate of −4.64 µL/min ; this can be compared to the result shown in Figure 6 a, where the peak infuse and withdraw flow rates are +10.12/−7.05 µL/min at a step voltage of 3.5 V, and the displaced fluid volume is 1.26 µL for a 30-second held voltage.
Figure 7.
Measured flow rate data for the reciprocating flow pump system using a ramped voltage profile (0 to 4.2 V in 25.2 seconds, held for 20 seconds, then 4.2 to 0 V in 25.2 seconds), resulting in peak infuse and withdraw flow rates that ramp to +8.41 and −4.64 µL/min, while displacing 1.52 µL of fluid. Flow rate values are from the average of 3 pump cycles.
Long-term testing results
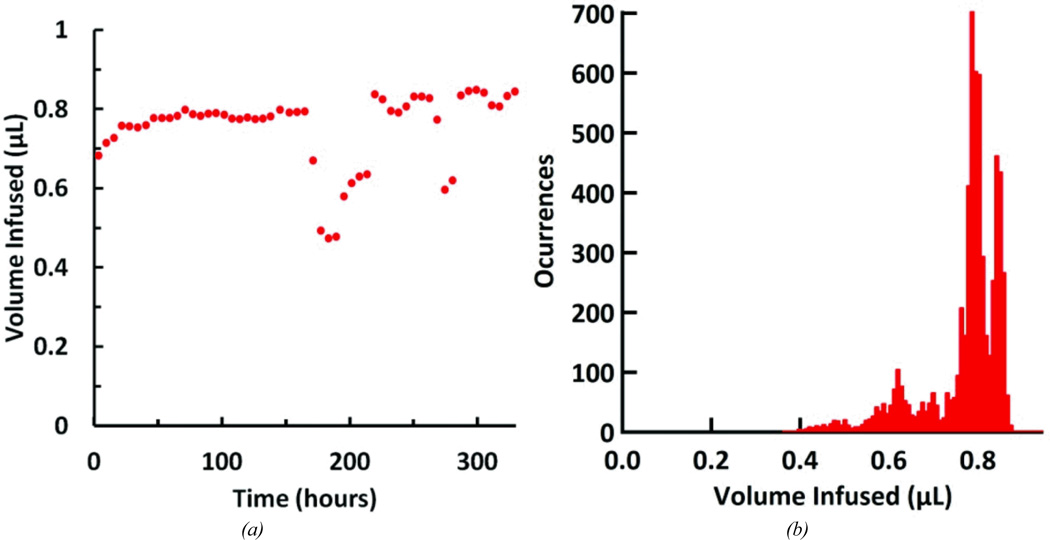
The simplified reciprocating flow pump system was set up to run for several weeks to gauge performance at longer time scales. The system was tested for 13.7 days, completing approximately 6580 pumping cycles (The experiment was terminated due to flow sensor error.). The actuator was driven by a 10-second, 3 V step voltage every 3 minutes. The system was kept at room temperature and humidity. Flow data was continuously recorded over the entire test. The mean infusion volume, calculated by integrating the measured flow rate, was 759 ± 91 nL (See Figure 8a). A histogram of infused volume shows the distribution of these volumes throughout the experiment (Figure 8b). Over the experiment, the mean peak flow rate per cycle was 7.25 ± 0.59 µL/min, with a maximum peak of 9.56µL/min. At several periods during the experiment, the infused volume decreased significantly and then recovered to previous values. The reason for the deviations is not known, but we attribute them to bubbles moving through the fluid network. Bubbles may inadvertently form during priming or arise from dissolved gases. At some positions small bubbles should have a large impact, while at other positions they will not. For example bubbles at junctions, in the cannula, or in the flow sensor will alter output measurements, while the system is more tolerant of bubbles in the loading pump, displacement chamber, or reservoir.
Figure 8.
Performance of the reciprocating pump system over the course of the 13.7 day test. (a) Infused volume per pumping cycle; each point represents the average infusion volume over a 6-hr period centered around the time point on the graph. (b) Histogram of infused volumes; volumes were grouped into 8 nL wide bins.
Acute in vivo experiments
Animal experiments were performed to provide preliminary validation of the reciprocating pump system. With the outlet cannula implanted in the guinea pig cochlea, we monitored hearing while delivering a test compound known to temporarily elevate auditory thresholds. The results of such tests can be compared with those from previous device configurations to assess the operational characteristics of the system.
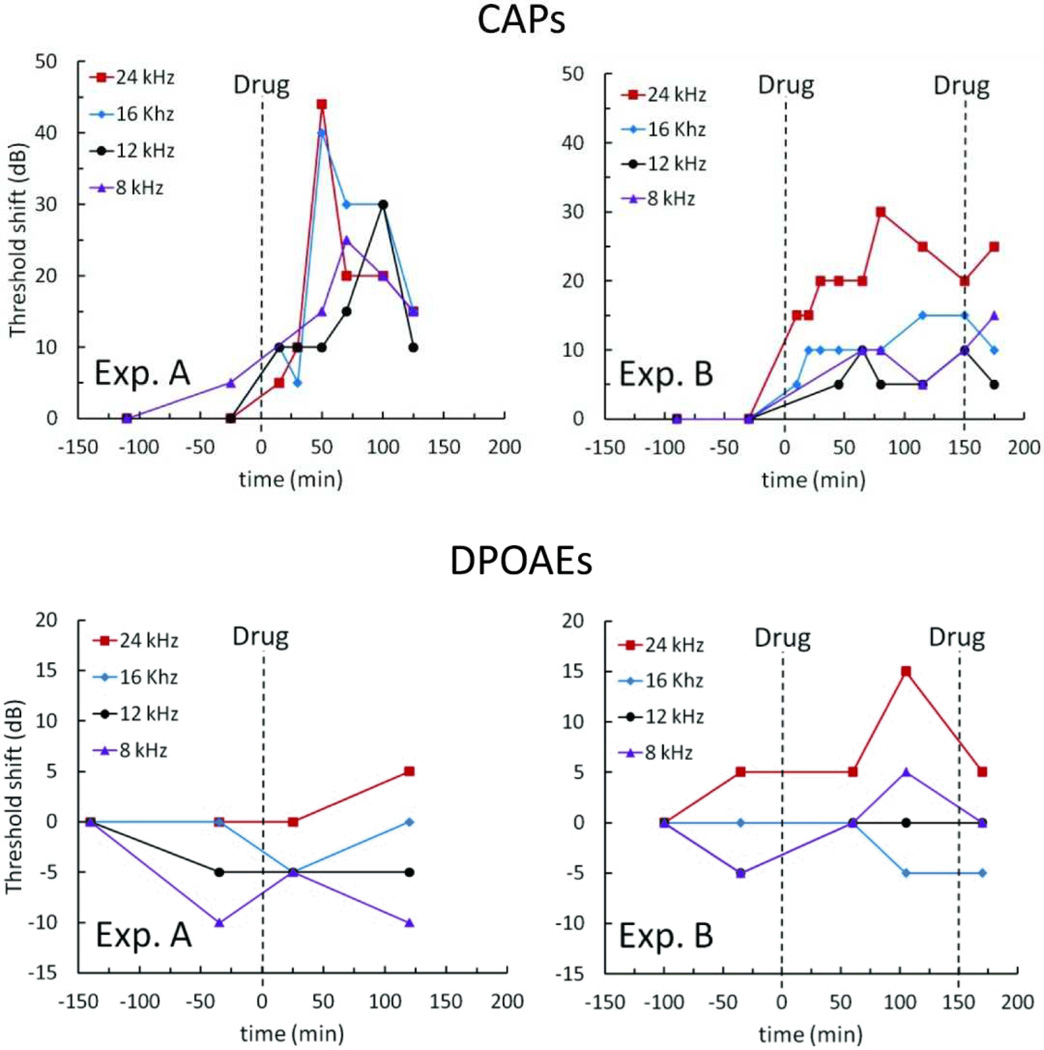
Methods for in vivo testing of reciprocating introcochlear drug delivery have previously been reported45. For these present experiments, the reciprocating pump was connected in series with the flow sensor and a previously developed cannula. The inserted portion of the cannula was a short length of polyimide-coated fused silica tubing (75 µ m ID × 150 µ m OD × 6 mm long). Small bore vinyl tubing sleeves were used to connect the cannula to 2.5 cm of PEEK tubing with an inner diameter of 75 µm, which connected to 8 cm of PEEK tubing with an inner diameter of 150 µm and the flow sensor. Due to surgical requirements this cannula was later replaced in the complete controllable dose system with the PTFE cannula described above; however, the fluidic characteristics were designed to be similar. Prior to implantation, the system was filled with artificial perilymph (AP). The cannula was placed in the cochleostomy, and several infuse-withdraw cycles were executed with just the artificial perilymph to establish a baseline. Immediately afterward, pumping was suspended and a large-bore length of glass tubing filled with test compound was placed in series between the cannula and the flow sensor. The compound used was 6,7-dinitroquinoxaline-2,3-dione (DNQX), a glutamatergic antagonist, at 300 µM, dissolved in AP. The solution has a viscosity comparable to water. Pumping resumed, and drug response in the cochlea was measured by monitoring the effect of the DNQX on the auditory nerve compound action potentials (CAPs). Due to the tonotopic organization of the inner ear, the spatial distribution of drug is indicated by the influence on CAPs as a function of frequency. The distortion product otoacoustic emissions (DPOAEs) monitor hair cell activity and are not affected by the drug. Therefore, they can be used to determine whether hair cells have been damaged either by the surgery or by fluid mechanical effects. DPOAEs were monitored during the experiments to confirm that any changes in CAPs were due to drug and not from other effects. Measurements were recorded before surgery, after placement of the cannula, during infusion of AP, and during infusion of the DNQX solution. All procedures were conducted with the approval of the Animal Care and Use Committee of the Massachusetts Eye and Ear Infirmary.
Results from two experiments are shown in Figure 9. The cannula was implanted near the 24 kHz region near the base of the cochlea. The DNQX-filled tube was inserted at t=0. CAPs were monitored at characteristic frequencies from 8 to 24 kHz. CAP threshold shifts were generally location dependent, with thresholds at basal locations shifted to a greater degree than apical frequencies. Throughout the monitoring period, DPOAE thresholds remained consistent, suggesting that the CAP shifts resulted solely from DNQX administration. For Experiment A, the reciprocating pump drove a mean infuse-withdraw volume of 0.64 µL at 3 minute intervals, while in Experiment B the mean infuse-withdraw volume was 1.18 µL at 3–4 minute intervals. In both experiments, the CAP thresholds rose for approximately 60 minutes and then began to recover to pre-DNQX levels or stabilize, though this trend is less distinct in Experiment B. In Experiment B, the system was paused again and the drug-filled tube was manually reloaded at the 150-minute time point. The short duration of the apparent drug effect was expected, because without the reservoir and loading components, reciprocating flow results in rapid dilution of the dispensed drug. (Compare this decline in drug effect with the decline in dose shown below in Figure 11a, in the section “Drug loading and controlled dose results,” where the drug loading is intentionally suppressed.) The results display similarities to prior reciprocating flow delivery data acquired with earlier microfluidic device iterations42, 43, 46, and while these results are preliminary, they demonstrate that our reciprocating pump system can deliver drugs to the inner ear and can induce measurable changes in hearing function that are consistent with the predicted effects of DNQX. Further experiments are required to fully characterize in vivo performance.
Figure 9.
In vivo experiment results for the reciprocating pump system showing acute delivery of drug. Drug supply was introduced to the system at t=0 in both experiments and again at t=150 minutes in Experiment B only. For Experiment A, the mean volume for each infuse cycle was 0.64 µL respectively at a period of 3 minutes. For Experiment B, these values were 1.18 µL at a period of 3–4 minutes.
Figure 11.
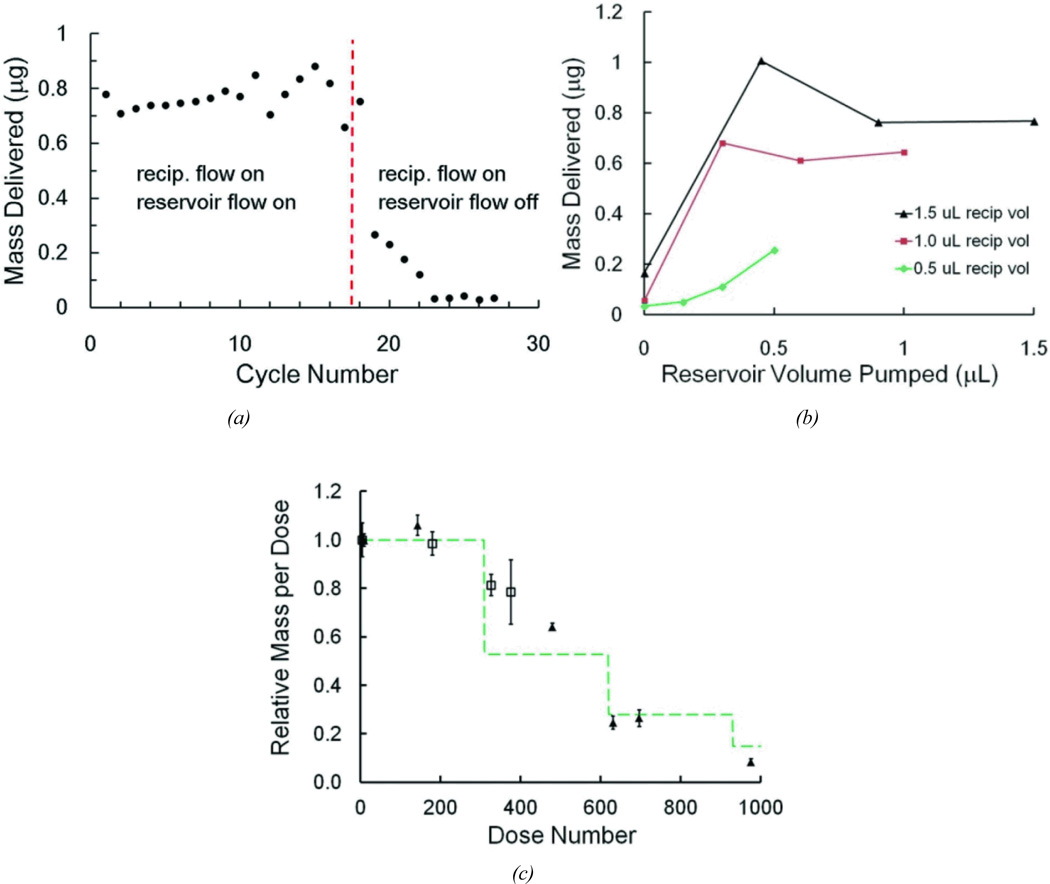
Results for controlled dose experiments using the system to dispense dye into microwells. (a) Cessation of dosing while reciprocating flow continues by halting operation of the drug loading pump. (b) Dose measurements under varying conditions of reciprocating flow volume drug loading volume. (c) Long-term dose measurements showing dilution after initial reservoir volume is exhausted. The two different symbols are from two separate runs.
Controllable dose system
The controllable dose system, comprising the reciprocating pump, the T-junction and cannula, the reservoir, and the drug loading pump was assembled and tested. We characterized the flow rate in the network with the added drug loading cycle. We also measured the resulting mass transfer of individual doses under varying conditions.
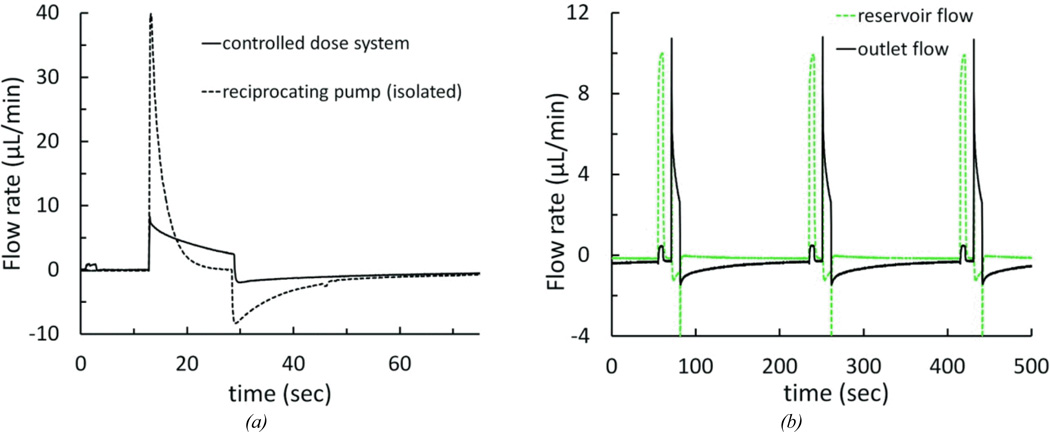
The addition of the drug loading loop necessitated modified operating conditions to maintain the desired infuse-withdraw volume. The drug loading pump introduced a source of hydraulic compliance to the circuit; we measured the compliance of the pump to be approximately 2 µL/psi at 1 psi. The impact of this compliance is shown in Figure 10a. The voltage required to achieve an infuse volume of 1.16 µL was 5V; the peak flow rate was 8.3 µL/min. The drug loading pump and reservoir were then removed from the fluid circuit by placing a clamp between the reciprocating pump and drug loading pump, and another between the T-junction and the reservoir. Removal of the drug loading pump and reservoir compliance caused the measured peak reciprocating flow rate to exceed the flow sensor range (>40 µL/min), resulting in an infusion volume of at least 1.65 µL (an increase of >390% and >42%, respectively).
Figure 10.
Flow rate profiles for the controllable dose system (a) Flow rate measured at the cannula outlet for the complete system at normal operating conditions, and with the reciprocating pump and infuse-withdraw line fluidically isolated by clamping off the drug loading pump and reservoir. The cycle had a 10-second drug loading pump stage, 5 V 16-second reciprocating pump infuse stage, followed by a 10-minute idle stage. (b) Reservoir flow and outlet flow for a system operating at 10-second drug loading stage, a 5 V 16-second reciprocating pump infuse stage, followed by a 3-minute idle stage.
Once the reciprocating flow was tuned to compensate for the additional components in the network, we characterized both the internal and output flow throughout the complete operational cycle. Two flow sensors were temporarily used to simultaneously record the flow at the cannula outlet and at a point between the T-junction and the reservoir. Figure 10b shows the flow sequence through three identical cycles. At the beginning of the cycle, when the loading pump is activated for 6 seconds, flow through the reservoir rises to about 10 µL/min, while only a small amount of flow is observed exiting the system. This measurement is consistent with the desired loading flow, where fluid circulates around the loop within the system, to prepare a dose, but is not yet delivered. Integrating the flow rate during the load steps shows a mean load volume of 1012 nL, and outlet infusion of less than 25 nL. About 10 seconds after loading has completed, the actuator is powered to initiate reciprocating flow. At the outlet flow sensor, the characteristic flow discussed above is observed. In the reservoir loop, a small negative flow (i.e., from reservoir toward the outlet-junction) occurs during the infuse pulse. This is expected, since during infusion the loop provides a flow path in parallel with the infuse-withdraw line, but has about tenfold the resistance of that fluidic path. Upon releasing the actuator, the withdraw step begins and flow at the outlet reverses. At this transition, a spike of negative flow is seen at the reservoir node. We attribute this to relaxation of compliant elements in the drug loading and reservoir loop, such that flow is moving from this branch through the T-junction and toward the reciprocating chamber. The volume corresponding to these events is less than about 170 nL of “reverse” flow through the reservoir. For the remainder of the withdraw phase, flow in the reservoir is negligible.
Drug loading and controlled dose results
We characterized the drug loading cycle and the resulting mass transfer of individual doses under varying conditions of load volume and reciprocating volume, measured the incidental release of compound during the nominal zero dose, and monitored the concentration per dose as the reservoir becomes depleted. In these tests, the flow sensors were removed and the repeatability and dose control were monitored by measuring the dosing of fluorescent dye into water-filled microwells. Figure 11a shows the doses delivered to 17 individual wells with both reciprocating and dosing phases operating. At the 18th cycle, the reservoir pump was turned off while measurement continued. The mass transfer of dye to the well diminished rapidly, falling to less about 4% of the average delivered in the initial cycles. The residual dose is likely due to the trace flow through the reservoir branch during reciprocating flow and to diffusion at the junctions. For these data the reciprocating volume was 1500 nL and the load volume was 1500 nL.
Because the dose delivered is sensitive to both the reciprocating volume and the load volume (the volume circulated by the drug loading pump), we varied these parameters to observe their impact on mass transfer. Figure 11b shows measurements in 12 different combinations of the settings. Each data point is an average of at least 10 cycles each dispensed into individual microwells. In all cases, the final volume of dye solution delivered is less than the reciprocating volume. Several factors, discussed below, may contribute to this effect, but we attributed this mainly to the likelihood that the withdraw phase retracts a portion of the dye that was just infused, since mixing of dye with the water in the microwell is minimal under these conditions.
In long term operation, once the cumulative repeated load volume is approximately equal to the initial volume in the reservoir loop and infuse-withdraw line, the solution pumped in each load cycle is no longer at full concentration. The infused solution will be eventually diluted by the fluid drawn into the network during prior withdraw phases. Figure 11c tracks this effect as a long series of doses was delivered into a large water reservoir and output was sampled intermittently in microwells. In this case, each dose comprised pumping of 1 µL for the load phase, and reciprocating volumes were a nominal 1 µL. Because the internal volume was 306 µL for the components in the reservoir loop and infuse-withdraw channel, the ideal system would produce 306 cycles of 1 µL at constant concentration before the effects of dilution appear. Likewise, as the delivery continues and the diluted fluid is further diluted in the second round of cycles, another concentration drop at 612 cycles would be anticipated, and so forth as the dilution continues. In the plot shown, the measured data (again averaged from at least 10 measurements at each time point) is compared with a greatly simplified calculation, which takes this dilution into account.
The calculation omits the effects of Taylor-Aris dispersion and diffusion and simply assumes a fixed ratio of dilution with each cycle. In other words, the mass of dye remaining in the well is reduced by the withdrawn mass in the fluid plug that reenters the device. The ratio of mass actually delivered vs. infused mass, 0.8, was approximated, based on the range observed in Figure 11a and Figure 11b. The infuse-withdraw volume could not be measured directly during this experiment and was adjusted to 0.7 µL to fit the experimental data. The calculation considers the internal volume of the cannula between the T-junction and the outlet, as this volume also contributes to the dilution with each cycle.
System control and packaging
The packaged controllable dose system (shown in Figure 4) was assembled and tested. Flow rate and mass transfer of dye were measured in vitro to confirm that the self-contained device performed as expected. Theoretical power consumption was calculated and compared with experimental measurements.
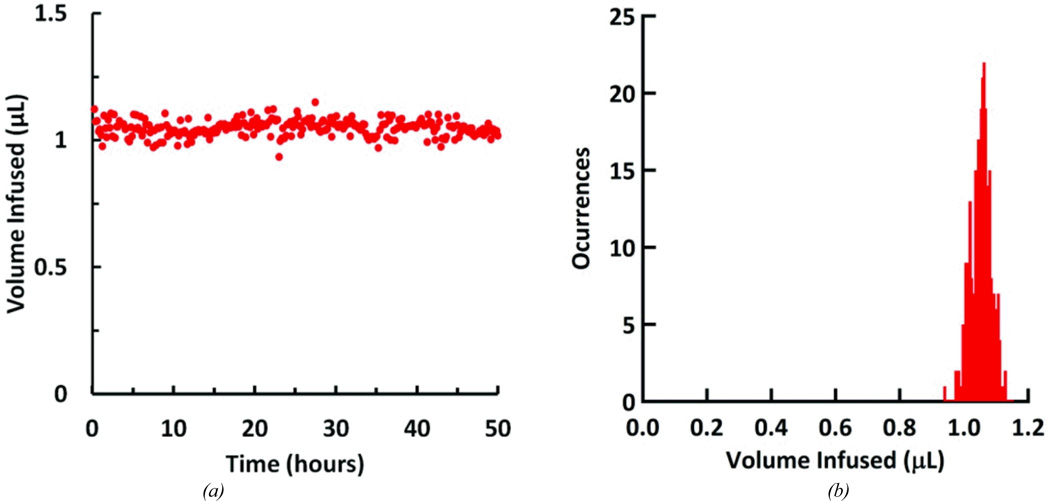
The packaged controllable dose system was set up and run using the battery and control electronics for 50.13 hours. Battery changes were made frequently to ensure uninterrupted operation. The operating conditions were: a 6-second drug loading pump stage, a 5 V 10-second infuse stage, followed by a 3-minute idle stage. Flow rate at the cannula outlet was measured continuously. The system was kept at room temperature and humidity. The mean infusion volume, including both flow infused during the drug loading cycle and the infuse stage of the reciprocating cycle, was 1.048 ± 0.031 µL (Figure 12a). Over the experiment, the mean peak flow rate was 8.064 ± 0.298 µL/min, with a maximum peak of 8.963 µL/min (Figure 12b).
Figure 12.
Integrated system performance over the course of the 50.13 hour test. (a) Infused volume for each pumping cycle. (b) Histogram of infused volumes; volumes were grouped into 8nL wide bins.
The final system dimensions were 85.1 cm3 (5.63 × 4.13 × 3.66 cm), weighing 50 g. By gradually adding 50 g of weight to an empty pod mounted on a guinea pig, the animal could be conditioned and strengthened to carry the load with no ill effects. Guinea pigs displayed apparently normal behavior and health while wearing the device for at least 30 days.
The electronic controls were designed to use minimal power. The components with the greatest power draw were the reciprocating and refresh pumps (see Table 3). For a typical delivery scheme (6-second drug loading pump stage, 5 V 16-second infuse stage, 10-minute idle stage), the energy draw per cycle was 20.9 J, which results in approximately 157 cycles on a single 3.8 V 240 mAh battery. This corresponds to a theoretical battery run time of 26.1 hours, which concurs with a measured run time of 27.3 hours in a device operating at the same delivery scheme.
Table 3.
Energy usage of system components.
| component | duration (sec) | energy use per cycle (J) | % of total energy use per cycle |
|---|---|---|---|
| microcontroller | 36 | 0.616 | 2.94 |
| LEDs | 2.5 | 0.101 | 0.48 |
| drug loading pump | 6 | 0.958 | 4.57 |
| reciprocating pump | 16 | 19.3 | 92.0 |
Discussion
The results presented above represent significant advances toward a miniaturized reciprocating drug delivery device. The electromagnetic actuator, polyimide diaphragm, and displacement chamber produce consistent infuse and withdraw flows over thousands of cycles, and the drug loading pump and reservoir enable consistent dosing. The custom components (the reciprocating pump and reservoir) have been built in a format that can be integrated with other planar microfluidic components, anticipating future monolithic system designs. The complete system is small and lightweight enough for a guinea pig to wear indefinitely and battery charges can last for over a day at typical run conditions. Output performance can be tuned by electronic control of the pumps and can be further adapted by changing the mechanical parameters of the system. These changes could include: different diaphragm dimensions and material properties, adjustments to initial actuator position (e.g., at a gap from or pre-deflecting the diaphragm), and setting an actuator stroke limit. Further exploration of these variables will potentially lead to other useful modes of operation.
The system requires key further developments to achieve the miniaturization required for an implantable device. We have used commercial components for the reciprocating pump actuator and for the drug loading pump. Both of these components will need to be supplanted with smaller and more efficient mechanisms. The solenoid actuator used in the reciprocating pump and its associated mounting fixture are bulky and add undesirable mass. The duration of the infuse phase, which is selected to maintain low infuse flow rate, requires that the solenoid remain powered for several seconds. Furthermore, the actuator provides a surplus of force and stroke length, adding to power consumption, using 92% of the net energy per cycle.
A therapeutic device must use pump components with lower power draw: for example, a smaller electromagnetic component47 and preferably a bistable or latching actuator. Meanwhile, the piezoelectric drug loading pump is oversized for the present application, operating at a fraction of its capacity, given the fluid resistance in the network. Another drawback to the piezoelectric pump is the parasitic impact that its internal compliance has on the flow control. A smaller micropump with significant diodicity would improve performance and efficiency in the drug loading subsystem. Many pumps with appropriate characteristics have been demonstrated in the research literature48, 49. The commercial products we selected for this system were used to demonstrate the feasibility of the approach, but will be replaced by more advanced microfluidic components in future designs.
In addition to improved components, a challenge in the current configuration is sensitivity to variations in resistance and compliance. Increased resistance at certain segments of the network can result in large deviations from the ideal flow sequence. These resistance changes can arise from partial occlusion of tubing, from dimensional variations in fabrication, or from small bubbles trapped by Laplace pressure at microchannel or tube junctions. Similarly, intrinsic compliance in components or microbubbles can diminish the reciprocating volume or alter the dose volume. We anticipate that an integrated chip design, where most tube junctions are eliminated and where internal volumes are reduced, will alleviate many of these concerns. We note also that such challenges are amplified in our reciprocating flow device. In a conventional unidirectional infusion pump, the sensitivity to resistance and compliance is usually less.
The system incorporates a looped reservoir, which has advantages and drawbacks. In this configuration, each dose is pumped from one end of the reservoir into the load position while spent solution flows into the other end of the reservoir. The spent solution is a mixture of drug solution and endogenous fluid from the delivery site. The two liquids are separated by an intermediate zone, where some mixing occurs by diffusion and dispersion. The reservoir is designed with a length much greater than its width or height to minimize the extent of this intermediate zone. The data from Fig. 11 suggest that this approach is effective, since the dose is approximately constant through at least the first 180 cycles. Nevertheless, in some applications, even slight mixing of endogenous fluid with the drug supply may not be tolerable, and in those cases we envision a more conventional reservoir feeding drug into the reciprocating stream. In our developmental studies with guinea pigs, the looped reservoir has the benefit that no additional valves are required, that net delivered volume remains zero, and that a high percentage of the reservoir contents is transferred to the outlet.
Conclusion
We have designed, fabricated and tested a miniaturized wearable device capable of controllable, programmable, zero net volume drug delivery in animals. We have developed fabrication techniques that enable small-footprint, integrated planar microfluidic components that are compatible with surface-mounted electrical-mechanical elements; these components form the basis of a miniaturized integrated system. This integrated device has been tested on the bench in order to establish precise, reliable, and gentle pumping profiles suitable specifically for intracochlear delivery. We have also tested key components of the wearable system acutely in live animals through surgical implantation into the guinea pig cochlea, demonstrating flow parameters and drug transfer in a manner consistent with safe and efficacious delivery. These results lay the foundation for a miniaturized, fully implantable cochlear drug delivery system for human clinical applications.
Supplementary Material
Acknowledgments
We are grateful to William Sewell, Michael McKenna, and Sharon Kujawa of the Massachusetts Eye and Ear Infirmary for their guidance in establishing device goals and in performing in vivo measurements. This work was made possible by Grant Number 5 R01 DC006848-07 from NIH NIDCD.
REFERENCES
- 1.Holley MC. Drug Discov Today. 2005;10:1269–1282. doi: 10.1016/S1359-6446(05)03595-6. [DOI] [PubMed] [Google Scholar]
- 2.Lynch ED, Kil J. Drug Discovery Today. 2005;10:1291–1298. doi: 10.1016/S1359-6446(05)03561-0. [DOI] [PubMed] [Google Scholar]
- 3.Rybak LP, Whitworth CA. Drug Discov Today. 2005;10:1313–1321. doi: 10.1016/S1359-6446(05)03552-X. [DOI] [PubMed] [Google Scholar]
- 4.Mizutari K, Fujioka M, Hosoya M, Bramhall N, Okano HJ, Okano H, Edge AS. Neuron. 2013;77:58–69. doi: 10.1016/j.neuron.2012.10.032. [DOI] [PMC free article] [PubMed] [Google Scholar]
- 5.Izumikawa M, Minoda R, Kawamoto K, Abrashkin KA, Swiderski DL, Dolan DF, Brough DE, Raphael Y. Nat Med. 2005;11:271–276. doi: 10.1038/nm1193. [DOI] [PubMed] [Google Scholar]
- 6.Juhn S. Acta Otolaryngol Suppl. 1988;458:79–83. doi: 10.3109/00016488809125107. [DOI] [PubMed] [Google Scholar]
- 7.Juhn S, Rybak L. Acta Otolaryngol. 1981;91:529–534. doi: 10.3109/00016488109138538. [DOI] [PubMed] [Google Scholar]
- 8.Alexander TH, Weisman MH, Derebery JM, Espeland MA, Gantz BJ, Gulya AJ, Hammerschlag PE, Hannley M, Hughes GB, Moscicki R, Nelson RA, Niparko JK, Rauch SD, Telian SA, Brookhouser PE, Harris JP. Otol Neurotol. 2009;30:443–448. doi: 10.1097/MAO.0b013e3181a52773. [DOI] [PubMed] [Google Scholar]
- 9.Arnold W, Senn P, Hennig M, Michaelis C, Deingruber K, Scheler R, Steinhoff HJ, Riphagen F, Lamm K. Audiol Neurootol. 2005;10:53–63. doi: 10.1159/000082575. [DOI] [PubMed] [Google Scholar]
- 10.Pasic T, EW R. J Comp Neurol. 1989;283:474–480. doi: 10.1002/cne.902830403. [DOI] [PubMed] [Google Scholar]
- 11.Noushi F, Richardson RT, Hardman J, Clark G, O'Leary S. Otology & Neurotology. 2005;26:528–533. doi: 10.1097/01.mao.0000169780.84588.a5. [DOI] [PubMed] [Google Scholar]
- 12.Coleman JKM, Littlesunday C, Jackson R, Meyer T. Hear Res. 2007;226:70–78. doi: 10.1016/j.heares.2006.05.006. [DOI] [PubMed] [Google Scholar]
- 13.Iwai K, Nakagawa T, Endo T, Matsuoka Y, Kita T, Kim T-S, Tabata Y, Ito J. Laryngoscope. 2006;116:529–533. doi: 10.1097/01.mlg.0000200791.77819.eb. [DOI] [PubMed] [Google Scholar]
- 14.Ito J, Endo T, Nakagawa T, Kita T, Kim TS, Iguchi F. ORL J Otorhinolaryngol Relat Spec. 2005;67:272–275. doi: 10.1159/000089407. [DOI] [PubMed] [Google Scholar]
- 15.Endo T, Nakagawa T, Kita T, Iguchi F, Kim TS, Tamura T, Iwai K, Tabata Y, Ito J. Laryngoscope. 2005;115:2016–2020. doi: 10.1097/01.mlg.0000183020.32435.59. [DOI] [PubMed] [Google Scholar]
- 16.Tamura T, Kita T, Nakagawa T, Endo T, Kim TS, Ishihara T, Mizushima Y, Higaki M, Ito J. Laryngoscope. 2005;115:2000–2005. doi: 10.1097/01.mlg.0000180174.81036.5a. [DOI] [PubMed] [Google Scholar]
- 17.Praetorius M, Brunner C, Lehnert B, Klingmann C, Schmidt H, Staecker H, Schick B. Acta Otolaryngol. 2007;127:486–490. doi: 10.1080/00016480600895102. [DOI] [PubMed] [Google Scholar]
- 18.Ge X, Jackson RL, Liu J, Harper EA, Hoffer ME, Wassel RA, Dormer KJ, Kopke RD, Balough BJ. Otolaryngol Head Neck Surg. 2007;137:619–623. doi: 10.1016/j.otohns.2007.04.013. [DOI] [PubMed] [Google Scholar]
- 19.Pau H, Clarke RW. Clin Otolaryngol. 2004;29:574–576. doi: 10.1111/j.1365-2273.2004.00884.x. [DOI] [PubMed] [Google Scholar]
- 20.Lalwani A, Han JJ, Castelein CM, Carvalho GJ, Mhatre AN. Laryngoscope. 2002;112:1325–1334. doi: 10.1097/00005537-200208000-00001. [DOI] [PubMed] [Google Scholar]
- 21.Staeker H, Gabaizadeh R, Federoff H, Van de Water TR. Otolaryngol Head Neck Surg. 1998;119:7–13. doi: 10.1016/S0194-5998(98)70194-9. [DOI] [PubMed] [Google Scholar]
- 22.Hakuba N, Watabe K, Ohashi T, Eto Y, Taniguchi M, Yang L, Tanaka J, Hata R, Gyo K. Gene Ther. 2003;10:426–433. doi: 10.1038/sj.gt.3301917. [DOI] [PubMed] [Google Scholar]
- 23.Kawamoto K, Yagi M, Stover T, Kanzaki S, Raphael Y. Mol Ther. 2003;7:484–492. doi: 10.1016/s1525-0016(03)00058-3. [DOI] [PubMed] [Google Scholar]
- 24.Bowers WJ, Chen X, Guo H, Frisina DR, Federoff HJ, Frisina RD. Mol Ther. 2002;6:12–18. doi: 10.1006/mthe.2002.0627. [DOI] [PubMed] [Google Scholar]
- 25.Kesser BW, Hashisaki GT, Holt JR. Laryngoscope. 2008;118:821–831. doi: 10.1097/MLG.0b013e318164d0aa. [DOI] [PMC free article] [PubMed] [Google Scholar]
- 26.Hildebrand MS, Newton SS, Gubbels SP, Sheffield AM, Kochar A, de Silva MG, Dahl H-HM, Rose SD, Behlke MA, Smith JH. Mol Ther. 2008;16:224–236. doi: 10.1038/sj.mt.6300351. [DOI] [PubMed] [Google Scholar]
- 27.Staecker H, Brough DE, Praetorius M, Baker K. Otolaryngol Clin North Am. 2004;37:1091–1108. doi: 10.1016/j.otc.2004.05.001. [DOI] [PubMed] [Google Scholar]
- 28.Li H, Corrales E, Edge A, Heller S. Trends Mol Med. 2004;10:309–315. doi: 10.1016/j.molmed.2004.05.008. [DOI] [PubMed] [Google Scholar]
- 29.Nakagawa T, Ito J. Acta Otolaryngol. 2004;124:6–9. [Google Scholar]
- 30.Thorne M, Salt AN, DeMott JE, Henson MM, Henson OW, Jr, Gewalt SL. Laryngoscope. 1999;109:1661–1668. doi: 10.1097/00005537-199910000-00021. [DOI] [PubMed] [Google Scholar]
- 31.Swan EEL, Mescher MJ, Sewell WF, Tao SL, Borenstein JT. Adv Drug Del Rev. 2008;60:1583–1599. doi: 10.1016/j.addr.2008.08.001. [DOI] [PMC free article] [PubMed] [Google Scholar]
- 32.Handzel O, Wang H, Fiering J, Borenstein JT, Mescher MJ, Leary Swan EE, Murphy BA, Chen Z, Peppi M, Sewell WF, Kujawa SG, McKenna MJ. Audiology and Neurotology. 2009;14:308–314. doi: 10.1159/000212110. [DOI] [PMC free article] [PubMed] [Google Scholar]
- 33.LaVan DA, McGuire T, Langer R. Nature Biotechnology. 2003;21:1184–1191. doi: 10.1038/nbt876. [DOI] [PubMed] [Google Scholar]
- 34.Meng E, Hoang T. Ther Deliv. 2012;3:1457–1467. doi: 10.4155/tde.12.132. [DOI] [PMC free article] [PubMed] [Google Scholar]
- 35.Elman NM, Patta Y, Scott AW, Masi B, Ho Duc HL, Cima MJ. Clin Pharmacol Ther. 2009;85:544–547. doi: 10.1038/clpt.2009.4. [DOI] [PubMed] [Google Scholar]
- 36.Stevenson CL, Santini JT, Jr, Langer R. Adv Drug Del Rev. 2012;64:1590–1602. doi: 10.1016/j.addr.2012.02.005. [DOI] [PMC free article] [PubMed] [Google Scholar]
- 37.Johnson DG, Zhu XX, Frisina RD, Borkholder DA. Conf Proc IEEE Eng Med Biol Soc. 2007;2007:6617–6620. doi: 10.1109/IEMBS.2007.4353876. [DOI] [PubMed] [Google Scholar]
- 38.Johnson DG, Waldron MJ, Frisina RD, Borkholder DA. Implantable micropump technologies for murine intracochlear infusions. 2010 doi: 10.1109/IEMBS.2010.5627335. [DOI] [PMC free article] [PubMed] [Google Scholar]
- 39.Shepherd RK, Xu J. Hear Res. 2002;172:92–98. doi: 10.1016/s0378-5955(02)00517-8. [DOI] [PubMed] [Google Scholar]
- 40.Jolly C, Garnham C, Mirzadeh H, Truy E, Martini A, Kiefer J, Braun S. Adv Otorhinolaryngol. 2009;67:28–42. doi: 10.1159/000262594. [DOI] [PubMed] [Google Scholar]
- 41.Pararas EE, Borkholder DA, Borenstein JT. Adv Drug Deliv Rev. 2012;64:1650–1660. doi: 10.1016/j.addr.2012.02.004. [DOI] [PMC free article] [PubMed] [Google Scholar]
- 42.Chen Z, Kujawa SG, McKenna MJ, Fiering JO, Mescher MJ, Borenstein JT, Swan EE, Sewell WF. J Control Release. 2005;110:1–19. doi: 10.1016/j.jconrel.2005.09.003. [DOI] [PMC free article] [PubMed] [Google Scholar]
- 43.Fiering J, Mescher MJ, Leary Swan EE, Holmboe ME, Murphy BA, Chen Z, Peppi M, Sewell WF, McKenna MJ, Kujawa SG, Borenstein JT. Biomed Microdevices. 2009;11:571–578. doi: 10.1007/s10544-008-9265-5. [DOI] [PMC free article] [PubMed] [Google Scholar]
- 44.Mescher MJ, Swan EE, Fiering J, Holmboe ME, Sewell WF, Kujawa SG, McKenna MJ, Borenstein JT. J Microelectromech Syst. 2009;18:501–510. doi: 10.1109/jmems.2009.2015484. [DOI] [PMC free article] [PubMed] [Google Scholar]
- 45.Pararas EEL, Chen Z, Fiering J, Mescher MJ, Kim ES, McKenna MJ, Kujawa SG, Borenstein JT, Sewell WF. J Control Release. 2011;152:270–277. doi: 10.1016/j.jconrel.2011.02.021. [DOI] [PMC free article] [PubMed] [Google Scholar]
- 46.Sewell WF, Borenstein JT, Chen Z, Fiering J, Handzel O, Holmboe M, Kim ES, Kujawa SG, McKenna MJ, Mescher MM, Murphy B, Swan EE, Peppi M, Tao S. Audiol Neurootol. 2009;14:411–422. doi: 10.1159/000241898. [DOI] [PMC free article] [PubMed] [Google Scholar]
- 47.Mescher MJ, Dube CE, Varghese M, Fiering JO. Surface mount microfluidic flow regulator on a polymer substrate. Squaw Valley CA: 2003. [Google Scholar]
- 48.Laser DJ, Santiago JG. Journal of Micromechanics and Microengineering. 2004;14:R35. [Google Scholar]
- 49.Iverson BD, Garimella SV. Microfluidics and Nanofluidics. 2008;5:145–174. [Google Scholar]
Associated Data
This section collects any data citations, data availability statements, or supplementary materials included in this article.


