

Abstract
Vitamin D deficiency has been associated with pathogenesis of autoimmune diseases including SLE; however, there were still lack of data about the effects of administration of vitamin D in immune regulation in SLE patients. The aim of this study was to investigate the effects of calcitriol/1,25(OH)2D3 on dendritic cells maturation and Th17 and Treg cells activation in SLE patients with hypovitamin D. The monocytes and lymphocytes of five SLE patients with hypovitamin D were divided into 4 groups, P0 (0 nM/control), P1 (1 nM), P2 (10 nM), and P3 (100 nM) as cultured samples. Flowcytometry analysis was used to evaluate dendritic cell maturation (the percentage of CD40, CD86, and HLA-DR expression) and the amount of Th17 and Treg cells (the percentage of Th17 and Treg cells). Cytokines production of IL-12, IL-17A, and TGF-β measured by ELISA. This study showed significant differences in CD40, CD86, HLA-DR expressions, and Th17 percentage in 10 nM of 1,25(OH)2D3 compared to that of control. For cytokines secretion, there was also significant difference between IL-12p70 and IL-17A levels in 10 nM of 1,25(OH)2D3 compared to that of control. The 1,25(OH)2D3 increased Treg cells and TGF-β level but not significant. Our study concluded that 1,25(OH)2D3 inhibited dendritic cells maturation and Th17 cells activation in SLE patients. The 1,25(OH)2D3 increased Treg cells but not significant.
Keywords: Calcitriol [1, 25(OH)2D3], dendritic cell, Th17 cells, Treg cells, systemic lupus erythematosus
Introduction
Systemic Lupus Erythematosus (SLE) is a chronic systemic inflammatory disease with high morbidity and mortality. In Indonesia, life expectancies of SLE patients are still low, 70% for 5 years survival rate and 50% for 10 years survival rate [1]. Pathogenesis and etiology of SLE remains unclear, but evidences suggest that hyperactivity of T helper 17 (Th17) cells associated with alteration of T regulator (Treg) cells function and abnormality of dendritic cells (DC) cause the activation of T and B cells to produce high amount of antibodies and induce toxic inflammatory mediators in tissues that are very important in disease progressivity of SLE patients [2].
A relatively new subset of CD4 Thelper, identified by released of interleukin (IL)-17A, IL-17F, and IL-22, called Th17, has important role in inflammatory process and leads to tissue damage [3,4]. The increased level of IL-17A that secreted by Th17 cells was detected in patients with autoimmune diseases, such as SLE [5]. In contrast, Treg cells have role in immune system regulation by suppressing autoreactive T cells [6].
One of extraskeletal function of vitamin D is involved in regulation of immune response. Immunologic effects of 1,25(OH)2D3 include down-regulating Th1 immune responses, modulating DC maturation, and lowering proliferation of activated B cells, yet in the contrary up-regulating regulatory T cells and preserving innate immune responses [7]. Vitamin D deficiency is associated with an increase of progressivity of autoimmune diseases [8-10]. A decrease of vitamin D level increases IL-6 level and reduces TGF-β level [11]. TGF-β is important for activating trancription factors to induce naive T Helper (Th0) toward T regulator [12]. Interleukin-6 induces trancription factor STAT3 toward retinoic acid-receptor-related orphan receptor-γt (RORγt) expression. RORγt would inhibit FoxP3 in order that Th0 would not be induced toward Treg, but toward Th17, producing proinflammatory cytokines [13,14].
Our previous study showed that vitamin D level in SLE patients was significantly low compared to that of healthy controls [8]. The low concentration of 25(OH)D serum was related to higher expression of CD11c+/CD86+/CD40+ in patients with SLE compared to that of SLE patients with normovitamin D and also healthy donor (21.08±16.38% and 9.73±12.41%). There was also an increase of IL-17 level in SLE patients. The increase of disease activity in SLE was associated with the increase of IL-17 level which was produced by CD4 T cells [5].
Our study reveals effects of 1,25(OH)2D3 in immune respon regulation of Systemic Lupus Erithematosus patients. It is important because eventhough Indonesia is located on the equator with sun exposure throughout the year, many patients of SLE in Indonesia suffered from hypovitamin D. SLE patients in Indonesia have more severe clinical manifestation [1]. The results of this study will encourage the importance of vitamin D for SLE patients with hypovitamin D.
Material and methods
Sample preparation
Monocytes and lymphocytes collected from five newly diagnosed female SLE patients (according to the American College of Rheumatology Criteria 1997), with range of age was 16-38 years old (mean=29.00±7.16), in active disease state with Mex-SLEDAI score >5, and hypovitamin D (25(OH)D serum level <30 ng/ml), range of 25(OH)D serum level was 16.5-29.8 ng/ml (mean=23.17±5.33 ng/ml). Subjects divided into 4 groups of 1,25(OH)2D3 doses, P0 (control/0 nM), P1 (1 nM), P2 (10 nM), P3 (100 nM). This study was approved by the Ethics Committee of Faculty Medicine of Brawijaya University Malang and informed consent has been obtained from all of SLE patients. Thirty mililiters of peripheral venous blood was collected and put in vacutainer with EDTA. Two mililiters of serum from Vacutainer was isolated and used to measure the concentration of 25(OH)D serum by ELISA in accordance with the manufacturer’s instructions (NovaTein Bio, USA).
Cell culture for monocytes and lymphocytes
Monocytes isolation procedure was in accordance with Xiao et al. [15] with time modification. Briefly, peripheral blood mononuclear cells (PBMC) were obtained from 20 ml of peripheral venous blood by Ficoll-Hypage density centrifugation, then isolated and suspended in 25 ml medium RPMI 1640 (Sigma-Aldrich, USA) containing 2 mM glutamin (Gybco, USA), 10 mM HEPES (Gybco, USA), Penicilin-streptomicin 10.000 U/ml (Gybco, USA), and 10% Fetal Bovine Serum (Gybco, USA), and incubated for 48 hours. 1x10⁻⁶ cells/well were plated in 96 wells using RPMI 1640 medium supplemented with 10% FBS in the presence of 800 U/ml GM-CSF (Biolegend) and 500 U/ml IL-4 (Biolegend) then incubated in 37°C, 5% CO2 for 6 days. The medium was replaced after 3 days. In day 7, TNF-α 100 U/ml (GenWay) and 1,25(OH)2D3 (CayMan, USA) in different doses were added in immature dendritic cells (iDC) culture. The cell culture was then incubated for 4 days in 37°C, 5% CO2.
Eight mililitres peripheral venous blood from subjects taken for CD4 T cell isolation. RosetteSep Human CD4+ T Cell Enrichment Cocktail at was added to the blood at concentration 50 μl/ml of whole blood, according to the manufacturer’s instruction. The naive T cells from CD4 T cell isolated were cultured in two TC 96 well plates (1st for Th17, 2nd for Treg) with anti-CD3 plate bound (5 μg/ml, Biolegend), aliquoted into 5x10⁵ cells/well with medium RPMI 1640 (Sigma-Aldrich, USA) containing L-Glutamine and 10% fetal bovine serum, supplemented with 100 μg/ml streptomycin, 100 U/ml penicillin (Gybco, USA), and 5 μg/ml antiCD28 (R&D). To encourage T naive toward Th17 and Treg, T cells were stimulated by 10 ng/ml IL-6 (Biolegend), 5 ng/ml TGF-β1 (Biolegend), 10 μg/mL anti-IFN-γ (R&D), and 10 μg/mL anti-IL-4 (R&D). In day two, 1,25(OH)2D3 was added with four different doses (0, 1, 10, 100 nM) then incubated for 72 hours at 37°C with 5% CO2.
Flowcytometry analysis
In day 10, dendritic cells were harvested. Cells were labeled with PerCP/Cy5.5 anti-human CD40 antibody, FITC anti-human CD86 antibody, PE anti-HLA-DR antibody (Biolegend, USA). Dendritic cell maturation was analyzed by flowcytometry (FACScalibur).
After 3 days, Th17 cells were stimulated with PMA (50 ng/ml; Sigma, St Louis, MO) and Ionomycin (1 μg/ml; Sigma) in the presence of Golgiplug (BD Pharmingen, San Diego, CA) for 4 hours. Cells were labelled with FITC anti-human CD4 (Biolegend). To detect IL-17A cytokines, intraceluller staining was performed with PerCp/Cy 5.5 anti-human IL-17A (Biolegend). For detection of Treg, cells were labelled with CD4-PerCP, CD25-PE and FOXP3-FITC, staining was performed according to Biolegend manufacture protocol.
Enzyme-linked immunoabsorbent assay (ELISA) for cytokines
Supernatans from DC and CD4 T cells were collected and stored at -80°C for cytokines measurements. IL-12 (Biolegend kit), IL-17A (R&D systems), and TGF-β (eBiosciences kit) secretion were measured by ELISA kits according to the manufacturer’s intructions.
Statistical analyses
Differences response of 1,25(OH)2D3 treatment between groups were determined by paired t-test. p<0.05 was considered significant. Data were described as mean±SD. Statistical analysis was performed using SPSS 19 version.
Results
Effect of 1,25(OH)2D3 treament on the dendritic cells maturation
The 1,25(OH)2D3 treatment in DC culture of SLE patients reduced the expression of CD40, CD86, and HLA-DR as seen in Figure 1. There was a significant difference in CD40 expression (Figure 2A) between P1 and P2 compared with P0 (36.87±5.60%; vs. 42.43±6.32%; p=0.006 and 31.66±6.43%; vs. 42.43±6.32%; p=0.009). However there was no significant difference in CD40 expression between P3 and P0 (38.78±9.17% vs. 42.43±6.32%; p=0.308). This indicated that 1 nM and 10 nM of 1,25(OH)2D3 were able to decrease the expression of CD40 in DC of SLE patients, whereas not in 100 nM of 1,25(OH)2D3. There was also significant difference in CD40 expression between P1 and P2 (36.87±5.60% vs. 31.66±6.43%; p=0.013). This showed that 10 nM of 1,25(OH)2D3 was more optimal than 1 nM of 1,25(OH)2D3 to decrease CD40 expression. There was no significant difference in CD40 expression between P1 and P3 (36.87±5.60% vs. 38.78±9.17%; p=0.570) and also no significant difference in CD40 expression between P2 and P3 (31.66±6.43% vs. 38.78±9.17%; p=0.305).
Figure 1.
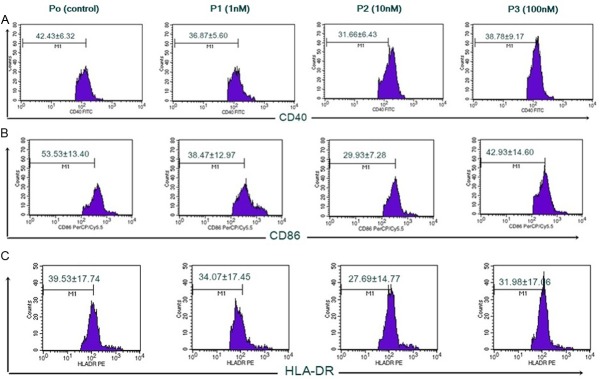
Expression of CD40, CD86, dan HLA-DR of DC inhibited by 1,25(OH)2D3. Immature DC taken from monocytes culture supplemented with GM-CSF dan IL-4 for 6 days. On day 7, 1x10⁻⁶ cells/well were added with 1,25(OH)2D3 with different doses: 0, 1, 10, 100 nM, then cultured in medium with TNF-α for 4 days. On day 10, cells were harvested and stained with monoclonalantibodies PerCp/Cy5.5 anti-human CD40, FITC anti-human CD86, dan PE anti-human HLA-DR prior to flow cytometry (FACScalibur) analysis. A. Expression of CD40 percentage with different doses of 1,25(OH)2D3. B. Expression of CD86 percentage with different doses of 1,25(OH)2D3. C. Expression of HLA-DR percentage with different doses of 1,25(OH)2D3.
Figure 2.
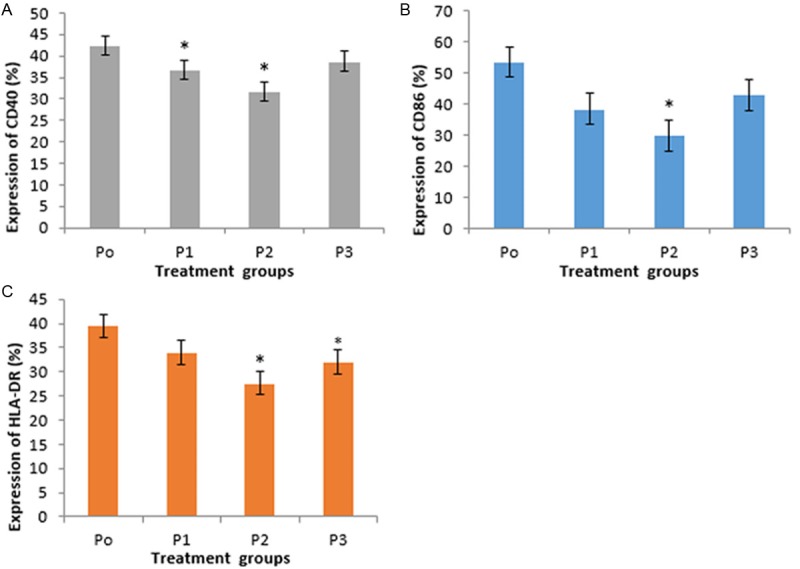
Expression of CD40, CD86, and HLA-DR in DC. There were reduced mean of CD40, CD86, and HLA-DR among P1, P2, dan P3 compared with P0. P2 was the lowest *Significant (p<0.05) compared to control. A. Treatment of 1,25(OH)2D3 1 nM and 10 nM showed significant difference in CD40 expression compared to control. B. Treatment of 1,25(OH)2D3 10 nM showed significant difference in CD86 expression compared to control. C. Treatment of 1,25(OH)2D3 10 nM dan 100 nM showed significant difference in HLA-DR expression compared to control.
Expression of CD86 (Figure 2B) showed a reduction in each group versus control, with P2 was the lowest. There was a significant difference in CD86 expression between P2 and P0 (29.93±7.28% vs. 53.53±13.40%; p=0.011). In contrast, there was no significant difference in CD86 expression between P1 and P3 compared with P0 (38.47±12.97% vs. 53.53±13.40%; p=0.088 and 42.93±14.60%; vs. 53.53±13.40%; p=0.130). This indicated that 10 nM of 1,25(OH)2D3 was able to decrease expression of CD86 SLE patients, whereas 1 nM and 100 nM of 1,25(OH)2D3 were not significantly able to decrease CD86 expression.
Expression of HLA-DR (Figure 2C) showed a reduction in each group versus control, with P2 was the lowest. There was no significant difference in HLA-DR expression between P1 and P0 (34.07±17.45% vs. 39.53±17.74%; p=0.439). In contrast, there was a significant difference in HLA-DR expression between P2 and P3 compared with P0 (27.69±14.77% vs. 39.53±17.74%; p=0.018 and 31.98±17.06% vs. 39.53±17.74%; p=0.038). This indicated that 10 nM and 100 nM of 1,25(OH)2D3 were able to decrease expression of HLA-DR SLE patients.
Effect of 1,25(OH)2D3 treatment on IL-12 production by DC
This study showed that 1,25(OH)2D3 treatment tend to reduce IL-12p70 production by DC in SLE patients. Treatment group P2 showed the lowest IL-12p70 level versus control (Figure 3). There was no significant difference in IL-12p70 level between P1 and P3 compared with P0 (44.10±25.10 vs. 57.10±16.90, p=0.302 and 48.5±15.9 vs. 57.10±16.90; p=0.419). In contrast, there was a significant difference in IL-12p70 level between P2 and P0 (28.9±6.8 vs. 57.10±16.90; p=0.018). This indicated that 10 nM of 1,25(OH)2D3 was able to decrease IL-12p70 level of SLE patients whereas 1 nM and 100 nM of 1,25(OH)2D3 were not significantly able to decrease IL-12p70 level.
Figure 3.
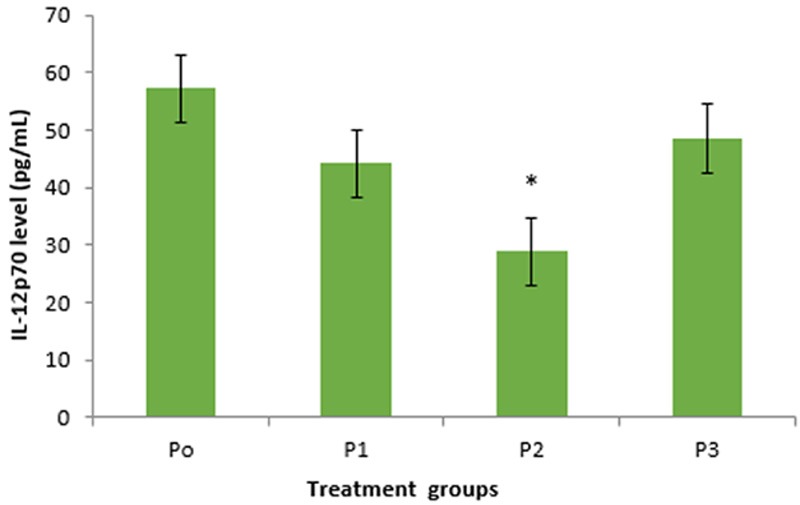
The difference of IL-12p70 secretion level in treatment groups of 1,25(OH)2D3 in DC. There were reduced level of IL-12p70 in groups P1, P2, and P3 compared with P0 (control). Group P2 (10 nM of 1,25(OH)2D3) showed significant difference compared to control.
Effect of 1,25(OH)2D3 treatment on the proportion of Th17 cells
This study showed that there was a reduction of the percentage of Th17 cells in CD4 T lymphocytes by 1,25(OH)2D3 treatments (Figure 4). Expression of the percentage of Th17 cells (Figure 5) showed a decrease in each group versus control in SLE patients. There was a significant difference in the percentage of Th17 cells between P1 and P2 compared with P0 (8.39±3.29% vs. 17.07±2.99%; p=0.043 and 7.17±3.81% vs. 17.07±2.99%; p=0.038). This indicated that 1 nM and 10 nM of 1,25(OH)2D3 were able to reduce the percentage of Th17 cells SLE patients.
Figure 4.
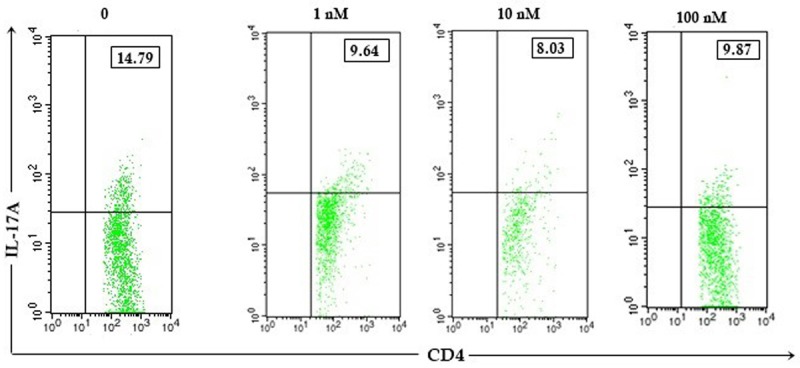
The 1,25(OH)2D3 increased Th17 CD4 T cells. Expression of Th17 percentage after 1,25(OH)2D3 treatment with different doses (0, 1, 10, 100 nM) in CD4 T cells of patients with SLE. Upper right quadrant showed percentage of Th17 cells.
Figure 5.
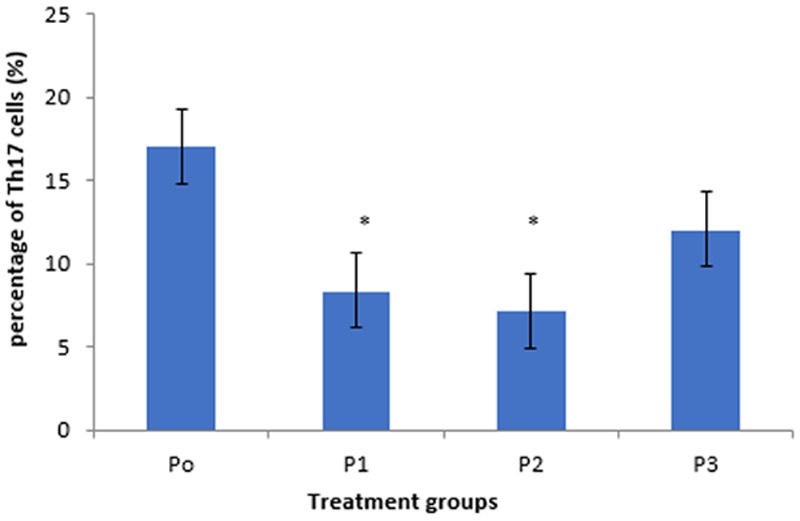
Expression of Th17 cells in CD4 T cells. There were reduced percentage of Th17 cells among groups P1, P2, and P3 compared with P0. P2 was the lowest. *Significant (p<0.05) compared to control.
In addition, even not significant, the percentage of TH17 cells in P3 tend to be lower than P0 (12.06±4.49% vs. 17.07±2.99%; p=0.153). There was no significant difference in the percentage of Th17 cells between P1 compared with P2 (p=0.738) and P3 (p=0.135); P2 compared with P3 (p=0.305). This indicated that 1 nM, 10 nM, and 100 nM of 1,25(OH)2D3 in CD4 T cell culture SLE patients have ability to reduce the percentage of Th17 cells. The percentage of Th17 cells in P2 was the lowest among others, thus 10 nM was more optimal than others.
Effect of 1,25(OH)2D3 treatment on the IL-17A production by Th17 cells
Level of IL-17A produced by Th17 cells (CD4+IL17A+) after 1,25(OH)2D3 treatment with different doses showed a decrease compared to control (Figure 6). There was a significant difference in level of IL-17A between P1 and P2 compared with P0 (25.90±11.90 vs. 59.18±26.95; p=0.024 and 15.75±1.22 vs. 59.18±26.95; p=0.047). This indicated that 1 nM and 10 nM of 1,25(OH)2D3 were able to inhibit secretion of IL-17A CD4 T cells patients with SLE. There was no significant difference between P1 and P2 (p=0.185). It indicated that 1 nM and 10 nM of 1,25(OH)2D3 have the same ability to decrease IL-17A level. Interleukin-17 level in P2 was lower than P1 (p=0.02) and P3 (p=0.014). This indicated that 10 nM of 1,25(OH)2D3 treatment was the most optimal dose to reduce IL-17A level CD4 T cells patient with SLE among others.
Figure 6.
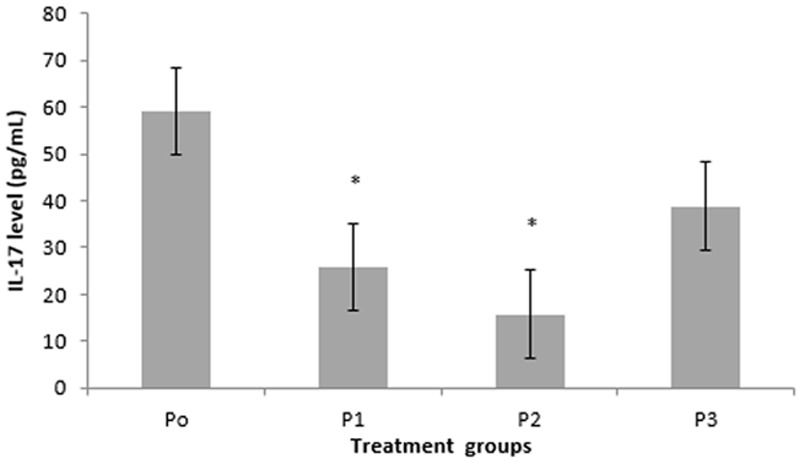
The difference of IL-17A secretion level in treatment groups of 1,25(OH)2D3 in CD4 T cells. There was a decrease in IL-17A level in groups of P1, P2, dan P3 compared with P0 (control). Group P2 was the lowest (p=0.047). *Significant (p<0.05) compared with control.
Effect of 1,25(OH)2D3 treatment on the proportion of Treg cells
This study showed that there was a difference in the percentage of Treg cells in CD4 T cells culture by 1,25(OH)2D3 treatment (Figure 7). Compared with control, Treg cells percentage in CD4 T lymphocytes culture showed an increase in P1, P2, and P3 (Figure 8). The percentage of Treg cells after treatment with different doses of 1,25(OH)2D3 (1, 10, 100 nM) tend to increase versus control, but there was no significant difference in the percentage of Treg cells among P1, P2, and P3 compared with P0 (14.74±9.20% vs. 13.76±8.51%; p=0.886, 8.32±4.13% vs. 13.76±8.51%; p=0.280, and 16.82±7.33% vs. 13.76±8.51%; p=0.536). This indicated that 1,25(OH)2D3 treatment had no response in Treg cells activation.
Figure 7.
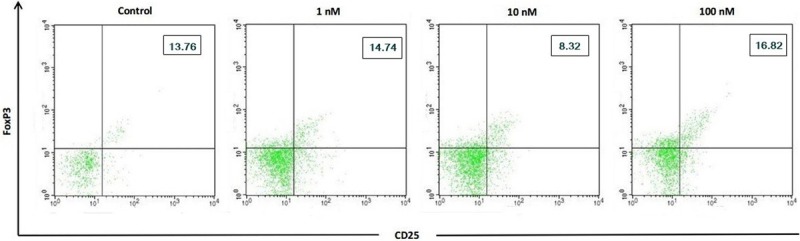
The 1,25(OH)2D3 inhibited Treg CD4 T cells. Expression of Treg percentage after 1,25(OH)2D3 treatment with different doses (0, 1, 10, 100 nM) in CD4 T cells of patients with SLE. Upper right quadrant showed percentage of Th17 cells.
Figure 8.

Expression of Treg cells in CD4 T cells. There was an increase percentage of Treg cells between group P1 and P3 compared with P0. There were no significancies compared to control.
Effect of 1,25(OH)2D3 treatment on the TGF-β production by Treg cells
This study showed differences mean of TGF-β levels in CD4 T cells culture after 1,25(OH)2D3 treatment compared with control (Figure 9). TGF-β levels in group P1 and P2 tend to be lower than control, whereas in group P3 was higher than control. There were no significant differences in TGF-β levels among P1, P2, and P3 compared with P0 (5810±2024 vs 6571±3359.22; p=0.607, 4192.6±544.39 vs 6571±3359.22; p=0.149, and 6376.80±3247.30 vs 6571±3359.22; p=0.730). It indicated that 1,25(OH)2D3 had no effect on Treg cells function.
Figure 9.
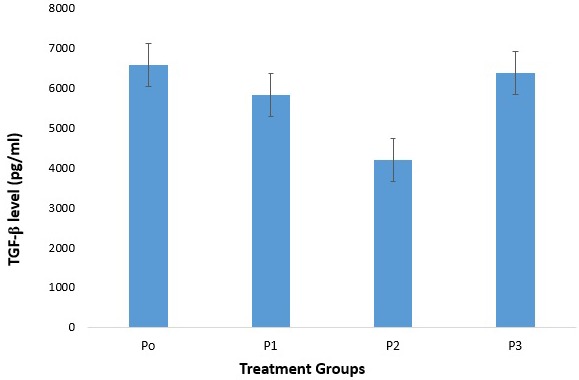
The difference of TGF-β secretion in treatment groups of 1,25(OH)2D3 in CD4 T cells. There was a difference in TGF-β level among groups of P1, P2, dan P3 compared with P0 (control). There were no significancies compared to control.
Discussions
It has been known that the increase of DC maturation was one of the dysregulation of immune system suffered in SLE patients and lead to the increase of Th1 and B cells activation [16]. This study indicated that 1,25(OH)2D3 treatment with different doses (1, 10, 100 nM) has ability to inhibit DC maturation in SLE patients. It can be shown that there were decreased expression of CD40, CD86, HLA-DR, and IL-12p70 level in mature DC of SLE patients compared with control. Study by Zvi et al., also showed that vitamin D supplementation inhibited maturation and activation dendritic cells and showed by the reduced of CD40, CD86, and HLA-DR in DC culture SLE patients [16]. CD40 and CD86 are co-stimulatory molecules, which are expressed in large amounts of mature dendritic cells. They play an important role as second signal in the process of Th cell activation. Similarly, HLA-DR is type II MHC molecule that acts as first signal; and secretion of IL-12p70 that has important role in the regulation of immune system which acts as third signal in Th activation [17]. This study showed that 1,25(OH)2D3 has effect to decrease expression of CD40, CD86, HLA-DR and production of IL-12p70 in DC SLE patients so that it has possibility to inhibit naive Th cells activation to help reduce SLE pathogenity.
This study showed that 1,25(OH)2D3 was able to reduce the percentage of Th17 and IL-17A levels in CD4 T cells SLE patients. Study by Tian et al. reported that vitamin D3 inhibited differentiation of Th1 and Th17 cells in Behcet disease in vitro. Vitamin D also inhibited the expression of Th17 cells effector molecules such as RORC, IL-17A, IL-23R, and CCR6 [18] and stimulated the secretion of regulatory IL-10 by naive CD4+ T cells. Co-cultured CD4 T cells with DC also showed suppression effect of vitamin D3 on IL-17A and IFN-γ levels in the supernatans cell culture. Colin et al. showed that 1,25(OH)2D3 decreased IL-17A and IFN-γ levels and also increased IL-4 level from PBMC patient with rheumatoid arthritis (RA) [19]. Other study [20] showed that 1,25(OH)2D3 inhibited human IL-17A CD4 T cells in healthy donor and IL-17A in murine model of multiple sclerosis.
Our study showed that percentage of Th17 was decreased by 1,25(OH)2D3 treatment in 1 nM and 10 nM. Chang et al. reported that 1,25(OH)2D3 treatment in mice ameliorated experimental autoimmune encephalomyelitis that accompanied with reduced of IL-17A expression. In vitro, treatment of CD4+ T cells with the phisiological dose of 1,25(OH)2D3 preferentially inhibited cytokines production by Th17 cells, in a VDR-dependent manner [21]. Interleukin-6 and TGF-β were important in development of Th17 by activating STAT3 and inducing trancription factors, RORγt and RORα [22,23].
This study showed there was an increase in the percentage of Treg cells in CD4 Tcells culture SLE patients after 1,25(OH)2D3 treatment but not significant. This condition supported by previous study that there was a significant increase of Treg after vitamin D supplementation in vivo [24-26]. Development of Th0 cells toward Treg cells needs other stimulations, not only TGF-β. There are other mechanisms in Treg activation and differentiation. Chen et al. found that TNF was able to increase Treg. Interaction between TNF-α and its receptor (TNFR) at Th0 will increase TGF-β [27,28], thus the amount and activity of Treg will increase, too.
The optimal vitamin D level in serum was >75 nM (>30 ng/ml) [29]. In this study, 1,25(OH)2D3 treatment with 100 nM did not show significant decrease in expression of CD40, CD86, HLA-DR, percentage of Th17 cell, and level of IL-12p70 and IL-17A, compared with control. This condition indicated that after 1,25(OH)2D3 reached the optimal dose, even if 1,25(OH)2D3 was given in higher dose, it wouldn’t give an optimal result; 1,25(OH)2D3 treatment skewed back in result as seen in control. Dose (1 nM) equals with 0.4 ng/ml [29], so 10-7 M (100 nM) equals with 40 ng/ml. If this dose (100 nM) is given to treat culture, it probably would give a toxic/opposite effect. Sudden ‘stressor’ in cell culture will make cell give another respond to maintain its homeostasis. Metabolite of 25(OH)D in human should change to 1,25(OH)2D3 to become active. The active metabolite, 1,25(OH)2D3 will bound to VDR, nuclear receptor that regulate trancription of vitamin D targets gen. Similarly in DC, 1,25(OH)2D3 with 10 nM was more potential to decrease percentage of Th17 cell and IL-17A level than other doses. Dose 100 nM of 1,25(OH)2D3 gave inverse effect by increasing percentage of Th17 cells and IL-17A level. However, dose 1 nM of 1,25(OH)2D3 has inhibition effect but this dose is included in physiology doses [30-32], so it is less potential.
In conclusion, it was found that 1,25(OH)2D3 especially dose of 10 nM, significantly inhibited dendritic cells maturation, as seen in the decrease of CD40, CD86, and HLA-DR expressions and cytokines secretions of IL-12p70, also in the decreased percentage of Th17 cells and IL-17A levels in CD4 T cells culture of SLE patients, but not Treg cells and TGF-β.
Acknowledgements
We thank all patients who participated in this study. We also thank Mrs. Bunga, Mr. Yudha and Mrs. Lilis for their technical asssistance as well as the chief of Biomedic Laboratory, Faculty of Medicine Brawijaya University, for giving us permission to work in the Laboratorium.
Disclosure of conflict of interest
None.
References
- 1.Handono K. HLA klas II dan kerentanan genetik terhadap LES di Indonesia. Acta Med Ind. 2000;32:11–15. [Google Scholar]
- 2.Howitz DA, Gray JD. The Interaction of T cells with cells of the Innate immune system and B cell in the pathogenesis of SLE. In: Wallace DJ, Han BH, editors. Dubois’ Lupus Erythematosus. Philadelphia: Lippincott Williams & Wilkins; 2007. pp. 133–160. [Google Scholar]
- 3.Perry D, Peck AB, Carcamo WC, Morel L, Nguyen CQ. The current concept of Th17 cells and their expanding role in sle. Arthritis. 2011;2011:810649. doi: 10.1155/2011/810649. doi: 10.1155/2011/810649. Epub 2011 Mar 22. [DOI] [PMC free article] [PubMed] [Google Scholar]
- 4.Miossec P, Korn T, Kuchroo V. Interleukin-17 and Type 17 Helper T Cells. N Engl J Med. 2009;361:888–98. doi: 10.1056/NEJMra0707449. [DOI] [PubMed] [Google Scholar]
- 5.Shah K, Lee WW, Lee SH, Kim SH, Kang SW, Craft J, Kang I. Dysregulated balance of Th17 and Th1 cells in systemic lupus erythematosus. Arthritis Res Ther. 2010;12:R53. doi: 10.1186/ar2964. [DOI] [PMC free article] [PubMed] [Google Scholar]
- 6.Alunno A, Bartoloni A, Bistoni O, Nocentini G, Ronchetti S, Caterbi S, Valentini V, Riccardi C, Gerli R. Balance between regulatory T and Th17 cells in systemic lupus erythematosus: The old and the new. Clin Dev Immunol. 2012;2012:823085. doi: 10.1155/2012/823085. [DOI] [PMC free article] [PubMed] [Google Scholar]
- 7.Singh A, Kamen DL. Potential benefits of vitamin D for patients with systemic lupus erythematosus. Dermatoendocrinol. 2012;4:146–51. doi: 10.4161/derm.20443. [DOI] [PMC free article] [PubMed] [Google Scholar]
- 8.Handono K, Daramatasia W, Pratiwi SS, Wahono CS, Kalim H. Low Level of Vitamin D Increased Dendritic Cell Maturation and Expression of Interferon-γ and Interleukin-4 in Systemic Lupus Erytematosus. IORSJPBS. 2012;2:37–43. [Google Scholar]
- 9.Ruiz-Irastorza G, Egurbide MV, Olivares N, Martinez-Berriotxoa A, Aguirre C. Vitamin D deficiency in systemic lupus erythematosus: prevalence, predictors and clinical consequences. Rheumatology. 2008;47:920–923. doi: 10.1093/rheumatology/ken121. [DOI] [PubMed] [Google Scholar]
- 10.Toubi E, Shoenfeld Y. The role of vitamin D in regulating immune responses. Isr Med Assoc J. 2010;12:174–175. [PubMed] [Google Scholar]
- 11.Handono K, Hasanah D, Kalim H, Mawarti H. The association among serum levels of vitamin D, TGf-β/IL-6 balance and Treg/Th17 balance in systemic lupus erythematosus patients in Indonesia. International Journal of Biochemistry and Biotechnology. 2013;2:490–496. [Google Scholar]
- 12.Von Boehmer H, Nolting J. What turns on Foxp3? Nat Immunol. 2008;9:121–122. doi: 10.1038/ni0208-121. [DOI] [PubMed] [Google Scholar]
- 13.Kimura A, Kishimoto T. IL-6: regulator for Treg/Th17 balance. Eur J Immunol. 2010;40:1830–1835. doi: 10.1002/eji.201040391. [DOI] [PubMed] [Google Scholar]
- 14.Kurts C. Th17 cells: a third subset of CD4+ T effector cells involved in organ-specific autoimmunity. Nephrol Dial Transplant. 2008;23:816–819. doi: 10.1093/ndt/gfm800. [DOI] [PubMed] [Google Scholar]
- 15.Xiao J, Vida H, Wang XL, Vandeberg JL, Shi Q. Profound influence of LDL oxidative status and monocyte co-cultures on baboon endothelial activation. Am J Cardiovasc Dis. 2012;2:1–11. [PMC free article] [PubMed] [Google Scholar]
- 16.Ben-Zvi I, Aranow C, Mackay M, Stanevsky A, Kamen DL, Marinescu LM, Collins CE, Gilkeson GS, Diamond B, Hardin JA. The impact of vitamin D on dendritic cell function in patients with systemic lupus erythematosus. PLoS One. 2010;5:e9193. doi: 10.1371/journal.pone.0009193. [DOI] [PMC free article] [PubMed] [Google Scholar]
- 17.Maddur MS, Vani J, Dimitrov JD, Balaji KN, Desmazes SL, Kaveri SV, Bayry J. Dendritic cells in autoimmune diseases. The Open Arthritis Journal. 2010;3:1–7. [Google Scholar]
- 18.Tian Y, Wang C, Ye Z, Xiao X, Kijlstra A, Yang P. Effect of 1,25-dihydroxyvitamin D3 on Th17 and Th1 response in patients with behcet’s disease. Invest Ophthalmol Vis Sci. 2012;53:6434–41. doi: 10.1167/iovs.12-10398. [DOI] [PubMed] [Google Scholar]
- 19.Colin EM, Asmawidjaja PS, van Hamburg JP, Mus AM, van Driel M, Hazes JM, van Leeuwen JP, Lubberts E. 1,25-dihydroxivitamin D3 modulayes Th17 polarization and Interleukin-22 expression by memory T cells from patients with early rheumatoid arthritis. Arthritis Rheum. 2010;62:132–142. doi: 10.1002/art.25043. [DOI] [PubMed] [Google Scholar]
- 20.Joshi S, Pantalena LC, Liu XK. Gaffen SL, Liu H, Rohowsky-Kochan C, Ichiyama K, Yoshimura A, Steinman L, Christakos S, Youssef S. 1,25-dihydroxyvitamin D3 ameliorates Th17 autoimmunity via transcriptional modulation of Interleukin-17A. Mol Cell Biol. 2011;31:3653–69. doi: 10.1128/MCB.05020-11. [DOI] [PMC free article] [PubMed] [Google Scholar]
- 21.Chang SH, Chung Y, Dong C. Vitamin D suppresses Th17 cytokine production by inducing C/EBP homologous protein (CHOP) expresssion. J Biol Chem. 2010;285:38751–38755. doi: 10.1074/jbc.C110.185777. [DOI] [PMC free article] [PubMed] [Google Scholar]
- 22.Waite JC, Skokos D. Th17 response and inflammatory autoimmune diseases. Int J Inflam. 2012;2012:819467. doi: 10.1155/2012/819467. [DOI] [PMC free article] [PubMed] [Google Scholar]
- 23.Dong C. Genetic controls of Th17 cell differentiation and plasticity. Exp Mol Med. 2010;43:1–6. doi: 10.3858/emm.2011.43.1.007. [DOI] [PMC free article] [PubMed] [Google Scholar]
- 24.Askenasy N, Kaminitz A, Yarkoni S. Mechanism of T regulatory Cell Function. Autoimmunity Reviews. 2008;7:370–375. doi: 10.1016/j.autrev.2008.03.001. [DOI] [PubMed] [Google Scholar]
- 25.Siegmund K, Feuerer M, Siewert C. Ghani S, Haubold U, Dankof A, Krenn V, Schön MP, Scheffold A, Lowe JB, Hamann A, Syrbe U, Huehn J. Migration Matters: Regulatory T-cell Compartmentalization Determines Suppresive Activity in vivo . Blood. 2005;106:3097–3104. doi: 10.1182/blood-2005-05-1864. [DOI] [PMC free article] [PubMed] [Google Scholar]
- 26.Weber SE, Harbertson J, Godebu E, Mros GA, Padrick RC, Carson BD, Ziegler SF, Bradley LM. Adaptive Islet-specific Regulatory CD4 T Cells Control Autoimmune Diabetes And Mediate The Disappearance of Pathogenic Th1 Cells in vivo. J Immunol. 2006;176:4730–4739. doi: 10.4049/jimmunol.176.8.4730. [DOI] [PubMed] [Google Scholar]
- 27.Chen X, Bäumel M, Männel DN, Howard OM, Oppenheim JJ. Interaction of TNF Receptor Type 2 Promotes Expansion and Funtion of Mouse CD4+CD25+ T Regulatory Cells. J Immunol. 2007;179:154–161. doi: 10.4049/jimmunol.179.1.154. [DOI] [PubMed] [Google Scholar]
- 28.Chen X, Subleski JJ, Kopf H, Howard OM, Männel DN. Cutting Edge: Expression of TNFR2 Defines a Maximally Suppressive Subset of Mouse CD4+CD25+FoxP3+ T Regulatory Cells: Applicability to Tumor-Infiltrating T Regulatory Cells. J Immunol. 2008;180:6467–6471. doi: 10.4049/jimmunol.180.10.6467. [DOI] [PMC free article] [PubMed] [Google Scholar]
- 29.Hewison M. An update on vitamin D and human immunity. Clin Endocrinol (Oxf) 2012;76:315–25. doi: 10.1111/j.1365-2265.2011.04261.x. [DOI] [PubMed] [Google Scholar]
- 30.Blumberg JM, Tzameli I, Astapova I, Lam FS, Flier JS, Hollenberg AN. Complex role of the vitamin D receptor and its ligand in adipogenesis in 3T3-L1 cells. J Biol Chem. 2006;281:11205–11213. doi: 10.1074/jbc.M510343200. [DOI] [PubMed] [Google Scholar]
- 31.Zhuang H, Lin Y, Yang G. Effects of 1,25-dihydroxyvitamin D3 on proliferation and differentiation of porcine preadipocyte in vitro. Chem Biol Interact. 2007;170:114–123. doi: 10.1016/j.cbi.2007.07.012. [DOI] [PubMed] [Google Scholar]
- 32.Garcia LA, King KK, Ferrini MG, Norris KC, Artaza JN. 1,25(OH)2vitamin D3 stimulates myogenic differentiation by inhibiting cell proliferation and modulating the expression of promyogenic growth factors and myostatin in C2C12 skeletal muscle cells. Endocrinology. 2011;152:2976–2986. doi: 10.1210/en.2011-0159. [DOI] [PMC free article] [PubMed] [Google Scholar]