

Abstract
Objectives
To examine contemporary survival patterns in the general population of patients diagnosed with chronic myeloid leukaemia (CML), and to identify patient groups with less than optimal outcomes.
Design
Prospective population-based cohort.
Setting
The UK's Haematological Malignancy Research Network (catchment population 3.6 million, with >2000 new haematological malignancies diagnosed annually).
Participants
All patients newly diagnosed with CML, from September 2004 to August 2011 and followed up to 31 March 2013.
Main outcome measure
Incidence and survival.
Results
With a median diagnostic age of 59 years, the CML age standardised (European) incidence was 0.9/100 000 (95% CIs 0.8 to 0.9), 5-year overall survival was 78.9% (72.3 to 84.0) and 5-year relative survival 88.6% (81.0 to 93.3). The efficacy of treatment across all ages was clearly demonstrated; the relative survival curves for those under 60 and over 60 years being closely aligned. Survival findings were similar for men and women, but varied with deprivation; the age and sex adjusted HR being 3.43 (1.89 to 6.22) for deprivation categories 4–5 (less affluent) versus 1–3 (more affluent). None of these differences were attributable to the biological features of the disease.
Conclusions
When therapy is freely provided, population-based survival for CML is similar to that reported in clinical trials, and age loses its prognostic significance. However, although most of the patients with CML now experience close to normal lifespans, those living in more deprived areas tend to have poorer outcomes, despite receiving the same clinical care. A significant improvement in overall population outcomes could be achieved if these socioeconomic differences, which may reflect the treatment compliance, could be eliminated.
Keywords: EPIDEMIOLOGY, Chronic myeloid leukaemia, Drug compliance, Socio-economic status
Strengths and limitations of this study.
Data are from a comprehensive population-based cohort that includes all patients diagnosed in a defined geographical area.
Complete follow-up is achieved via linkage to national healthcare systems.
The relative rarity of chronic myeloid leukaemia limited our ability to examine for smaller subgroup effects in the present series.
While our findings for socioeconomic status may reflect differences in treatment compliance, this association needs to be confirmed in future studies.
Introduction
Introduced at the turn of the century, orally administered tyrosine kinase inhibitors (TKIs) have transformed the treatment of chronic myeloid leukaemia (CML), changing it from a comparatively rare but fatal cancer in non-transplanted patients to a long-term condition with a steadily increasing prevalence. TKI therapy is, however, life-long and expensive; the price of first-generation imatinib currently varying from around £21 000 per patient per year in the UK to £57 000 in the USA, with the newer TKIs being even more costly. Such costs have major, but poorly defined, implications for health economies around the world.1
Given the potential for patients with CML to achieve a near normal lifespan, contemporary clinical discussion tends to revolve around how the growing range of TKIs should be used, response monitored and resistance managed.2–6 However, with reported survival rates from CML in some populations being poorer than that predicted from clinical trials, the extent to which findings from clinical trials can be extrapolated to the general patient population is also an issue of current debate.7–11 In this context, the contrast between the 5-year survival of 89% reported for imatinib-treated patients from the original clinical trial who were recruited in 2001 and followed until 200612 and the 2001–2009 relative survival of 56.0% in the USA's Surveillance, Epidemiology and End Results (SEER) populations13 14 seems particularly stark.
For CML, as with many other cancers, discrepancies between trial and population-based studies are commonly ascribed to systematic differences between the types of patients recruited into trials and those who are not; the former often tending to be comprised of younger patients with fewer comorbidities and less advanced disease.7 9 15 In addition, it is becoming ever more apparent that non-trial access to expensive drugs such as TKIs has a key role to play in countries without universal healthcare coverage.1 16–18 Furthermore, even in countries like the UK where care is freely provided on the basis of clinical need, non-adherence to the daily oral regimen is becoming an increasingly recognised problem for the long-term management of CML.2 9 19–22
Up-to-date population-based data on CML are limited; with much of the available information on CML survival in the general population predating the latest clinical trials, as well as the introduction of the latest monitoring/management guidelines.2–5 23 The population-based Haematological Malignancy Research Network; http://www.hmrn.org), which collects information to clinical trial standards on all new haematological malignancy diagnoses, was specifically established in 2004 to address issues such as this by providing ‘real-time’ data to inform clinical practice and research.24 The present report provides contemporary data on CML incidence and survival in the UK over the period 2004–2013, and investigates whether there are any patient groups with less than optimal outcomes.
Methods
Data are from the UK's population-based HMRN (http://www.hmrn.org). Full details of HMRN's structure, data collection methods and ethical approval have been described elsewhere.24 Briefly, within the HMRN region, patient care is provided by a unified clinical network operating across 14 hospitals organised within five multidisciplinary teams working to common guidelines covering investigation, treatment and follow-up (http://www.yorkshire-cancer-net.org.uk). All diagnoses and subsequent monitoring within the clinical network (>2000 patients a year) are made using the latest WHO classification25 at a single integrated haematopathology laboratory (http://www.hmds.info). All patients have full treatment, response and outcome data collected to clinical trial standards. HMRN operates with Section 251 support under the NHS Act 2006, enabling the Health and Social Care Information Centre (HSCIC) to provide us with nationwide information on deaths, subsequent cancer registrations and Hospital Episode Statistics (HES).
CML diagnosis was based on the demonstration of a BCR-ABL fusion transcript expressed by the Philadelphia (Ph) chromosome by RQ-PCR and/or the demonstration of t(9;22)(q34;q11) by conventional karyotyping or interphase FISH. The presence of additional karyotypic abnormalities was based on bone marrow metaphase analysis. As per standard practice, response to therapy was monitored using either molecular or cytogenetic tests or both; specifically, patients were monitored by quantitative PCR on peripheral blood, supplemented by bone marrow karyotyping when clinically indicated. ABL kinase mutational analysis was carried out when the transcript ratio increased over two sequential samples or on clinical demand.
Area-based population counts and measures of deprivation were sourced from UK national data.26 27 With respect to the latter and in common with other reports,27–29 the quintile distribution of the income domain of the index of deprivation (IMD; quintile one containing the most affluent fifth of England's lower super output areas and quintile five the least) is used as a marker of socioeconomic status.30 Overall survival and loss of molecular response (MR) were calculated using standard time to event analyses and the program strel (V.1.2.7) was used to estimate relative survival; age and sex-specific background mortality rates were obtained from national life tables.31 All analyses were conducted in the statistical package Stata V.12.
Results
Two-hundred and forty-two patients were diagnosed with CML in the study region over the 7-year period September 2004–August 2011, yielding a crude annual incidence rate of 0.97/100 000. The corresponding European and World age standardised incidence rates were 0.9 (95% CIs 0.8 to 0.9) and 0.7 (0.6 to 0.7)/100 000, respectively. As can be seen from table 1 (column 1), 132 (54.6%) patients were diagnosed before their 60th birthday and 110 (45.4%) after, the median diagnostic age being 59 years (range 15.1–94.7). As expected, around three of every five patients were men, and the area-based deprivation distribution of the cohort was broadly similar to that of the country as a whole (59.1% in quintiles 1–3 and 40.9% in quintiles 4–5).
Table 1.
Characteristics of 242 patients with chronic myeloid leukaemia diagnosed September 2004–August 2011, distributed by vital status on 1 April 2013
| Diagnosed September 2004–August 2011 | Status 1 April 2013 |
HRs (95% CI) |
|||
|---|---|---|---|---|---|
| Total (N=242) | Alive (N=195) | Dead (N=47) | Unadjusted | Adjusted* | |
| N (%) | N (%) | N (%) | |||
| Age at diagnosis, years | |||||
| <60 | 132 (54.6) | 116 (59.8) | 16 (34.0) | 1.00 | 1.00 |
| ≥60 | 110 (45.4) | 79 (40.2) | 31 (66.0) | 2.59 (1.39 to 4.83) | 2.65 (1.42 to 4.96) |
| Sex | |||||
| Male | 145 (60.0) | 115 (59.0) | 30 (63.8) | 1.00 | 1.00 |
| Female | 97 (40.0) | 80 (41.0) | 17 (36.2) | 0.84 (0.46 to 1.52) | 0.67 (0.37 to 1.23) |
| Deprivation quintile | |||||
| 1–3 | 143 (59.1) | 124 (63.9) | 19 (40.4) | 1.00 | 1.00 |
| 4–5 (less affluent) | 98 (40.9) | 70 (36.1) | 28 (59.6) | 2.60 (1.45 to 4.66) | 3.43 (1.89 to 6.22) |
| Phase at presentation | |||||
| Chronic | 235 (97.1) | 192 (81.7) | 43 (18.3) | 1.00 | 1.00 |
| Accelerated/blast crisis | 7 (2.9) | 3 (42.9) | 4 (57.1) | 7.46 (2.61 to 21.28) | 22.93 (7.24 to 72.61) |
| Baseline cytogenetics | |||||
| Ph+ve only | 209 (86.4) | 173 (82.8) | 36 (17.2) | 1.00 | 1.00 |
| Variant Ph+ve | 18 (7.4) | 15 (83.3) | 3 (16.7) | 0.89 (0.27 to 2.88) | 1.12 (0.34 to 3.68) |
| Additional abnormality | 12 (5.0) | 6 (50.0) | 6 (50.0) | 3.96 (1.66 to 9.42) | 4.94 (2.03 to12.00) |
| Amplified Ph+ve | 3 (1.2) | 1 (33.3) | 2 (66.7) | 6.82 (1.63 to 28.46) | 13.61 (3.09 to 60.00) |
*Adjusted for all other characteristic in the Table except the one of interest and cytogenetics.
Forty-seven (19.5%) patients died before 1 April 2013; minimum follow-up was 1.5 years and maximum follow-up was 8.5 years. The crude survival curve across the full 8.5-year period is shown in figure 1A, and the crude and relative survival curves over the first 6 years are compared in figure 1B (data for the remaining 2.5 years follow-up are not shown because the small number of events prohibited relative survival estimation). The 5-year survival was 78.9% (72.3% to 84.0%) and the relative survival, taking into account the background mortality in the general population, was 88.6% (81% to 93.3%). Two-hundred and thirty-four (96.7%) of the 242 patients were treated with TKIs within the study region: 219 (93.6%) received a first-line imatinib and the remainder received dasatinib as part of an ongoing trial. Only 8 (3.3%) of the 242 patients were not treated with TKIs within the HMRN region: two died before the treatment could be started, one refused treatment, one had a more serious competing comorbidity, two had supportive care only and two moved and were treated in another part of the country. Since all patients diagnosed within HMRN are ‘flagged’ in the national scheme, we can confirm that these latter two patients were alive on 1 April 2013.
Figure 1.
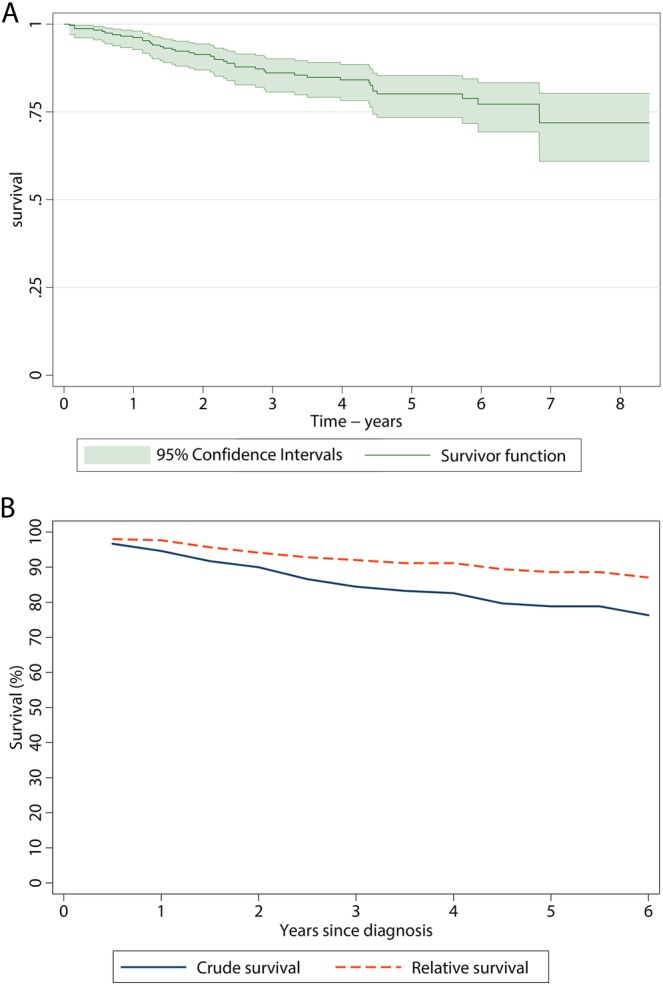
Crude (A) and relative (B) survival of the 242 patients diagnosed with CML in HMRN.
Patients with additional cytogenetic abnormalities at presentation had poorer outcomes than those who presented in chronic phase as Ph+ alone (table 1). With respect to patient characteristics, compared with those who survived, those who died tended to be older and live in less affluent areas (table 1): the adjusted HRs for those ≥ 60 years compared with those < 60 years was 2.65 (1.42 to 4.96), and for less affluent areas (quintiles 4–5) compared with more affluent areas (quintiles 1–3) was 3.43 (1.89 to 6.22). In addition, women were marginally more likely to survive than men, although this was not statistically significant.
While the age-specific crude survival curves continue to diverge with increasing time since diagnosis, the relative survival curves for the two age groups remain closely aligned: the 5-year relative survival for those < 60 years and over ≥ 60 years being 89.9% (80.8% to 94.8%) and 87.2% (69.8% to 94.9%), respectively. This clearly demonstrates the efficacy of TKI treatment across all ages (figure 2). Gender had a little impact on the outcome, and the overall and relative survival curves of men and women are similar, with the 5-year relative survival for men and women being 90.1% (79.9% to 95.4%) and 89.1% (71.9% to 96.1%), respectively. By contrast, the deprivation-specific relative survival curves remain as disparate from each other as the overall survival curves (p=0.0014), with the 5-year relative survival for the most affluent (categories 1–3) and the least affluent (categories 4–5) being 94.9% (82.3% to 98.6%) and 79.5% (64.1% to 88.8%), respectively. Furthermore, the results were similar even when deprivation-specific life tables were used to calculate relative survival.
Figure 2.

Crude (A, C, E) and relative survival (B, D, F) of the 234 patients diagnosed within HMRN 2004 to 2011 (deaths 2004 to 20 13) who were treated with tyrosine kinase inhibitors by age at diagnosis (A, B), Sex (C, D) and deprivation (E, F).
As can be seen from table 2, marginal deprivation differences were also evident for both molecular response achievement, defined here as one or more readings ≤ 0.1 BCR-ABL1 (major molecular response—MMR) or ≤ 1.0 BCR-ABL1 (molecular response—MR), and its retention. Overall, 71.4% of patients in deprivation categories 1–3 and 59.6% in 4–5 achieved MMR, the corresponding frequencies for MR being 82.1% and 71.3%, respectively. With respect to the time taken to achieve molecular response, the disparity between deprivation categories was evident from therapy outset, albeit non-statistically significantly so; the MMR cumulative frequencies were 16.4% and 21.2% (12 months), 32.9% and 36.2% (18 months) and 51.4% and 42.6% (24 months); the MR results were 45.7% and 38.3% (12 months), 66.4% and 54.6% (18 months) and 74.9% and 60.6% (24 months), respectively.
Table 2.
Acquisition and loss of molecular response; patients diagnosed September 2004–August 2011 and followed until 1st April 2013
| Achieved response/TKI treated (%) | Loss of response/achieved response (%) | Deaths/achieved response (%) | Loss of response plus deaths*/achieved response (%) | HR† (95% CI) for loss of response plus deaths | ||
|---|---|---|---|---|---|---|
| Unadjusted | Adjusted† | |||||
| Major molecular response (MMR=≤0.1%) | ||||||
| Deprivation quintile | ||||||
| 1–3 | 100/140 (71.4) | 28/100 (28.0) | 8/100 (8.0) | 35/100 (35.0) | 1.0 | 1.0 |
| 4–5 (less affluent) | 56/94 (59.6) | 20/56 (35.7) | 8/56 (14.3) | 27/56 (48.2) | 1.68 (1.03 to 2.78) | 1.71 (1.03 to 2.84) |
| (MR=≤1.0%) | ||||||
| Deprivation quintile | ||||||
| 1–3 | 115/140 (82.1) | 15/115 (13.0) | 8‡/115 (7.0) | 22/115 (19.1) | 1.0 | 1.0 |
| 4–5 (less affluent) | 67/94 (71.3) | 13/67 (19.4) | 9‡/67 (13.4) | 21/67 (31.3) | 1.78 (0.98 to 3.24) | 1.90 (1.03 to 3.49) |
*3 Deaths occurred in patients with a recorded loss of response.
†Adjusted for age and sex.
‡4/8 Deaths in deprivation categories 1–3 and 9/9 deaths in deprivation categories 4–5 were CML related (death certificates).
CML, chronic myeloid leukaemia; MMR, major molecular response; MR, molecular response; TKI, tyrosine kinase inhibitors.
The HRs for loss of response combined with deaths (table 2) are, as expected, consistent with findings for overall and relative survival (figure 2E,F); patients in deprivation categories 4–5 who achieved MMR were 1.71 (1.03 to 2.84) times more likely to lose their response or die, and the results were similar when the threshold was increased to include patients who achieved MR (1.90, 1.03 to 3.49). It is also worth noting that according to the information recorded at death certification, all nine deaths in deprivation categories 4–5 had CML cited as a contributing cause of death, compared with four of the eight in deprivation categories 1–3.
The deprivation differences presented here could not be explained by either variations in the acquisition of additional cytogenetic anomalies or TKI resistance, both of which were rare in this population: 7 (3.4%) of the 209 Ph+ patients with no additional abnormalities at diagnosis (table 1) acquired an additional anomaly during the follow-up, and all were in deprivation categories 1–3. With respect to the 10 (4.3%) patients who developed TKI resistance, 4/140 were in deprivation categories 1–3 and 6/94 in categories 4–5. None of the patients who acquired an additional cytogenetic anomaly developed TKI resistance.
Discussion
The outcome for patients with CML treated mainly with imatinib in our UK population-based patient cohort is similar to that reported for clinical trials12 32; the 5-year relative survival estimates for men and women diagnosed in 2004–2011 and treated with TKIs over the period 2004–2013 were 89.1% (79.9% to 95.4%) and 90.1% (71.9% to 96.1%), respectively. This suggests that the much poorer outcome recorded in the USA reflects financial barriers to accessing TKI therapy. Furthermore, our data confirm the inferences from clinical trials that TKI treatment is equally effective at all ages, eliminating the impact of age in traditional prognostic scores.33 34 Indeed, the prospects for most of the patients are excellent, raising questions about the continuing relevance of such scoring systems. However, despite free access to TKI therapy, clinical outcomes appear significantly poorer in lower socioeconomic groups in the UK; the age and sex-adjusted HR for deprivation categories 4–5 (less affluent) compared with the more affluent category was 3.43 (1.89 to 6.22). These differences were not attributable to differences in the biological features of the disease; hence the most plausible explanation is that this may reflect differential treatment compliance.2 3 20 21
The ability to conduct comprehensive population-based analyses of the type presented here is a major strength of the UK's NHS. Predicated on these structures, our population-based patient cohort (http://www.hmrn.org) was initiated to serve the research and clinical needs, and as such the capture and follow-up of all patients diagnosed in our study area is a paramount objective.27 A unique feature is that all diagnoses and subsequent monitoring of patients within the unified clinical network that spans the area is carried out by a single haematopathology laboratory. In addition, the sociodemographic structure of our catchment population of approximately 3.6 million (around 6% of the UK's estimated total) is broadly representative of the national population in terms of age, sex and deprivation; and increasingly our data are being extrapolated to the country as a whole.27 35–37
Given the life-long nature of TKI therapy, inequality of access because of cost1 is likely to be the main explanation for the marked disparity between CML survival in SEER registries and the results reported here and elsewhere in Europe.38–41 In addition to financial constraints, closer inspection of the data suggests that other factors including diagnostic accuracy and coding misclassification could also be contributing to the differences observed; since with a median diagnostic age of 65 years, incidence across SEER registries is consistently higher than elsewhere in the world, averaging around 1.8/100 000 and varying from about 1.4/100 000 in Hawaii to 2.1/100 000 in Detroit.14 By contrast, our age-standardised annual rate of 0.9/100 000 and median diagnostic of 59 years age are close to national and other European population-based estimates.38–41 The accurate diagnosis of CML and its separation from other myeloproliferative disorders require access to molecular diagnostic and cytogenetic analyses. Hence, while it is possible that the SEER variations are genuine, it is also possible that other haematological malignancies which are part of the differential diagnosis of CML, such as chronic myelomonocytic leukaemia (CMML), atypical CML and possibly myelodysplastic/myeloproliferative overlap syndromes, all of which have higher diagnostic ages and poorer survival, are being inadvertently included in the SEER CML dataset.27 39
Our observations confirm that when TKI treatment is freely provided, survival for patients with CML approaches that of unaffected individuals. Nevertheless, the requirement for daily oral therapy for this otherwise fatal disease has major, but poorly defined implications for health economies around the world.1 In England and Wales, the National Institute for Health and Care Excellence (NICE) assess the clinical and cost-effectiveness of new treatments prior to recommending their use across the NHS. In the original submission to NICE, imatinib costs were estimated at approximately £16–£20 million for the first 5 years of its introduction, but estimates beyond this time were not made due to lack of certainty about therapy uptake, long-term survival and consequent disease prevalence.42 In the meantime, even more expensive second-generation TKIs for CML, as well as new oral agents for more common haematological malignancies, are increasingly being adopted into clinical practice.43–45 Obviously, ensuring optimum clinical outcome for the level of resources invested is a critical issue for clinicians and policymakers; and our findings suggest that more significant improvements in overall population outcomes could, perhaps, be achieved if socioeconomic differences, which may reflect variations in drug compliance, could be eliminated.
While it is recognised that non-adherence to daily oral therapy can be a problem for long-term CML management even in populations with universal healthcare coverage,19–22 it has yet to be demonstrated that this is the reason for the socioeconomic differences described here. To investigate this further, additional longitudinal studies that incorporate the collection of appropriate monitoring data, as well as information on other life-style factors that could potentially contribute to the outcome, will need to be carried out. Clearly, however, identification of the mechanisms underpinning the socioeconomic survival differences within our population, and consequent design of appropriate interventions, could further improve survival. In this regard, recently developed serum imatinib assays46 could, perhaps, be incorporated into future studies designed to investigate the reasons why some patients may not be taking their medication regularly.
Supplementary Material
Footnotes
Contributors: ER, AGS, DAH, RP and AJ were responsible for the conception and design of the study. AGS and DP managed and analysed the data. GS, RP, AJ and PE assisted in the acquisition of data and provided clinical advice regarding the analysis and interpretation of the data. All the authors contributed to the final draft of the paper and had full access to all the data in the study and can take responsibility for the integrity of the data and the accuracy of the data analysis. ER and AGS are study guarantors.
Funding: We are grateful to Leukaemia and Lymphoma Research (LLR), who fund the Haematological Malignancy Research Network.
Competing interests: None.
Ethics approval: The Haematological Malignancy Research Network has ethical approval (REC 04/01205/69) from Leeds West Research Ethics Committee, R&D approval from each NHS Trust and exemption from Section 251 (formally Section 60) of the Health & Social Care Act (2001) (PIAG 1-05(h)/2007).
Provenance and peer review: Not commissioned; externally peer reviewed.
Data sharing statement: No additional data are available.
References
- 1.Experts in Chronic Myeloid Leukemia The price of drugs for chronic myeloid leukemia (CML) is a reflection of the unsustainable prices of cancer drugs: from the perspective of a large group of CML experts. Blood 2013;121:4439–42 [DOI] [PMC free article] [PubMed] [Google Scholar]
- 2.Branford S. Monitoring after successful therapy for chronic myeloid leukemia. Hematology Am Soc Hematol Educ Program 2012;2012:105–10 [DOI] [PubMed] [Google Scholar]
- 3.Cortes J, Goldman JM, Hughes T. Current issues in chronic myeloid leukemia: monitoring, resistance, and functional cure. J Natl Compr Cancer Netw 2012;10(Suppl 3):S1–13 [DOI] [PubMed] [Google Scholar]
- 4.Jabbour E, Kantarjian H. Chronic myeloid leukemia: 2012 update on diagnosis, monitoring, and management. Am J Hematol 2012;87:1037–45 [DOI] [PubMed] [Google Scholar]
- 5.Marin D. Management of the new patient with CML in chronic phase. Curr Hematol Malig Rep 2013;8:37–42 [DOI] [PubMed] [Google Scholar]
- 6.Carella AM, Branford S, Deininger M, et al. What challenges remain in chronic myeloid leukemia research? Haematologica 2013;98:1168–72 [DOI] [PMC free article] [PubMed] [Google Scholar]
- 7.Zackova D, Klamova H, Dusek L, et al. Imatinib as the first-line treatment of patients with chronic myeloid leukemia diagnosed in the chronic phase: can we compare real life data to the results from clinical trials? Am J Hematol 2011;86:318–21 [DOI] [PubMed] [Google Scholar]
- 8.Rohrbacher M, Berger U, Hochhaus A, et al. Clinical trials underestimate the age of chronic myeloid leukemia (CML) patients. Incidence and median age of Ph/BCR-ABL-positive CML and other chronic myeloproliferative disorders in a representative area in Germany. Leukemia 2009;23:602–4 [DOI] [PubMed] [Google Scholar]
- 9.Pulte D, Gondos A, Redaniel MT, et al. Survival of patients with chronic myelocytic leukemia: comparisons of estimates from clinical trial settings and population-based cancer registries. Oncologist 2011;16:663–71 [DOI] [PMC free article] [PubMed] [Google Scholar]
- 10.Lucas CM, Wang L, Austin GM, et al. A population study of imatinib in chronic myeloid leukaemia demonstrates lower efficacy than in clinical trials. Leukemia 2008;22:1963–6 [DOI] [PubMed] [Google Scholar]
- 11.Pulte D, Barnes B, Jansen L, et al. Population level survival of patients with chronic myelocytic leukemia in Germany compared to the US in the early 21st century. J Hematol Oncol 2013;6:70 http://www.jhoonline.org/content/6/1/70 (accessed 16 Oct 2013) [DOI] [PMC free article] [PubMed] [Google Scholar]
- 12.Druker BJ, Guilhot F, O'Brien SG, et al. Five-year follow-up of patients receiving imatinib for chronic myeloid leukemia. N Engl J Med 2006;355:2408–17 [DOI] [PubMed] [Google Scholar]
- 13.Howlader N, Noone AM, Krapcho M, et al. SEER Cancer Statistics Review, 1975–2010, National Cancer Institute. Bethesda. http//seer.cancer.gov/csr/1975_2010/, based Novemb 2012 SEER data submission, posted to SEER web site, April 2013 2013
- 14.Chen Y, Wang H, Kantarjian H, et al. Trends in chronic myeloid leukemia incidence and survival in the United States from 1975 to 2009. Leuk Lymphoma 2013;54:1411–17 [DOI] [PMC free article] [PubMed] [Google Scholar]
- 15.Elting LS, Cooksley C, Bekele BN, et al. Generalizability of cancer clinical trial results: prognostic differences between participants and nonparticipants. Cancer 2006;106:2452–8 [DOI] [PubMed] [Google Scholar]
- 16.Niu X, Roche LM, Pawlish KS, et al. Cancer survival disparities by health insurance status. Cancer Med 2013;2:403–11 [DOI] [PMC free article] [PubMed] [Google Scholar]
- 17.Smith JK, Ng SC, Zhou Z, et al. Does increasing insurance improve outcomes for US cancer patients? J Surg Res 2013;185:15–20 [DOI] [PubMed] [Google Scholar]
- 18.Au WY, Caguioa PB, Chuah C, et al. Chronic myeloid leukemia in Asia. Int J Hematol 2009;89:14–23 [DOI] [PubMed] [Google Scholar]
- 19.Accordino MK, Hershman DL. Disparities and challenges in adherence to oral antineoplastic agents. Am Soc Clin Oncol Educ Book 2013;2013:271–6 [DOI] [PubMed] [Google Scholar]
- 20.Ganesan P, Sagar TG, Dubashi B, et al. Nonadherence to imatinib adversely affects event free survival in chronic phase chronic myeloid leukemia. Am J Hematol 2011;86:471–4 [DOI] [PubMed] [Google Scholar]
- 21.Marin D, Bazeos A, Mahon F-X, et al. Adherence is the critical factor for achieving molecular responses in patients with chronic myeloid leukemia who achieve complete cytogenetic responses on imatinib. J Clin Oncol 2010;28:2381–8 [DOI] [PMC free article] [PubMed] [Google Scholar]
- 22.Noens L, van Lierde M-A, De Bock R, et al. Prevalence, determinants, and outcomes of nonadherence to imatinib therapy in patients with chronic myeloid leukemia: the ADAGIO study. Blood 2009;113:5401–11 [DOI] [PubMed] [Google Scholar]
- 23.Jain P, Kantarjian H, Cortes J. Chronic myeloid leukemia: overview of new agents and comparative analysis. Curr Treat Options Oncol 2013;14:127–43 [DOI] [PubMed] [Google Scholar]
- 24.Smith A, Roman E, Howell D, et al. The Haematological Malignancy Research Network (HMRN): a new information strategy for population based epidemiology and health service research. Br J Haematol 2010;148:739–53 [DOI] [PMC free article] [PubMed] [Google Scholar]
- 25.Swerdlow SH, Campo E, Harris NL, et al. WHO classification of tumours of haematopoietic and lymphoid tissues. 4th ed International Agency for Research on Cancer, 2008 [Google Scholar]
- 26.Office for National Statistics, 2001 Census: Aggregate data (England and Wales) [computer file]. UK Data Service Census Support. Downloaded from: http://casweb.mimas.ac.uk
- 27.Smith A, Howell D, Patmore R, et al. Incidence of haematological malignancy by sub-type: a report from the Haematological Malignancy Research Network. Br J Cancer 2011;105:1684–92 [DOI] [PMC free article] [PubMed] [Google Scholar]
- 28.Shack L, Jordan C, Thomson CS, et al. Variation in incidence of breast, lung and cervical cancer and malignant melanoma of skin by socioeconomic group in England. BMC Cancer 2008;8:271. [DOI] [PMC free article] [PubMed] [Google Scholar]
- 29.Department of Health. Reducing cancer inequality: evidence, progress and making it happen: a report by the National Cancer Equality Initiative, 2010. www.dh.gov.uk/en/Publicationsandstatistics/Publications/PublicationsPolicyAndGuidance/DH_114353
- 30.Government D for C and L. English indices of deprivation 2010—Publications—GOV.UK. 2011. https://www.gov.uk/government/publications/english-indices-of-deprivation-2010
- 31.Cancer Research UK Cancer Survival Group strel computer program and life tables for cancer survival analysis. 2006. http://www.lshtm.ac.uk/ncde/cancersurvival/tools.htm
- 32.Hochhaus A, O'Brien SG, Guilhot F, et al. Six-year follow-up of patients receiving imatinib for the first-line treatment of chronic myeloid leukemia. Leukemia 2009;23:1054–61 [DOI] [PubMed] [Google Scholar]
- 33.Gugliotta G, Castagnetti F, Palandri F, et al. Frontline imatinib treatment of chronic myeloid leukemia: no impact of age on outcome, a survey by the GIMEMA CML Working Party. Blood 2011;117:5591–9 [DOI] [PubMed] [Google Scholar]
- 34.Rousselot P, Cony-Makhoul P, Nicolini F, et al. Long-term safety and efficacy of imatinib mesylate (Gleevec®) in elderly patients with chronic phase chronic myelogenous leukemia: results of the AFR04 study. Am J Hematol 2013;88:1–4 [DOI] [PubMed] [Google Scholar]
- 35.UK CR Non-Hodgkin lymphoma diagnosis and treatment statistics. Cancer Research UK; http://www.cancerresearchuk.org/cancer-info/cancerstats/types/nhl/treatment/diagnosis-and-treatment (accessed 26 Sep 2013) [Google Scholar]
- 36.Hoyle M, Rogers G, Moxham T, et al. Cost-effectiveness of dasatinib and nilotinib for imatinib-resistant or -intolerant chronic phase chronic myeloid leukemia. Value Heal 2011;14:1057–67 http://www.sciencedirect.com/science/article/pii/S109830151101549X (accessed 26 Sep 2013) [DOI] [PubMed] [Google Scholar]
- 37.Natonal Institute for Health and Clinical Excellence Myelofibrosis (splenomegaly, symptoms)—ruxolitinib: appraisal consultation document. NICE 2013. http://guidance.nice.org.uk/TA/Wave0/615/Consultation/DraftGuidance (accessed 26 Sep 2013) [Google Scholar]
- 38.Höglund M, Sandin F, Hellström K, et al. Tyrosine kinase inhibitor usage, treatment outcome, and prognostic scores in CML: report from the population-based Swedish CML registry. Blood 2013;122:1284–92 [DOI] [PMC free article] [PubMed] [Google Scholar]
- 39.Rohrbacher M, Hasford J. Epidemiology of chronic myeloid leukaemia (CML). Best Pract Res Clin Haematol 2009;22: 295–302 [DOI] [PubMed] [Google Scholar]
- 40.Visser O, Trama A, Maynadié M, et al. Incidence, survival and prevalence of myeloid malignancies in Europe. Eur J Cancer 2012;48:3257–66 [DOI] [PubMed] [Google Scholar]
- 41.Oliver S, Taylor F, Bolton E, et al. Haematological maligancies in England 2001–2008. 2012. http://www.ncin.org.uk/cancer_type_and_topic_specific_work/cancer_type_specific_work/haematological_cancers/
- 42.Natonal Institute for Health and Clinical Excellence Leukaemia (chronic myeloid)—imatinib. 2003. http://guidance.nice.org.uk/TA70 (accessed 3 Oct 2013) [Google Scholar]
- 43.Natonal Institute for Health and Clinical Excellence Leukaemia (chronic myeloid, first line)—dasatinib, nilotinib and standard-dose imatinib. 2012. http://guidance.nice.org.uk/TA251 (accessed 3 Oct 2013) [DOI] [PubMed] [Google Scholar]
- 44.Natonal Institute for Health and Clinical Excellence Leukaemia (chronic myeloid)—dasatinib, nilotinib, imatinib (intolerant, resistant). 2012. http://guidance.nice.org.uk/TA241 (accessed 3 Oct 2013)
- 45.Wiestner A. Emerging role of kinase-targeted strategies in chronic lymphocytic leukemia. Blood 2012;120:4684–91 http://bloodjournal.hematologylibrary.org/content/120/24/4684.short (accessed 2 Oct 2013) [DOI] [PMC free article] [PubMed] [Google Scholar]
- 46.Rezende VM, Rivellis A, Novaes MMY, et al. Quantification of imatinib in human serum: validation of a high-performance liquid chromatography-mass spectrometry method for therapeutic drug monitoring and pharmacokinetic assays. Drug Des Devel Ther 2013;7:699–710 [DOI] [PMC free article] [PubMed] [Google Scholar]
Associated Data
This section collects any data citations, data availability statements, or supplementary materials included in this article.