

Abstract
Metabolic and oxidative stresses induce physiological adaptation processes, disrupting a finely tuned, coordinated network of gene expression. To better understand the interplay between the mRNA and miRNA transcriptomes, we examined how two distinct metabolic stressors alter the expression profile of human dermal fibroblasts.
Primary fibroblast cultures were obtained from skin biopsies of 17 healthy subjects. Metabolic stress was evoked by growing subcultured cells in glucose deprived, galactose enriched (GAL) or lipid reduced, cholesterol deficient (RL) media, and compared to parallel-cultured fibroblasts grown in standard (STD) medium. This was followed by mRNA expression profiling and assessment of > 1,000 miRNAs levels across all three conditions. The miRNA expression levels were subsequently correlated to the mRNA expression profile.
Metabolic stress by RL and GAL both produced significant, strongly correlated mRNA/miRNA changes. At the single gene level four miRNAs (miR-129-3p, miR-146b-5p, miR-543 and miR-550a) showed significant and comparable expression changes in both experimental conditions. These miRNAs appeared to have a significant physiological effect on the transcriptome, as nearly 10% of the predicted targets reported changes at mRNA level. The two distinct metabolic stressors induced comparable changes in the miRNome profile, suggesting a common defensive response of the fibroblasts to altered homeostasis. The differentially expressed miR-129-3p, miR-146b-5p, miR-543 and miR-550a regulated multiple genes (e.g. NGEF, NOVA1, PDE5A) with region- and age-specific transcription in the human brain, suggesting that deregulation of these miRNAs might have significant consequences on CNS function. The overall findings suggest that analysis of stress-induced responses of peripheral fibroblasts, obtained from patients with psychiatric disorders is a promising avenue for future research endeavors.
Keywords: human fibroblast, stress, miRNA, mRNA, profiling, lipid, galactose, qPCR
INTRODUCTION
Postmortem brain studies of psychiatric disorders show complex transcriptome profile changes that encompass both miRNA and mRNA disturbances [1,2]. Yet, these studies face considerable confounds, limiting mechanistic and molecular investigation into the causality of the observed changes. The uniquely human occurrence of major psychiatric disorders and the absence of bona fide animal models [3,4,5] underscore the need for analyzing human tissue. However, the usefulness of post-mortem brain tissue is limited primarily to static measures, such as gene expression analysis. Patient fibroblasts, due to their abundance, availability, and neuron-like receptor and protein expression are appealing alternative in vitro models for functional analysis of brain disorders [6,7].
Stress is a strong modulator of gene expression [8]. In vitro, glucose-depleted, galactose-supplemented medium is a widely used metabolic stress treatment in fibroblast cultures [9]: glucose depletion increases the level of reactive-oxygen species (ROS), which results in elevated, compensatory glutathione production [7]. Yet, over a prolonged time starvation results in reduction of NADPH, limiting the efficacy of the glutathione protection to the cells. In contrast, reduction in the exogenous cholesterol is a different kind, but related metabolic stress: to maintain their membrane structure and survive, fibroblasts are forced to synthesize their own cholesterol, stressing their metabolic machinery [10]. These two metabolic stress models are likely to share common characteristics: there is an increased rate of glucose incorporation into lipid when cells are switched into lipid-deficient medium [11] and C14 galactose incorporates into galactolipids [12]. Therefore, both would be expected to manifest common disturbances in the gene expression machinery.
Micro-RNAs (miRNA) are 18-22 nucleotide long fine-tuning regulators of gene expression and protein production [13]. Thousands of miRNAs are encoded in the human genome, controlling the function of approximately 50% of our genes. miRNA expression is tissue, environment and individual specific [14]. A single miRNA can regulate the expression of hundreds of mRNAs, cause their degradation, destabilization, stocking or transport.
The present study was aimed to answer three questions. First, do the different metabolic stressors alter the miRNA expression profile of human fibroblasts? Second, are the miRNA expression profiles similar between two different metabolic stressors? Finally, do the miRNA expression changes result in changes at the mRNA level? Importantly, these studies provide critical baseline data for similar experiments that will be performed on fibroblasts from patients with schizophrenia, major depression and bipolar disorder.
MATERIALS AND METHODS
ETHICS STATEMENT
The Vanderbilt University Institutional Review Board (IRB) approved the study and written informed consent was obtained from all study participants before any procedures were conducted.
HUMAN FIBROBLAST CELL CULTURES
Specimens for fibroblast cultures were obtained by skin biopsies (~ 1 × 2 mm) from 17 healthy subjects (4 males and 13 females) (Supplemental Material 1) as described previously [15]. Exclusion criteria included any DSM-IV diagnosis [16] or any medical condition that would preclude the biopsy.
All fibroblast samples used in this experiment were cultured between passages 5 and 10 using Dulbecco’s modified Eagle’s medium™ (DMEM; Mediatech, Manassas, VA, USA) containing 25mM glucose, 1 mM sodium pyruvate supplemented with 2 mM L-glutamine (Mediatech), 10% fetal bovine serum (FBS; Thermo Scientific HyClone, Logan, UT, USA) and antibiotic/antimycotic solution (A/A; Invitrogen) at 37 °C and 5% CO2. The cells were cultured simultaneously under same conditions until reaching confluence, trypsinized and counted.
A single cell line from each individual was divided into three plates (plating density 1.2×10⁶ cells/plate) and after overnight adherence, the medium was changed into 3 different conditions. All cultures were grown for 7 days, with a media change every 2 days. (Figure 1) and were grown in: 1) lipid reduced (RL) medium (DMEM supplemented with lipid reduced FBS (Thermo Scientific HyClone, Logan, UT, USA)); 2) galactose-containing (GAL) medium (DMEM deprived of glucose (Mediatech) supplemented with 10mM galactose) and 3) standard, glucose-containing (STD) medium. The medium was changed three times a week. Cell growth and proliferation were not affected by GAL or RL treatment. After one week the cells were washed with ice-cold PBS twice, trypsinized, pelleted (700g for 8 min on 18 °C) and stored on −80 °C until the RNA isolation.
Figure 1. Experimental design.

Flowchart representing the sample collection and grouping, the experiments and analyses performed. In summary, skin biopsies were collected from 17 male and female individuals, and used to establish in vitro fibroblast cultures. Each fibroblast culture was then cultured in standard (STD), galactose containing (GAL) or reduced lipid (RL) media. DNA microarrays were used to detect the mRNA profile of each individual sample in each culture condition. 4-5 samples of similar age and gender were grouped before performing miRNA expression profiling with miRNome qPCR arrays. Grouping-sample effects were examined in individual samples with custom qPCR arrays containing selected miRNA assays. Finally, we preformed correlation analyses between the commonly changed miRNAs and their putative mRNA targets.
RNA ISOLATION
Total cell RNA and small RNA fractions were isolated from the frozen samples using the mirVana miRNA isolation Kit (Ambion, Austin, TX) according to manufacturer’s instructions. In brief, the pellet was suspended in 600 μl Lysis/Binding Solution, than 60 μl Homogenate Additive was added. After 10 min incubation time for total RNA isolation 1.25× volume of 100% ethanol was added to the aqueous phase and the supernatant was purified using the proprietary solutions provided by the manufacturer. Finally the total RNA was collected with 100 μl Elution Solution. For small RNA isolation we added on-thrid volume of 100% ethanol to the aqueous phase and two-thrid volume of 100% ethanol to the flow-through. The small RNA specied were collected from the filter with 100 μl Elution Solution. Agilent 2100 Bioanalyzer was used to determine the quality and size distribution of the total RNA and small RNA fractions. All samples showed a RNA Intergity Number (RIN) >8.0. The samples were stored on −80 °C until used.
DNA MICROARRAY and miRNome PCR ARRAY
mRNA expression
mRNA levels were examined with the GeneChip HT HG-U133+ PM Array Plate (Affymetrix, Santa Clara, CA, USA). cDNA synthesis from total RNA, IVT, labeling and hybridization were performed according to manufacturer’s protocol.
miRNA expression
From small RNA samples cDNA was prepared with miScript II RT Kit (Qiagen, Valencia, CA, USA) using miScript HiSpec Buffer. The DNA was quantified with NanoDrop ND-1000 spectophotometer, yielding 693-839 ng/μl. After reverse transcription, the individual sample cDNAs were pooled into four groups based the gender and the age. Each group contained material from 4-5 individuals. Group 1: males age of 30-48; group 2: females age of 20-25; group 3: females age of 27-40; group 4: females age of 44-52 (Supplemental Material 1). The relative amounts of 1008 miRNAs were measured with miRNome miRNA PCR Arrays using miScript SYBR Green PCR Kit (Qiagen, Valencia, CA, USA) according to the manufacturer’s instructions.
VALIDATION OF mRNA FINDINGS
Based on our pathway analyses we selected a panel of 10 lipid biosynthesis genes, and validated the mRNAs using qPCR on the individual control, GAL-treated and RL-exposed samples (n=18). Total RNA (500 ng) from each sample was reverse transcribed to cDNA using RT2 First Strand Kit (Qiagen) using the instructions of the manufacturer. Custom-designed RT2 Profiler PCR Arrays (Qiagen) were provided in 96-well plate format and contained primer assays for 10 focused genes (SCD, FABP3, DHCR7, INSIG1, QPRT, HMGCR, HMGCS1, LDLR, FADS1, FADS2) and 2 housekeeping genes (ACTB and GAPDH). RT2 Profiler PCR Arrays assays were performed on the real-time cycler ABI Prism 7300 System (Applied Biosystems). The exported Cts were analyzed using SABiosciences PCR Array Data Analysis Template Excel software and compared across STD-RL and STD-GAL groups using a paired experimental design.
VALIDATION OF miRNA FINDINGS
22 miRNAs were selected for follow up on the 17 individual samples (hsa-miR-146b-5p, hsa-miR-550a, hsa-miR-129-3p, hsa-miR-214, hsa-miR-21, hsa-miR-22, hsa-miR-132, hsa-miR-376c, hsa-miR-19a, hsa-miR-195, hsa-miR-181a, hsa-miR-486-5p, hsa-miR-377, hsa-miR-424,hsa-miR-542-3p,hsa-miR-22, hsa-miR-103a, hsa-miR-376b, hsa-miR-29b, hsa-miR-185, hsa-miR-564, hsa-miR-34a). The assays was identical to the one used on the pooled samples described above.
DATA ANALYSIS
Differential expression
For the mRNA studies, after standard image segmentation of the microarray images, RMA normalization was performed using GenePattern software [17]. At the individual level, the gene was considered to be differentially expressed if it showed an absolute average log ratio |ALR| ≥ 0.378 and p-value ≤ 0.01 between the experimental and control conditions. Pathway analyses were performed using GenePattern – Gene Set Enrichment Analysis (GSEA) [18] and its BioCarta Database.
For miRNA expression quantification comparative Ct method was used with SNORD61, SNORD68, SNORD72, SNORD95, SNORD96A and RNU6-2 as housekeeping genes. A miRNA was considered differentially expressed if it showed a |ΔΔCt| ≥ 0.583 and both a groupwise and pairwise p value of p ≤ 0.05 between the experimental and control condition.
These parameters were chosen based on previously analyzed datasets [17,18], and followed up by qPCR validation.
Hierarchical clustering and calculation of correlation
For both the mRNA and miRNA data two-way unsupervised clustering using Euclidian distance was performed using the GenePattern software package [19]. For mRNA, this was performed using the RMA - normalized log2 gene expression values from each individual sample, while for the miRNA the ΔCt values were used. Correlations were calculated in MS-Excel 2010 using Pearson coefficient.
Identification of miRNA targets
To identify the potentially affected mRNAs by the four miRNAs that were changed in both the GAL- and RL-exposed cultures (miR-129-3p, miR-146b-5p, miR-543 and miR-550a), we searched the miRDB online database [21] and established the list of their potential targets.
COMPARISON TO BRAIN EXPRESSION
To test the relevance of our fibroblast findings in context of human brain disorders, we examined the mRNA expression of putative miR-129-3p, miR-146b-5p, miR-543 and miR-550a targets in the developing human brain [33].
RESULTS
METABOLIC STRESS-INDUCED mRNA CHANGES
Our mRNA expression profiling revealed 2063 differentially expressed genes in the GAL group compared to the matched controls. Of these, 1117 (54.1%) were up-regulated (Supplemental Material 2A), while 946 (45.9%) showed downregulation. These regulated gene products were involved in cell cycle, apoptosis, inflammatory response and mRNA processing related pathways, and in metabolic adaptation. RL treatment had also a widespread effect on the transcriptome. 984 gene transcripts were affected by the RL treatment, with 640 mRNAs increased (65.0%) and 344 (35.0%) transcripts repressed (Supplemental Material 2B). Two-way unsupervised hierarchical clustering provided a good separation of samples based on the treatment condition (Supplemental Material 3AB). Pathway analysis with BioCarta classification revealed enrichment of 18 groups of transcripts in the GAL condition (Table 1A), while in the RL condition, the analysis revealed enrichment in 12 pathways and transcript repression in 3 pathways (Table 1B). Notably, 4 of these pathways were commonly upregulated in both the GAL and RL condition: peroxisome proliferator-activated receptor α (PPARA), carbohydrate response element binding protein 2 (CHREBP2), influence of Ras and Rho proteins on G1 to S Transition (RACCYCD) and stress induction of HSP regulation (HSP27). As there was a significant enrichment of lipid biosynthesis genes in the fibroblast as a result of exposure to RL and GAL conditions, we decided to validate a panel 10 commonly upregulated genes (SCD, FABP3, DHCR7, INSIG1, QPRT, HMGCR, HMGCS1, LDLR, FADS1, FADS2). qPCR assessment of expression validated 9 out of 10 transcript changes in both RL and GAL conditions (all except HMGCR, which showed the same directionality and magnitude of change, but did not reach statistical significance) (Supplemental Material 4) and revealed a high correlation between the microarray and qPCR results (GAL-STD comparison: r=0.92; RL-STD comparison: r=0.72) (Figure 2).
Table 1.
mRNA transcriptome changes. Microarray gene expression data, subjected to BioCarta pathway analysis with GSEA, identified 19 pathways enriched in fibroblasts cultured in GAL (A) and 15 in RL (B). The significantly changed BioCarta pathways are ranked by a net enrichment score (NES). The number of genes in each pathway is depicted in the Size column. Note that there are 4 differentially expressed pathways common for GAL and RL treatment (*).
| A. Galactose (GAL) media |
| NAME | SIZE | NES | p-value |
|---|---|---|---|
| RACCYCD* | 26 | 1.93 | 0.000000 |
| CELLCYCLE | 23 | 1.83 | 0.000000 |
| SRCRPTP | 11 | 1.70 | 0.000000 |
| P53 | 16 | 1.70 | 0.002045 |
| TEL | 18 | 1.73 | 0.010730 |
| STATHMIN | 19 | 1.57 | 0.011516 |
| CFTR | 12 | 1.65 | 0.012000 |
| CERAMIDE | 22 | 1.67 | 0.012448 |
| ATRBRCA | 21 | 1.60 | 0.016129 |
| G2 | 24 | 1.59 | 0.026157 |
| HSP27* | 15 | 1.47 | 0.026639 |
| CARM_ER | 34 | 1.61 | 0.027451 |
| PLCE | 12 | 1.47 | 0.030864 |
| CHREBP2* | 42 | 1.61 | 0.031373 |
| AKAPCENTROSOME | 15 | 1.53 | 0.031809 |
| CHEMICAL | 22 | 1.56 | 0.032520 |
| RB | 13 | 1.53 | 0.034137 |
| PPARA* | 56 | 1.43 | 0.036000 |
| ATM | 20 | 1.58 | 0.044807 |
| B. Reduced lipid (RL) media |
| NAME | SIZE | NES | p-value |
|---|---|---|---|
| PPARA* | 56 | 1.80 | 0.000000 |
| P38MAPK | 39 | 1.56 | 0.009579 |
| VIP | 26 | 1.60 | 0.009709 |
| BAD | 26 | 1.48 | 0.015936 |
| CHREBP2* | 42 | 1.64 | 0.022945 |
| RACCYCD* | 26 | 1.65 | 0.027559 |
| GCR | 19 | 1.46 | 0.038000 |
| HSP27* | 15 | 1.49 | 0.040541 |
| CD40 | 15 | 1.58 | 0.044000 |
| LYM | 11 | 1.37 | 0.047714 |
| TNFR2 | 18 | 1.53 | 0.048583 |
| TALL1 | 15 | 1.52 | 0.048638 |
| IL22BP | 16 | −1.56 | 0.020638 |
| DNAFRAGMENT | 10 | −1.51 | 0.030488 |
| AHSP | 11 | −1.59 | 0.043222 |
Commonly upregulated in NL and GAL treatment
Figure 2. qPCR validation of selected mRNA expression changes.

10 transcripts were validated using qPCR (SCD, FABP3, DHCR7, INSIG1, QPRT, HMGCR, HMGCS1, LDLR, FADS1, FADS2). X- axis denotes microarray-obtained average log2 ratios (ALR), while Y-axis denotes actin-normalized -ΔΔCt values obtained by qPCR. Note that the microarray and qPCR data were highly correlated (GAL: r=0.92 p<0.001; RL: r=0.72, p<0.001). For further details, see Supplemental Material 4.
miRNA EXPRESSION IN RESPONSE TO METABOLIC STRESS
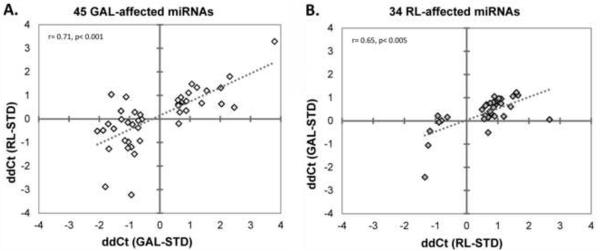
We found that in human fibroblasts 45 miRNAs were differentially expressed due to the GAL treatment (Table 2 A,B) (|ΔΔCt| ≥ 0.583; p≤0.05), with approximately same number of miRNAs increased and decreased (24 miRNAs and 21 miRNAs, respectively). The RL treatment affected 34 miRNAs, with more prominent downregulation than upregulation (27 and 7, respectively). When compared to the control cultures, four miRNAs showing significant differential expression overlapped in the two metabolic stress conditions (GAL, RL) (Figure 3). However, the overall pattern of miRNA profiles between the two stressors was strong: the differentially expressed miRNA’s in the GAL condition, when correlated with their expression level in the RL condition, showed a significant correlation (r=0.71, p<0.001) (Figure 4A). Similarly, the expression levels of differentially expressed miRNA’s in the RL condition were correlated with the expression levels observed in the RL condition (r=0.65, p<0.005) (Figure 4B). Furthermore, the combined list of these miRNA expression changes, when subjected to a two-way unsupervised hierarchical clustering, perfectly separated out the CNT, GAL and RL conditions (Figure 5). Thus, while the most changed miRNAs were not identical between the GAL and RL, the overall pattern suggested a comparable miRNA response between the two very different metabolic stressors.
Table 2.
miRNA expression profile changes in GAL (A) and RL (B) treatment in human fibroblasts. Blue - increased expression; Red – reduced expression; ΔΔCt - normalized threshold cycle difference between experimental and control samples; gt - groupwise t-test; pt – pairwise t-test. The correlations of these data are graphically represented in Figure 3.
| GAL-induced miRNA expression changes and their expression in RL |
| miRNA ID | ddCt (GAL-STD) | gt-test (GAL-STD) | pt-test (GAL-STD) | ddCt (RL-STD) | gt-test (RL-STD) | pt-test (RL-STD) |
|---|---|---|---|---|---|---|
| hsa-miR-378b | −2.065 | 0.006 | 0.003 | −0.512 | 0.548 | 0.614 |
| hsa-miR-1183 | −1.875 | 0.023 | 0.064 | −0.485 | 0.557 | N/A |
| hsa-miR-429 | −1.801 | 0.019 | 0.154 | −2.877 | N/A | N/A |
| hsa-miR-3682-3p | −1.704 | 0.031 | 0.178 | −0.212 | 0.659 | 0.936 |
| hsa-miR-187* | −1.683 | 0.034 | 0.074 | −1.270 | N/A | N/A |
| hsa-miR-4302 | −1.604 | 0.019 | 0.036 | 1.038 | 0.143 | 0.067 |
| hsa-miR-375 | −1.522 | 0.149 | 0.041 | −0.417 | 0.535 | 0.862 |
| hsa-miR-3200-5p | −1.283 | 0.041 | 0.128 | 0.338 | 0.489 | 0.509 |
| hsa-miR-3161 | −1.269 | 0.017 | 0.002 | −0.015 | 0.982 | 0.865 |
| hsa-miR-4267 | −1.154 | 0.006 | 0.015 | −0.915 | 0.105 | 0.085 |
| hsa-miR-378 | −1.115 | 0.057 | 0.040 | 0.935 | 0.169 | 0.183 |
| hsa-miR-3156-5p | −1.055 | 0.022 | 0.034 | −0.148 | 0.723 | 0.870 |
| hsa-miR-550a | −1.054 | 0.031 | 0.025 | −1.236 | 0.025 | 0.039 |
| hsa-miR-4257 | −1.044 | 0.020 | 0.327 | −0.972 | 0.227 | 0.436 |
| hsa-miR-3159 | −0.943 | 0.142 | 0.037 | −3.222 | 0.299 | 0.325 |
| hsa-miR-550a* | −0.941 | 0.042 | 0.133 | −1.192 | 0.130 | 0.072 |
| hsa-miR-720 | −0.903 | 0.090 | 0.023 | −0.236 | 0.588 | 0.335 |
| hsa-miR-2278 | −0.839 | 0.287 | 0.035 | −1.490 | 0.155 | 0.169 |
| hsa-miR-3907 | −0.827 | 0.070 | 0.013 | 0.291 | 0.436 | 0.343 |
| hsa-miR-3687 | −0.717 | 0.042 | 0.011 | −0.370 | 0.567 | 0.648 |
| hsa-miR-532-3p | −0.709 | 0.062 | 0.029 | −0.069 | 0.820 | 0.757 |
| hsa-miR-3190 | −0.658 | 0.430 | 0.050 | −0.930 | 0.242 | 0.572 |
| hsa-miR-1247 | −0.645 | 0.450 | 0.022 | 0.177 | 0.803 | 0.800 |
| hsa-miR-3647-3p | −0.590 | 0.011 | 0.048 | −0.017 | 0.949 | 0.960 |
| hsa-miR-301a | 0.602 | 0.038 | 0.025 | 0.802 | 0.070 | 0.060 |
| hsa-miR-369-3p | 0.612 | 0.029 | 0.030 | 0.575 | 0.052 | 0.025 |
| hsa-miR-874 | 0.616 | 0.313 | 0.002 | 0.632 | 0.398 | 0.277 |
| hsa-miR-486-5p | 0.626 | 0.279 | 0.029 | −0.196 | 0.754 | 0.680 |
| hsa-miR-543 | 0.659 | 0.025 | 0.020 | 0.610 | 0.021 | 0.035 |
| hsa-miR-1260b | 0.660 | 0.077 | 0.049 | 0.290 | 0.459 | 0.431 |
| hsa-miR-424 | 0.698 | 0.061 | 0.011 | 0.919 | 0.104 | 0.052 |
| hsa-miR-127-5p | 0.713 | 0.069 | 0.045 | 0.696 | 0.120 | 0.114 |
| hsa-miR-3913-5p | 0.757 | 0.343 | 0.031 | N/A | N/A | N/A |
| hsa-miR-628-5p | 0.871 | 0.020 | 0.067 | 0.355 | 0.440 | 0.552 |
| hsa-miR-181a* | 0.876 | 0.039 | 0.014 | 0.759 | 0.213 | 0.146 |
| hsa-miR-129-3p | 0.949 | 0.011 | 0.053 | 1.108 | 0.020 | 0.051 |
| hsa-miR-146b-5p | 1.058 | 0.007 | 0.011 | 1.487 | 0.015 | 0.005 |
| hsa-miR-1271 | 1.227 | 0.032 | 0.113 | 1.338 | 0.171 | 0.339 |
| hsa-miR-1285 | 1.386 | 0.010 | 0.037 | 0.667 | 0.407 | 0.517 |
| hsa-miR-337-5p | 1.550 | 0.017 | 0.103 | 1.200 | 0.060 | 0.061 |
| hsa-miR-217 | 2.018 | 0.112 | 0.013 | 1.323 | 0.097 | 0.223 |
| hsa-miR-3176 | 2.041 | 0.018 | 0.009 | 0.635 | 0.373 | 0.515 |
| hsa-miR-497* | 2.313 | 0.040 | 0.079 | 1.803 | 0.098 | 0.204 |
| hsa-miR-1227 | 2.462 | 0.014 | 0.113 | 0.488 | 0.343 | 0.172 |
| hsa-miR-146b-3p | 3.795 | 0.046 | 0.123 | 3.291 | 0.216 | 0.205 |
| RL-induced miRNA expression changes and their expression in GAL |
| miRNA ID | ddCt (RL-STD) | gt-test (RL-STD) | pt-test (RL-STD) | ddCt (GAL-STD) | gt-test (GAL-STD) | pt-test (GAL-STD) |
|---|---|---|---|---|---|---|
| hsa-miR-3154 | −1.342 | 0.039 | 0.047 | −2.425 | 0.161 | 0.267 |
| hsa-miR-550a | −1.236 | 0.025 | 0.039 | −1.054 | 0.031 | 0.025 |
| hsa-miR-16-1* | −1.181 | 0.014 | 0.063 | −0.437 | 0.347 | 0.311 |
| hsa-miR-138-1* | −0.924 | 0.326 | 0.021 | 0.219 | 0.775 | 0.712 |
| hsa-miR-641 | −0.887 | 0.042 | 0.253 | −0.059 | 0.875 | 0.726 |
| hsa-miR-2110 | −0.805 | 0.043 | 0.031 | 0.017 | 0.953 | 0.965 |
| hsa-miR-320e | −0.618 | 0.032 | 0.118 | 0.162 | 0.384 | 0.513 |
| hsa-miR-376c | 0.493 | 0.039 | 0.027 | 0.490 | 0.114 | 0.050 |
| hsa-miR-296-5p | 0.561 | 0.011 | 0.018 | 0.085 | 0.736 | 0.623 |
| hsa-miR-517* | 0.595 | 0.099 | 0.013 | 0.245 | 0.475 | 0.375 |
| hsa-miR-543 | 0.610 | 0.021 | 0.035 | 0.659 | 0.025 | 0.020 |
| hsa-miR-214 | 0.636 | 0.006 | 0.032 | 0.703 | 0.088 | 0.075 |
| hsa-miR-195 | 0.689 | 0.011 | 0.061 | 0.163 | 0.600 | 0.586 |
| hsa-miR-18a* | 0.692 | 0.057 | 0.014 | −0.504 | 0.238 | 0.141 |
| hsa-miR-19a | 0.710 | 0.103 | 0.035 | 0.168 | 0.660 | 0.323 |
| hsa-miR-212 | 0.742 | 0.031 | 0.032 | 0.404 | 0.155 | 0.078 |
| hsa-miR-132* | 0.753 | 0.120 | 0.002 | 0.766 | 0.122 | 0.292 |
| hsa-miR-411 | 0.779 | 0.016 | 0.066 | 0.331 | 0.391 | 0.410 |
| hsa-miR-330-5p | 0.854 | 0.117 | 0.007 | 0.797 | 0.261 | 0.347 |
| hsa-miR-431 | 0.864 | 0.023 | 0.004 | 0.579 | 0.063 | 0.016 |
| hsa-miR-154* | 0.891 | 0.008 | 0.115 | 1.052 | 0.087 | 0.110 |
| hsa-miR-18a | 0.900 | 0.039 | 0.029 | 0.198 | 0.597 | 0.375 |
| hsa-miR-29a* | 0.912 | 0.041 | 0.116 | 0.801 | 0.085 | 0.220 |
| hsa-miR-135b | 0.927 | 0.148 | 0.037 | 0.698 | 0.395 | 0.249 |
| hsa-miR-22* | 1.033 | 0.049 | 0.194 | 0.966 | 0.083 | 0.339 |
| hsa-miR-31 | 1.105 | 0.004 | 0.012 | 0.750 | 0.065 | 0.079 |
| hsa-miR-129-3p | 1.108 | 0.020 | 0.051 | 0.949 | 0.011 | 0.053 |
| hsa-miR-758 | 1.188 | 0.042 | 0.042 | 0.199 | 0.672 | 0.608 |
| hsa-miR-106b* | 1.193 | 0.035 | 0.229 | 0.188 | 0.795 | 0.918 |
| hsa-miR-299-3p | 1.414 | 0.048 | 0.109 | 0.612 | 0.159 | 0.243 |
| hsa-miR-146b-5p | 1.487 | 0.015 | 0.005 | 1.058 | 0.007 | 0.011 |
| hsa-miR-196b* | 1.599 | 0.025 | 0.034 | 1.226 | 0.114 | 0.289 |
| hsa-miR-21* | 1.647 | 0.003 | 0.019 | 1.102 | 0.093 | 0.052 |
| hsa-miR-331-5p | 2.660 | 0.010 | 0.041 | 0.058 | 0.915 | 0.932 |
Figure 3. Commonly changed miRNAs in GAL and RL culture conditions.
45 and 34 miRNAs showed significant change in GAL and RL conditions, respectively (red- decreased; blue – increased). Note that the 4 commonly changed miRNAs had the same directionality in both GAL and RL conditions, and they were significantly altered in both pairwise (ppval) and groupwise (gpval) testing.
Figure 4. Overall miRNA pattern changes in GAL and RL conditions are highly correlated.

The 45 miRNAs with significantly changed expression pattern in GAL conditions were assessed in the RL samples (A) and the 34 miRNAs with significantly changed expression pattern in RL conditions were assessed in the GAL samples (B). Note that the miRNA pattern observed in either metabolic stressor also showed a similar, highly correlated expression pattern in the other condition.
Figure 5. miRNA expression pattern separates the STD, GAL and RL lipid conditions.

Two-way unsupervised hierarchical clustering was performed on the expression level (ΔCt) of 75 differentially expressed miRNAs. Samples were clustered vertically, miRNAs were clustered horizontally. Each colored square represents a normalized gene expression level, color coded for increase (red) or decrease (blue) from the mean. Color intensity is proportional to magnitude of change. The clustering resulted in a perfect separation of samples into three discrete groups corresponding to culture conditions (vertical dendrogram, green STD, yellow GAL, and orange RL).
As the initial screening was performed on 4 pools of samples which could theoretically bias our data, we wanted to validate the expression of 22 miRNAs on our 17 individual samples. In this follow-up study the initial miRNA findings on the pooled samples showed the expected expression pattern on the individual experimental samples (Figure 6).
Figure 6. Correlation of miRNA changes between individual and pooled fibroblast samples cultured in GAL (A) and RL (B) conditions.
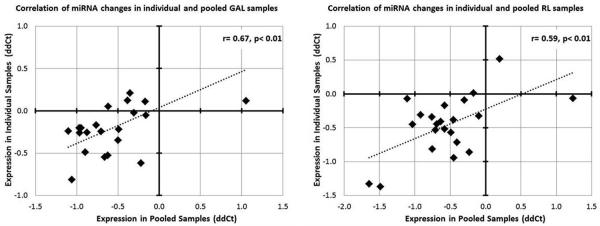
22 miRNAs were assessed in the validation study, with the pooled ΔΔCTs plotted on X axis and the ΔΔCTs from individual samples plotted on the Y axis. Each miRNA represents a single data point. The correlation coefficient indicates that pooling of the samples did not skew artificially the miRNA pattern observed in GAL and RL.
CORRELATION OF miRNA WITH mRNA EXPRESSION
To establish how metabolic stress-induced miRNAs affect the mRNA transcriptome, we focused our attention on the four significantly changed miRNAs that overlapped between the GAL- and RL-treatment: miR-129-3p, miR-146b-5p, miR-543 and miR-550a. To identify the target mRNAs of these miRNAs we established the list of their potential targets using the miRDB online data base. The database revealed 211 putative mRNA targets of miR-129-3p, 243 mRNA targets of miR146b-5p, 129 mRNA targets of miR-550a, and 921 targets for miR-543 (Supplemental Material 5). Of the combined 1504 potential targets 140 mRNAs showed significant change at gene expression level (Table 3A-C). It is noteworthy that multiple target genes showed significantly altered transcription levels in both the GAL- and RL-treated human fibroblast cultures, further arguing for a consistent effect of the two different metabolic stressors.
Table 3.
miRNA and mRNA expression changes are correlated in human fibroblasts. The three commonly changed miRNAs in both GAL and RL conditions were correlated with expression changes of 52 putative target mRNAs. A. miR-129-3p target changes, B. miR-550a target changes, C. miR-146b-5p target changes. The commonly changed mRNAs in both GAL- and RL-medium exposed human fibroblasts are marked with an asterisk.
| A. miR-129-3p |
| Gene | ALR GAL | pval GAL | Gene | ALR RL | pval RL |
|---|---|---|---|---|---|
| FADS1* | 1.08 | 0.000001 | FADS1* | 1.22 | 0.000000 |
| FADS1* | 1.08 | 0.000001 | FADS1* | 1.22 | 0.000000 |
| FADS1* | 1.06 | 0.000001 | FADS1* | 1.11 | 0.000000 |
| DGKI | 0.68 | 0.000073 | STARD4 | 0.94 | 0.000000 |
| LHFPL2 | 0.63 | 0.000000 | TMTC1* | 0.57 | 0.000173 |
| PTGER4* | 0.51 | 0.000302 | PTGER4* | 0.57 | 0.000329 |
| TMTC1* | 0.50 | 0.000007 | CCDC102B | 0.51 | 0.006941 |
| CDK1 | 0.49 | 0.007441 | RCAN2 | 0.45 | 0.000727 |
| CDCA7L | 0.47 | 0.000002 | CHML | 0.43 | 0.000010 |
| PKIA | 0.43 | 0.000075 | RFX7 | 0.41 | 0.000179 |
| C2orf88 | 0.41 | 0.000036 | RIMS1 | 0.38 | 0.004726 |
| RDH10 | −0.42 | 0.000011 | CYP27C1 | 0.38 | 0.000169 |
| ZNF436 | −0.42 | 0.000329 | |||
| BAALC | −0.60 | 0.000524 |
| B. miR-550a |
| Gene | ALR GAL | pval GAL | Gene | ALR RL | pval RL |
|---|---|---|---|---|---|
| CLIC2 | 1.18 | 0.000000 | DSTN | 0.44 | 0.000322 |
| SPATA13 | 0.50 | 0.000059 | EXPH5* | 0.41 | 0.008081 |
| C1QTNF2 | 0.48 | 0.002883 | NGEF | 0.40 | 0.005541 |
| OSBPL8 | 0.48 | 0.000000 | APOL6 | −0.93 | 0.000000 |
| PLD1 | 0.45 | 0.000245 | |||
| SCARA3 | 0.39 | 0.000014 | |||
| ADAMTS6 | −0.38 | 0.005308 | |||
| EXPH5* | −0.51 | 0.001573 | |||
| MYH2 | −0.80 | 0.000192 |
| C. miR-146b-5p |
| Gene | ALR GAL | pval GAL | Gene | ALR RL | pval RL |
|---|---|---|---|---|---|
| IFIT3 | 0.65 | 0.000003 | SVIL* | 0.58 | 0.000000 |
| IQGAP3 | 0.64 | 0.000058 | KRTAP1-5* | 0.56 | 0.000110 |
| IRAK1 | 0.61 | 0.000001 | SVIL* | 0.50 | 0.000009 |
| SYT14 | 0.61 | 0.000101 | CLCN6* | 0.46 | 0.000000 |
| RAB7L1 | 0.58 | 0.000000 | PID1 | 0.42 | 0.000173 |
| RAB7L1 | 0.55 | 0.000000 | NOVA1 | 0.41 | 0.000848 |
| CLCN6* | 0.52 | 0.000001 | SLC1A1* | −0.45 | 0.000093 |
| SVIL* | 0.44 | 0.000079 | LRRC15 | −0.45 | 0.000372 |
| STRBP | 0.43 | 0.000607 | KIAA1199 | −0.47 | 0.001176 |
| TIMELESS | 0.42 | 0.000047 | |||
| RACGAP1 | 0.41 | 0.000632 | |||
| STIL | 0.40 | 0.002208 | |||
| WISP1 | −0.38 | 0.002183 | |||
| DNAL1 | −0.39 | 0.000081 | |||
| DNAL1 | −0.40 | 0.002178 | |||
| SLC1A1* | −0.49 | 0.000259 | |||
| KRTAP1-5* | −0.53 | 0.003753 | |||
| RASGRP1 | −0.67 | 0.000057 |
| D. miR-543 |
| Gene | ALR GAL | pval GAL | Gene | ALR RL | pval RL |
|---|---|---|---|---|---|
| RRAGD* | 2.36 | 0.000000 | NRXN3 | 1.98 | 0.009901 |
| RRAGD | 1.48 | 0.000000 | ABCA1* | 1.60 | 0.000000 |
| PAG1 | 0.98 | 0.000000 | ABCA1* | 0.92 | 0.000000 |
| PAG1 | 0.91 | 0.000000 | PLA2G4A | 0.86 | 0.002028 |
| LAMA1 | 0.83 | 0.000029 | GALNT1 | 0.84 | 0.003950 |
| C3orf55 | 0.82 | 0.000002 | RRAGD* | 0.79 | 0.009357 |
| PAG1* | 0.80 | 0.000000 | PPP1R12B* | 0.76 | 0.003190 |
| PRKAR2B* | 0.76 | 0.000002 | GALNT1 | 0.70 | 0.005351 |
| TOX | 0.68 | 0.000073 | GALNT1 | 0.63 | 0.002321 |
| ZNF367 | 0.64 | 0.000001 | COL16A1 | 0.61 | 0.000219 |
| CDK1 | 0.63 | 0.000099 | ZNF436 | 0.56 | 0.000329 |
| PBX3 | 0.62 | 0.000000 | TRIM13 | 0.50 | 0.000035 |
| DCLK1 | 0.61 | 0.000864 | ZNF436 | 0.49 | 0.001606 |
| FNIP2* | 0.58 | 0.000013 | DUSP3* | 0.46 | 0.000321 |
| ZCCHC14 | 0.58 | 0.000000 | EVI5 | 0.39 | 0.000685 |
| CDK1 | 0.58 | 0.000135 | TGFB1 | 0.39 | 0.000077 |
| GTSE1 | 0.56 | 0.001911 | DDX3X | 0.38 | 0.005765 |
| CDK1 | 0.56 | 0.000136 | PAG1* | 0.38 | 0.000839 |
| BEX2 | 0.55 | 0.000005 | FNIP2* | 0.38 | 0.000458 |
| GTSE1 | 0.54 | 0.001029 | CCDC117 | −0.38 | 0.000395 |
| DUSP3* | 0.54 | 0.000000 | ADAMTSL1 | −0.41 | 0.000269 |
| FNIP2 | 0.52 | 0.000006 | EEF1A1 | −0.42 | 0.003515 |
| ESCO2 | 0.51 | 0.000066 | SMAD5 | −0.42 | 0.008163 |
| E2F7 | 0.51 | 0.000144 | ADAMTSL1* | −0.43 | 0.002492 |
| FMNL2 | 0.49 | 0.000014 | TMEM133 | −0.43 | 0.003737 |
| B3GNT5 | 0.49 | 0.000143 | ADAMTSL1* | −0.44 | 0.004797 |
| ABCA1* | 0.49 | 0.000012 | PDP1 | −0.44 | 0.000010 |
| CDK1 | 0.49 | 0.007441 | ADAMTSL1 | −0.53 | 0.000006 |
| OSBPL8 | 0.48 | 0.000000 | CHML | −0.53 | 0.000279 |
| DCLK1 | 0.48 | 0.003116 | PDE5A* | −0.56 | 0.002906 |
| DCLK1 | 0.48 | 0.003116 | GBP1 | −0.60 | 0.003012 |
| SLC2A13 | 0.47 | 0.000000 | RAPH1* | −0.68 | 0.000064 |
| OSBPL1A | 0.47 | 0.000000 | HIPK2 | −0.71 | 0.000009 |
| ABCA1* | 0.47 | 0.000006 | PRKAR2B* | −0.75 | 0.000159 |
| RAD51AP1 | 0.46 | 0.000394 | CREB5* | −1.49 | 0.000041 |
| DUSP3 | 0.46 | 0.000000 | CREB5* | −1.58 | 0.000760 |
| LAMP2 | 0.45 | 0.000000 | |||
| GTSE1 | 0.45 | 0.003273 | |||
| FMNL2 | 0.45 | 0.000000 | |||
| WHSC1 | 0.44 | 0.000477 | |||
| STRBP | 0.43 | 0.000607 | |||
| CCNF | 0.43 | 0.000305 | |||
| SMC4 | 0.42 | 0.000009 | |||
| DUSP3 | 0.42 | 0.000000 | |||
| C3orf55 | 0.41 | 0.000024 | |||
| SLC2A13 | 0.40 | 0.000035 | |||
| ATP6V1A | 0.40 | 0.000000 | |||
| OSBPL8 | 0.40 | 0.000000 | |||
| HMGB2 | 0.40 | 0.000029 | |||
| ACYP1 | 0.40 | 0.000001 | |||
| RBM47 | 0.40 | 0.000154 | |||
| MEGF9 | 0.40 | 0.000002 | |||
| ZCCHC14 | 0.40 | 0.000657 | |||
| OSBPL1A | 0.40 | 0.000003 | |||
| CD163 | 0.39 | 0.005055 | |||
| ATP6V1A | 0.39 | 0.000022 | |||
| WHSC1 | 0.38 | 0.000535 | |||
| TMEM135 | 0.38 | 0.000045 | |||
| SC5DL | 0.38 | 0.000265 | |||
| NRXN3 | −0.38 | 0.002052 | |||
| USP53 | −0.38 | 0.002009 | |||
| NRCAM | −0.38 | 0.000730 | |||
| PDE5A* | −0.39 | 0.000332 | |||
| MDM4 | −0.40 | 0.000436 | |||
| COL1A2 | −0.41 | 0.000018 | |||
| TRIM13 | −0.41 | 0.001256 | |||
| SNAPC3 | −0.43 | 0.000598 | |||
| ADAMTSL1* | −0.43 | 0.000002 | |||
| ARHGAP29 | −0.45 | 0.000223 | |||
| RAPH1 | −0.45 | 0.000001 | |||
| SYNE1 | −0.47 | 0.000020 | |||
| GATS | −0.47 | 0.000009 | |||
| RAPH1* | −0.49 | 0.000071 | |||
| CREB5* | −0.50 | 0.000029 | |||
| RAPH1 | −0.52 | 0.000001 | |||
| RAPH1 | −0.52 | 0.000007 | |||
| ACVR2A | −0.52 | 0.000006 | |||
| CHN1 | −0.53 | 0.000002 | |||
| FNDC3B | −0.54 | 0.000034 | |||
| CACNB4 | −0.56 | 0.000001 | |||
| SYTL4 | −0.56 | 0.000113 | |||
| ADAMTSL1* | −0.57 | 0.000000 | |||
| CREB5* | −0.59 | 0.000234 | |||
| ADAMTSL1 | −0.60 | 0.000003 | |||
| PPP1R12B* | −0.63 | 0.000179 | |||
| PAWR | −0.64 | 0.000017 | |||
| ID4 | −0.74 | 0.000000 | |||
| ID4 | −0.80 | 0.000000 | |||
| ID4 | −0.83 | 0.000002 | |||
| ARRDC4 | −0.85 | 0.000002 | |||
| CYP26B1 | −1.16 | 0.000000 |
ALR- average log2 ratio; RL- reduced lipid media; GAL- galactose media
commonly changed mRNAs in GAL and NL treatment
Finally, we attempted to establish if any of these putative mRNA targets of miR-129-3p, miR-146b-5p, miR-543 and miR-550a showed spatio-temporal regulation in the developing human brain [31]. Fourteen such transcripts were identified (rfx7, syt14, nova1, kiaa1199, spata13, osbpl8, exph5, ngef, pag1, acyp1, pde5a, adamtsl1, cyp26b1 and pag1) (Supplemental Material 6), suggesting that these targets should be the primary focus of further follow-up examinations in the brain tissue of neurodevelopmental disorders.
CONCLUSIONS
This study established the mRNA and miRNA expression changes in human fibroblast cell cultures in response to two nutrition-based metabolic stress paradigms. We found that 1) glucose depleted, galactose supplemented and a lipid reduced, cholesterol depleted medium produced widespread mRNA and miRNA changes in human fibroblasts; 2) while the most significantly changed miRNAs showed variation, the overall miRNA changes across the two metabolic stress conditions showed considerable similarity; 3) it appears that changes in miRNA expression contributed considerably to altered mRNA expression profile in both the GAL and RL conditions and 4) we identified 4 significantly changed miRNAs (miR-129-3p, miR-146b-5p, miR-543 and miR-550a) that are likely to be important mediators of multiple types of metabolic stress.
Using the individual transcript assessment approach, we identified only four significantly changed miRNAs (miR-129-3p, miR-146b-5p, miR-543 and miR-550a) across the two metabolic stressors. Yet, this is not surprising, as transcripts work in networks: while we observed considerable differences in the most changed miRNAs of the GAL- and RL-treated fibroblasts, the overall miRNA profile of the two stressors was strikingly similar. Furthermore, 4 metabolic stress-related transcript pathways (PPARA, CHREBP2, RACCYCD, and HSP27) were upregulated in both GAL and RL-exposed cultures, suggesting that this common signature is present both at the miRNA and mRNA level. This came as a surprise, as the two stressors acts through distinct mechanisms: the GAL condition primarily creates oxidative radicals through starvation [7], while the RL conditions forces the cells into a metabolic overdrive [10]. Based on these findings we propose that metabolic stress, regardless of the type of the insult, might have a common miRNome and mRNA signature, and this common signature perhaps represents a non-specific resilience response, helping the cells to adapt and survive.
Our results also suggest that the four changed miRNAs alone appeared to be able to regulate the mRNA expression of 52 target genes, arguing that miRNA regulation of the transcriptome might be a significant contributor to metabolic stress-induced cellular responses. Unfortunately, miR-543 and miR-550a has not been well studied experimentally, and their effects remain mostly unknown. However, mir-129-2 and miR-146b-5p have been a focus of multiple investigations to date: mir-129-2 is located next to a CpG island and is methylation-associated, and the expression of this miRNA can be epigenetically restored by de-methylating drugs [22]. Furthermore, mir-129-2 is conserved in vertebrates and regulates the expression of CP110, ARP2, TOCA1, ABLIM1 and ABLIM3, thus effectively controlling actin dynamics in the cell [21]. Still, miR-146b-5p might be the most important finding of our studies: its expression is highly induced by proinflammatory cytokines, with a clear dependency on IFN-γ, potentially via the JAK/STAT pathway [24,25]. Furthermore, a decrease of miR-146b-5p has been observed in monocytes during obesity, and it was associated with loss of the anti-inflammatory signaling action [26]. miR-146b-5p also regulates signal transduction of TGF-β [27], and appears to play a critical role in the pathophysiology of various cancers [28,29]. These data suggest that metabolic stress might regulate miRNA expression through epigenetic modification, and that the two metabolic stressors trigger an inflammation-like response in the stressed cells. However, this hypothesis has to be tested more comprehensively in follow-up experiments.
Finally, we need to emphasize that peripheral biomarkers studies are essential to understand the pathophysiology of human brain disorders. Recent studies indicate that peripheral biomarkers may aid the diagnosis of psychiatric disorders and help assess treatment efficacy [30]. However, obtaining peripheral patient tissues and analyzing them at resting state might not be sufficient to reveal the critical deficits, and they must be challenged to reveal the full signature of the disease [7,31]. Human dermal fibroblasts as a model system are ideally suited for such studies [32], as they have several advantages over the functional assays performed on peripheral blood cells: 1) they can be readily propagated without immortalization, 2) have a more similar expression profile to brain cells than peripheral blood cells; 3) are homogenous and very responsive to a variety of stimuli, and 4) they are minimally affected by epigenetic changes, which usually disappear after the 5th culture passage.
Our results also suggest that metabolic stress in dermal fibroblasts affects genes that are important for brain development and homeostasis. The 4 miRNAs with differential expression in both the RL and GAL condition (miR-129-3p, miR-146b-5p, miR-543 and miR-550a) regulated multiple genes (e.g. NGEF, NOVA1, PDE5A) that show region- and age-specific transcription in the human brain [33], suggesting that deregulation of these transcripts might have significant consequences on brain function, and should be examined in the context of neurodevelopmental disorders. Thus, dermal fibroblasts are appealing, readily available human biomaterials, allowing to perform controlled, functional and reproducible experiments on human tissue. This is especially important for studying major, polygenic psychiatric disorders, where postmortem tissue availability is limited and the genetic animal models do not fully recapitulate the human disease. This study defined the miRNA/mRNA transcriptome responses of fibroblasts to metabolic stress in healthy individuals, and similar studies should be performed in diseased patient material – the response of their transcriptome to the metabolic stress will be more revealing of pathophysiology than the case-control differences under resting, unchallenged conditions.
Supplementary Material
Research highlights.
metabolic stress produced strong mRNA and miRNA changes in human fibroblasts
miRNA changes across two metabolic stress conditions showed substantial similarity
miRNA expression contributed to altered mRNA expression
miRNA and mRNA changes were correlated
miR 129 3p, miR 146b 5p, miR 543 and miR 550a are mediators of metabolic stress
Acknowledgments
KM’s work is supported by NIMH grants R01MH067234 and R01 MH079299. RS work was supported by NIMH grants MH01741, MH52339, and MH073630. We are grateful for Dr. Martin J. Schmidt for providing valuable comments and editing the manuscript.
Footnotes
Publisher's Disclaimer: This is a PDF file of an unedited manuscript that has been accepted for publication. As a service to our customers we are providing this early version of the manuscript. The manuscript will undergo copyediting, typesetting, and review of the resulting proof before it is published in its final citable form. Please note that during the production process errors may be discovered which could affect the content, and all legal disclaimers that apply to the journal pertain.
REFERENCES
- 1.Horvath S, Janka Z, Mirnics K. Analyzing schizophrenia by DNA microarrays. Biol Psychiatry. 2010;69:157–162. doi: 10.1016/j.biopsych.2010.07.017. [DOI] [PMC free article] [PubMed] [Google Scholar]
- 2.Mirnics K, Lewis DA. Genes and subtypes of schizophrenia. Trends Mol Med. 2001;7:281–283. doi: 10.1016/s1471-4914(01)02067-6. [DOI] [PubMed] [Google Scholar]
- 3.Glorioso C, Sabatini M, Unger T, Hashimoto T, Monteggia LM, et al. Specificity and timing of neocortical transcriptome changes in response to BDNF gene ablation during embryogenesis or adulthood. Mol Psychiatry. 2006;11:633–648. doi: 10.1038/sj.mp.4001835. [DOI] [PubMed] [Google Scholar]
- 4.Garbett KA, Horvath S, Ebert PJ, Schmidt MJ, Lwin K, et al. Novel animal models for studying complex brain disorders: BAC-driven miRNA-mediated in vivo silencing of gene expression. Mol Psychiatry. 2010 doi: 10.1038/mp.2010.1. 10.1038/mp.2010.1031. [DOI] [PMC free article] [PubMed] [Google Scholar]
- 5.Garbett KA, Hsiao EY, Kalman S, Patterson PH, Mirnics K. Effects of maternal immune activation on gene expression patterns in the fetal brain. Transl Psychiatry. 2012;2:e98. doi: 10.1038/tp.2012.24. [DOI] [PMC free article] [PubMed] [Google Scholar]
- 6.Akin D, Manier DH, Sanders-Bush E, Shelton RC. Signal transduction abnormalities in melancholic depression. Int J Neuropsychopharmacol. 2005;8:5–16. doi: 10.1017/S146114570400478X. [DOI] [PubMed] [Google Scholar]
- 7.Gibson SA, Korade Z, Shelton RC. Oxidative stress and glutathione response in tissue cultures from persons with major depression. J Psychiatr Res. 2012;46:1326–1332. doi: 10.1016/j.jpsychires.2012.06.008. [DOI] [PMC free article] [PubMed] [Google Scholar]
- 8.de Nadal E, Ammerer G, Posas F. Controlling gene expression in response to stress. Nat Rev Genet. 2011;12:833–845. doi: 10.1038/nrg3055. [DOI] [PubMed] [Google Scholar]
- 9.Marroquin LD, Hynes J, Dykens JA, Jamieson JD, Will Y. Circumventing the Crabtree effect: replacing media glucose with galactose increases susceptibility of HepG2 cells to mitochondrial toxicants. Toxicol Sci. 2007;97:539–547. doi: 10.1093/toxsci/kfm052. [DOI] [PubMed] [Google Scholar]
- 10.Jacobs RA, Sly WS, Majerus PW. The regulation of fatty acid biosynthesis in human skin fibroblasts. J Biol Chem. 1973;248:1268–1276. [PubMed] [Google Scholar]
- 11.Raff RA. Induction of fatty acid synthesis in cultured mammalian cells: effects of cycloheximide and X-rays. J Cell Physiol. 1970;75:341–351. doi: 10.1002/jcp.1040750310. [DOI] [PubMed] [Google Scholar]
- 12.Bensaude I, Callahan J, Philippart M. Fabry’s disease as an -galactosidosis: evidence for an - configuration in trihexosyl ceramide. Biochem Biophys Res Commun. 1971;43:913–918. doi: 10.1016/0006-291x(71)90704-2. [DOI] [PubMed] [Google Scholar]
- 13.Malan-Muller S, Hemmings SM, Seedat S. Big effects of small RNAs: a review of microRNAs in anxiety. Mol Neurobiol. 2012;47:726–739. doi: 10.1007/s12035-012-8374-6. [DOI] [PMC free article] [PubMed] [Google Scholar]
- 14.Inui M, Martello G, Piccolo S. MicroRNA control of signal transduction. Nat Rev Mol Cell Biol. 2010;11:252–263. doi: 10.1038/nrm2868. [DOI] [PubMed] [Google Scholar]
- 15.Manier DH, Eiring A, Shelton RC, Sulser F. Beta-adrenoceptor-linked protein kinase A (PKA) activity in human fibroblasts from normal subjects and from patients with major depression. Neuropsychopharmacology. 1996;15:555–561. doi: 10.1016/S0893-133X(96)00099-1. [DOI] [PubMed] [Google Scholar]
- 16.APA . American Psychiatric Association; Washington, DC: 2000. Diagnostic and statistical manual of mental disorders. [Google Scholar]
- 17.Unger T, Korade Z, Lazarov O, Terrano D, Sisodia SS, Mirnics K. True and false discovery in DNA microarray experiments: transcriptome changes in the hippocampus of presenilin 1 mutant mice. Methods. 2005;37(3):261–73. doi: 10.1016/j.ymeth.2005.09.005. [DOI] [PubMed] [Google Scholar]
- 18.Mirnics K. Microarrays in Brain Research: Data Quality and Limitations Revisited. Current Genomics. 2006;7:11–17. [Google Scholar]
- 19.Reich M, Liefeld T, Gould J, Lerner J, Tamayo P, et al. GenePattern 2.0. Nat Genet. 2006;38:500–501. doi: 10.1038/ng0506-500. [DOI] [PubMed] [Google Scholar]
- 20.Subramanian A, Kuehn H, Gould J, Tamayo P, Mesirov JP. GSEA-P: a desktop application for Gene Set Enrichment Analysis. Bioinformatics. 2007;23:3251–3253. doi: 10.1093/bioinformatics/btm369. [DOI] [PubMed] [Google Scholar]
- 21.Wang X. miRDB: a microRNA target prediction and functional annotation database with a wiki interface. RNA. 2008;14:1012–1017. doi: 10.1261/rna.965408. [DOI] [PMC free article] [PubMed] [Google Scholar]
- 22.Tsai KW, Wu CW, Hu LY, Li SC, Liao YL, et al. Epigenetic regulation of miR-34b and miR-129 expression in gastric cancer. Int J Cancer. 2011;129:2600–2610. doi: 10.1002/ijc.25919. [DOI] [PubMed] [Google Scholar]
- 23.Cao J, Shen Y, Zhu L, Xu Y, Zhou Y, et al. miR-129-3p controls cilia assembly by regulating CP110 and actin dynamics. Nat Cell Biol. 2012;14:697–706. doi: 10.1038/ncb2512. [DOI] [PubMed] [Google Scholar]
- 24.Kutty RK, Nagineni CN, Samuel W, Vijayasarathy C, Jaworski C, et al. Differential regulation of microRNA-146a and microRNA-146b-5p in human retinal pigment epithelial cells by interleukin-1beta, tumor necrosis factor-alpha, and interferon-gamma. Mol Vis. 2013;19:737–750. [PMC free article] [PubMed] [Google Scholar]
- 25.Takahashi N, Nakaoka T, Yamashita N. Profiling of immune-related microRNA expression in human cord blood and adult peripheral blood cells upon proinflammatory stimulation. Eur J Haematol. 2012;88:31–38. doi: 10.1111/j.1600-0609.2011.01707.x. [DOI] [PubMed] [Google Scholar]
- 26.Hulsmans M, Van Dooren E, Mathieu C, Holvoet P. Decrease of miR-146b-5p in monocytes during obesity is associated with loss of the anti-inflammatory but not insulin signaling action of adiponectin. PLoS One. 2012;7:e32794. doi: 10.1371/journal.pone.0032794. [DOI] [PMC free article] [PubMed] [Google Scholar]
- 27.Geraldo MV, Yamashita AS, Kimura ET. MicroRNA miR-146b-5p regulates signal transduction of TGF-beta by repressing SMAD4 in thyroid cancer. Oncogene. 2011;31:1910–1922. doi: 10.1038/onc.2011.381. [DOI] [PubMed] [Google Scholar]
- 28.Garcia Al, Buisson M, Bertrand P, Rimokh R, Rouleau E, et al. Down-regulation of BRCA1 expression by miR-146a and miR-146b-5p in triple negative sporadic breast cancers. EMBO Mol Med. 2011;3:279–290. doi: 10.1002/emmm.201100136. [DOI] [PMC free article] [PubMed] [Google Scholar]
- 29.Katakowski M, Zheng X, Jiang F, Rogers T, Szalad A, et al. MiR-146b-5p suppresses EGFR expression and reduces in vitro migration and invasion of glioma. Cancer Invest. 2010;28:1024–1030. doi: 10.3109/07357907.2010.512596. [DOI] [PMC free article] [PubMed] [Google Scholar]
- 30.Michel M, Schmidt MJ, Mirnics K. Immune system gene dysregulation in autism and schizophrenia. Dev Neurobiol. 2012;72:1277–1287. doi: 10.1002/dneu.22044. [DOI] [PMC free article] [PubMed] [Google Scholar]
- 31.Naydenov AV, MacDonald ML, Ongur D, Konradi C. Differences in lymphocyte electron transport gene expression levels between subjects with bipolar disorder and normal controls in response to glucose deprivation stress. Arch Gen Psychiatry. 2007;64:555–564. doi: 10.1001/archpsyc.64.5.555. [DOI] [PubMed] [Google Scholar]
- 32.Manier DH, Shelton RC, Ellis TC, Peterson CS, Eiring A, et al. Human fibroblasts as a relevant model to study signal transduction in affective disorders. J Affect Disord. 2000;61:51–58. doi: 10.1016/s0165-0327(99)00190-1. [DOI] [PubMed] [Google Scholar]
- 33.Kang HJ, Kawasawa Yl, Cheng F, Zhu Y, Xu X, Li M, Sousa AM, Pletikos M, Meyer KA, Sedmak G, Guennel T, Shin Y, Johnson MB, Krsnik Z, Mayer S, Fertuzinhos S, Umlauf S, Lisgo SN, Vortmeyer A, Weinberger DR, Mane S, Hyde TM, Huttner A, Reimers M, Kleinman JE, Sestan N. Spatio-temporal transcriptome of the human brain. Nature. 2011;478(7370):483–9. doi: 10.1038/nature10523. [DOI] [PMC free article] [PubMed] [Google Scholar]
Associated Data
This section collects any data citations, data availability statements, or supplementary materials included in this article.