

Abstract
The development of effective methods for the characterization of gene functions that are able to combine diverse data sources in a sound and easily-extendible way is an important goal in computational biology. We have previously developed a general matrix factorization-based data fusion approach for gene function prediction. In this manuscript, we show that this data fusion approach can be applied to gene function prediction and that it can fuse various heterogeneous data sources, such as gene expression profiles, known protein annotations, interaction and literature data. The fusion is achieved by simultaneous matrix tri-factorization that shares matrix factors between sources. We demonstrate the effectiveness of the approach by evaluating its performance on predicting ontological annotations in slime mold D. discoideum and on recognizing proteins of baker’s yeast S. cerevisiae that participate in the ribosome or are located in the cell membrane. Our approach achieves predictive performance comparable to that of the state-of-the-art kernel-based data fusion, but requires fewer data preprocessing steps.
Keywords: gene function prediction, data fusion, matrix factorization, Gene Ontology annotation, membrane protein, ribosomal protein
1. Introduction
Assigning functions to genes and proteins is a major challenge of biological research. Recent genome-scale data capture distinct but possibly noisy and incomplete views of cellular function. Collectively, these data provide valuable information for inference of gene and protein functions but require computational approaches capable of joint treatment of heterogeneous data sources.
Gene function prediction aims to provide a set of functional terms along with associated confidence for a given uncharacterized or partially characterized gene. In this work, we take a step towards improved gene function prediction through fusion of data sets that are either directly related to genes, such as genetic interactions, or are circumstantial, such as Medical Subject Headings (MeSH) terms assigned to the relevant biomedical literature. In our previous work, we proposed a matrix factorization-based data fusion1 and demonstrated its utility in detection of drug-toxicity.2 Its advantage over some well-known approaches that infer prediction models through integrative data analysis is its ability to directly consider data modality and to retain the structure of data representation during fusion. Our algorithm can include any data source that can be represented in a matrix whereby the concrete selection of data sources depends on the given function prediction task.
Methods for gene function prediction often consider a metric space of genes, that is, a gene set equipped with a notion of distance or similarity between any pair of genes.3-6 All available data has to be expressed through relations between genes and their functions, although for specific data sources that might not be natural in any sense. For instance, to include the semantic structure of the MeSH terms into the prediction model we should design a metric that would, for a pair of genes, measures the distance between the MeSH terms that are assigned to relevant gene-pair-associated literature. Such distance function is hard to construct, and for integration of many heterogeneous data sources, becomes a major obstacle in development of prediction system. Our approach can consider circumstantial evidence for gene function prediction directly even if expressed in a non-gene space. Its principal novelty is the ease of adding new data sources without requiring their substantial preprocessing or transformation. Data sources are simultaneous considered during data fusion and construction of predictive model.
In the paper we outline our previously proposed data fusion algorithm2 and then study it in computational experiments on three function prediction tasks for baker’s yeast and slime mold’s genome-wide data sets. We fuse eleven data sources to predict the Gene Ontology (GO)7 annotations in slime mold D. discoideum and investigate the recognition of particular classes of proteins in baker’s yeast S. cerevisiae by combining four data sources on cytoplasmic ribosomal class and four sources on membrane proteins. Our principal contribution in this work is a demonstration that matrix-based data fusion approach can be applied to gene function prediction problem and can successfully integrate a diverse set of data sources, thus raising the accuracy of predictions.
2. Related Work
Methods to predict gene annotations either follow approaches that transfer annotations from well-characterized to partially characterized genes,3,8 or approaches that directly associate genes with functional classes using supervised learning.5,9-13 Although annotation transfer is appealing at first sight, excessive transferring causes error propagation and is often outperformed by sophisticated classification algorithms.14
Recent methodological contributions to gene function prediction aim at extracting features from different biological data sets and use them to train classifiers for functional categories, such as GO terms or KEGG pathways.14 They derive features from gene expression profiles, genetic interactions, protein-protein interaction networks, conserved protein domains, sequence similarity, physiochemical properties, co-expression and data on orthologs. For example, Vinayagam et al. (2004)9 and Mitsakakis et al. (2013)13 both applied support vector machines for the classification of GO terms from sequence data and microarray experiments, respectively, and Yan et al. (2010)11 trained a random forest classifier for each functional category separately and tested their prediction model on data from fruit fly. The accuracy of developed methods for gene function prediction has been further improved by integrating data using multi-classifier approaches,12 Bayesian reasoning,3,4,10,15 network-based analysis5,16,17 and kernel functions derived from different sources by multiple kernel learning.18,19 Automated gene and protein function prediction methods are often trained to only one species, are not available for high-volume and heterogeneous data, or require the use of data derived by experiments, such as microarray analysis. The approach we proposed in this manuscript is organism-independent, it can be applied for various subsets of functional terms and it provides confidence estimates of predictions. Also, it does not impose any restrictions on the nature of underlying data.
Due to great potential of methods for computational prediction of gene function we recently witnessed several initiatives6,20,21 for the critical assessment of their performance in different experimental settings. These evaluations concluded that although best methods perform well enough to guide the experiments, there is considerable need for improvement of currently available approaches one of which is efficient data integration.
3. Methods
Matrix factorization-based data fusion1 can in principle consider an unlimited number of data sources. In the context of gene function prediction, these could either describe characteristics of genes and proteins directly (e.g., their physical interactions) or indirectly (e.g., through MeSH terms that are assigned to scientific publications, which in turn mention the genes of interest). Fig. 1 provides a toy example that combines five data sources on objects of three different types: genes, GO terms and experimental conditions. Given a multitude of data sources, we assume that each source describes relations between objects of two types. Data fusion by matrix factorization involves three main steps. First, every data source is represented as a matrix and together they are organized in a block-based matrix representation (Fig. 1, left; Sec. 3.2). Constraint matrices, Θi, relate objects of type i and are placed on the main diagonal of block representation. The off-diagonal blocks, which relate objects of different types, i and j (i ≠ j), are called relation matrices, Rij. We expect that these matrices are sparse and that some are completely missing because associated data sources are not available. For example, a missing source from Fig. 1 would relate GO terms to experimental conditions. Second, we simultaneously factorize all relation matrices such that low-rank matrix factors are shared between decompositions of relation matrices that describe objects of common type (Fig. 1, middle; Sec. 3.3). Constraints indicate pairwise similarities or dissimilarities (it depends on signs of values) between the two objects. If constraints are violated, for instance, if two highly similar objects have very different low-rank profiles (i.e. corresponding rows in matrix factors), then current low-rank matrix approximations are penalized. Finally, we employ low-rank matrix factors to complete unobserved entries in relation matrices, to predict GO terms and to estimate confidence of predictions (Fig. 1, right; Sec. 3.4 and Sec. 3.5).
Fig. 1.

An example of data fusion by matrix factorization that combines five data sources on objects of three different types: genes, Gene Ontology (GO) terms and experimental conditions. Target matrix relates genes to GO terms (matrix with colorful entries). Data is presented in a block-based system (left), then a compressed representation is inferred that shares low-rank matrix factors between decompositions of relation matrices (shown by matrices with grey entries), which relate objects of common type (middle). Constraint matrices (shown by matrix with blue entries) penalize violations of similarity constraints. Finally, original matrix of gene annotations is completed (right).
We apply data fusion to infer relations between genes or proteins and their functions. We observe target relation matrix in the context of all other data sources. We assume that it is encoded as a [0, 1]-matrix that is only partially observed. Its entries indicate a degree of relation, 0 denoting that corresponding function is absent from the gene and 1 denoting the highest confidence that gene performs a specific function. We aim to predict its unobserved entries by reconstructing them through matrix factorization.
3.1. Data
3.1.1. Gene Annotation Prediction in Slime Mold
In this study we observe objects of six different types: genes (type 1), GO terms (type 2), experimental conditions (type 3), publications from the PubMed database (PMID) (type 4), MeSH descriptors (type 5), and KEGGa pathways (type 6). The organization of object types and data sources is shown in Fig. 2a; fusion algorithm can integrate all available data if the underlying graph is connected. We include gene expression measurements at different time-points of a 24-hour development cycle22 (R13, 14 experiments), gene annotations with experimental evidence code to 148 generic slim terms from the GO (R12), associations of PMIDs and genes from dictyBaseb, March, 2013 (R14), genes participating in KEGG pathways (R16), assignments of MeSH descriptors to publications from PubMed (R45), references to published work associated with GO terms (R42), and associations of enzymes involved in KEGG pathways and related to GO terms (R62). To balance the target matrix R12 for the purpose of performance evaluation we add an equal number of non-associations for which there is no evidence of any type in the GO.
Fig. 2.

Fusion configurations for the gene function prediction task in slime mold (a) and two yeast protein classification tasks to recognize cytoplasmic ribosomal proteins (b) and membrane proteins (c). Nodes represent types of objects and arcs correspond to relation and constraint matrices. The arcs that represent target matrices, R12, and their object types are highlighted.
We consider protein interaction scores from STRING v9.0c (Θ1), the number of common ortholog groups between KEGG pathways (Θ6) and slim term similarity scores (Θ2) that are computed as −0.8hops, where hops is the length of the shortest path between two terms in the GO graph. Similarly, MeSH descriptors are constrained with the average number of hops between each pair of descriptors in the MeSH hierarchy (Θ5).
3.1.2. Yeast Ribosomal Protein Classification
We observe three object types: proteins (type 1), cellular complexes (type 2) and experimental conditions (type 3). Their relations are described by four data sources that correspond to arcs in Fig. 2b. We consider the MIPS Comprehensive Yeast Genome Database (CYGD)d assignments of 1150 yeast proteins to cellular complexes, of which 134 participate in the ribosome and the remaining ~5000 yeast proteins are unlabeled.18 We include gene expression measurements from the Stanford Microarray Database (R13, 441 experiments), protein interactions from STRING v9.0c (Θ1(1)) and Smith-Waterman pairwise sequence comparisons (Θ1(2)).
3.1.3. Yeast Membrane Protein Classification
We consider four data sources and three types of objects (Fig. 2c): proteins (type 1), subcellular locations (type 2) and Pfame protein domain families. We consider subcellular location information of 2318 yeast proteins from the CYGDd database (R12), of which 497 belong to various membrane protein classes and ~4000 proteins have uncertain location.18 We include the expectation values from the hidden Markov models in the Pfam database (R13). Matrices Θ1(1) and Θ1(2) from Fig. 2c have the same meaning as for the ribosomal protein classification.
In both yeast experiments the target R12 has a (6112 × 2)-shape, where a row of [0, 1] denotes that the protein participates in ribosome or that it belongs to membrane protein class and a row of [1, 0] that the protein is not assigned to the ribosomal complex or that it does not belong to membrane protein class. Rows that correspond to unobserved proteins are set to [0.5, 0.5].
3.2. Block-Based Data Representation
The data on slime mold from Sec. 3.1.1 can be represented in a block-based system:
| (1) |
The number of non-zero blocks corresponds to the number of included data sources. Such representation is then fed into fusion algorithm. The block-based schemes for yeast-related data (Sec. 3.1.2 and Sec. 3.1.3) have the structure from Eq. (2), where the individual matrices are task-dependent:
| (2) |
Our fusion approach is different from treating an entire system from Eq. (1) or Eq. (2) as a single large matrix. Factorization of such a matrix would disregard the structure from Eq. (1) and Eq. (2).1
3.3. Data Fusion by Matrix Factorization
Approximate matrix factorization estimates matrix Rij as a product of low-rank matrix factors that are found by solving an optimization problem, which maximizes some quality of approximation. A tri-factor decomposition, which we use in this study, decomposes Rij into a product of three low-dimensional matrix factors such that (Fig. 3).
Fig. 3.
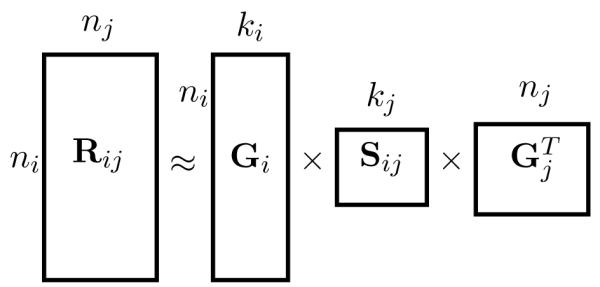
Matrix tri-factorization. Matrix relates objects of two types, i and j. For instance, we might relate genes to their expression profiles, publications to assigned MeSH terms or genes to themselves if they interact genetically. Rij is decomposed into a product of three matrix factors such that , where , and , ki ≪, ni, kj ≪ nj.
For data fusion we use simultaneous penalized tri-factorization to simultaneously decompose all blocks Rij while considering constraints in Θi(t) for t = 1, 2, … ti. The block matrix R from Eq. (1) is tri-factorized into block matrices S and G:
| (3) |
Yeast data matrix in Eq. (2) is similarly decomposed into block matrix factors S and G, each having 3 × 3 block-shape but we omit them here for brevity. Such factorization of block-based representation retains the block structure of our systems from Eq. (1) and Eq. (2). Matrix factors Sij in the resulting factorized system are specific to every data source and factors Gi are specific to every object type. Factor Gi is present in decompositions of all relation matrices that relate objects of type i to objects of some other type, whereas Sij is used only for decomposing Rij. Thus, they capture object type- and source-specific patterns, respectively. Sharing matrix factors between decompositions with common object type is the key idea of our data fusion approach.
The objective function minimized by simultaneous penalized matrix tri-factorization ensures good approximation of the input data and adherence to constraints, which are represented in constraint matrices:
| (4) |
where ∥·∥ and tr(·) denote the Frobenius norm and trace, respectively. Updating rules for decomposing relation matrices,1 iteratively improve matrix factors G and S, which converge to a local minimum of the optimization problem in Eq. (4). The algorithm first initializes factors Gi and then successively updates G and S until stopping criteria is met. See Žitnik et al. (2013)1 for details about initialization algorithm, updating rules and stopping criteria.
3.4. Predicting Gene Functions from Matrix Factors
Our target R12 is a partially observed [0, 1]-matrix, where 1 indicates that gene is assigned the corresponding function and 0 that it is not. We complete it as: . When the fused model is requested to propose relations for a new gene g that was not included in the training data, we need to estimate its factorized representation and use the resulting factors for prediction. We formulate non-negative linear least-squares and solve them for , where is the original description of gene g in i-th data source and is its factorized representation. Here, i varies from 2 to the number of data sources used for fusion. A solution vector given by is added as a new row to G1 and new is computed.
We then identify gene-function pairs (g, f*) for which the predicted degree of relation is unusually high. Candidate functions for gene g have greater estimated association score than the mean estimated score of all known annotations of gene g:
| (5) |
where contains functions annotated to g. Eq. (5) is a gene-centric rule. Given a test gene, it identifies functional terms to which it might be assigned. If the gene does not have any known annotations we use the function-centric rule to identify gene-function candidate pairs.
3.5. Assessing Strength of Predictions
We combine the gene- and function-centric rules such that, if possible, the gene-centric rule is applied to identify gene-function candidate pairs and then the function-centric rule is used to assess the strength of the candidate pair (g, f*). We estimate the strength of association of gene g to function f* by reporting an inverse percentile of association score in the distribution of scores for all true annotations to function f*, that is, by considering the scores in the f*-th column of (Fig. 4). Higher value indicates higher confidence of prediction.
Fig. 4.

An example of estimating strength of candidate slime mold genes for “phagocytosis” term. Association scores from for all genes that are annotated with term “phagocytosis” are shown in grey. Strength of the candidate pair (pikA, “phagocytosis”), s = 0.96, is assessed by reporting its inverse percentile in the distribution of scores for true annotations (in grey). That is, the percentage of estimated association scores that are smaller or equal to the score of (pikA, “phagocytosis”).
4. Performance Evaluation
We estimated the performance by ten-fold cross-validation. In each fold, we split the gene set to a train and test set. The data on genes from the test set were entirely omitted from the training data. We developed prediction models from the training data and tested them on the genes from the test set. The performance was evaluated using an F1 score, a harmonic mean of precision and recall, which was averaged across cross-validation runs. We selected the parameters of our data fusion algorithm, factorization ranks for each type of objects (ki), by observing the quality of in internal cross-validation.1 The parameters for kernel-based fusion, such as width of an RBF kernel and regularization weight, were also selected through internal cross-validation.
5. Kernel-Based Fusion Setup
We compared our data fusion algorithm to state-of-the-art integration by multiple kernel learning (MKL; Yu et al. (2010)19) that follows a multi-label classification approach. Kernel-based fusion used a multi-class L2 norm MKL with Vapnik’s SVM. The MKL was formulated as a second order cone program and solved using the conic optimization solver SeDuMif. We generated the kernel matrices for yeast experiments using the kernels proposed by Lanckriet et al. (2004).18 In slime mold study, we applied an RBF kernel to gene expression measurements and three linear kernels to protein interactions, genes that participate in KEGG pathways and to associations of genes to PMIDs. Data sources that describe relations between object types other than genes had to be transformed to explicitly relate them to genes. We represented the hierarchical structure of MeSH descriptors, semantic structure of the GO graph and KEGG ortholog groups as separate weighted graphs on genes (for instance, we counted common KEGG ortholog groups and calculated the similarities of sets of GO terms associated with genes) and constructed kernel matrices using diffusion kernel.
6. Results and Discussion
We evaluated our algorithm from the perspective of genes and functional terms. Thus, we addressed two related questions: “What is the function of a particular gene or protein?” and “What are the genes or proteins associated with a particular functional term?”.
6.1. Performance on Groups of Target Genes
We divided the D. discoideum gene set into three categories to compare predictive performance in each category. In Table 1 we present the cross-validated F1 scores when selecting the 100 or 1000 most GO-annotated genes and the accuracy obtained when considering whole slime mold genome. The task was to provide a set of terms from the slim subset of GO terms for every gene. We used the slim subset of GO terms to limit the optimization complexity of the kernel-based approach18 with which we compare our performance. These categories were selected to study the effects of data sparseness. Genes with many GO annotations tend to be better characterized and more data is available about them. Thus, functional terms of such genes would be considered easier to predict than those of genes with only few annotations. The accuracy of our matrix factorization-based data fusion is comparable to that of kernel-based approach. The performance of both approaches improved when we included more genes and hence more data. Also, our approach performed well when we added genes with sparser profiles although that increased the overall data sparsity.
Table 1.
Cross-validated F1 scores for fusion by matrix factorization (MF) and kernel-based method (MKL).
| Slime mold task | MF | MKL |
|---|---|---|
| 100 genes | 0.799 | 0.781 |
| 1000 genes | 0.826 | 0.787 |
| Whole genome | 0.831 | 0.800 |
6.2. Performance on Functional Terms
We assessed the ability of our approach to predict individual GO terms when fusing whole genome data from Fig. 2a. Table 2 shows the F1 scores for nine selected GO terms that belong to “Biological Process” and “Molecular Function” categories from GO and which contain variable number of annotated genes. These GO terms are of high relevance in Dictyostelium community and were selected upon consultations. Predictions were examined in the context of a complete set of GO terms rather than using a generic slim subset of terms. The resulting data set had ~2000 GO terms, each had on average 9.64 direct gene annotations.
Table 2.
Gene ontology term-specific cross-validated F1 scores for fusion by matrix factorization (MF) and kernel-based method (MKL). Terms in Gene ontology belong to one of three categories, “Biological Process” (BP), “Molecular Function” (MFn) or “Cellular Component”.
| GO term name | Term identifier | Namespace | Size | MF | MKL |
|---|---|---|---|---|---|
| Activation of adenylate cyclase activity | 0007190 | BP | 11 | 0.834 | 0.770 |
| Chemotaxis | 0006935 | BP | 58 | 0.981 | 0.794 |
| Chemotaxis to cAM | 0043327 | BP | 21 | 0.922 | 0.835 |
| Phagocytosis | 0006909 | BP | 33 | 0.956 | 0.892 |
| Response to bacterium | 0009617 | BP | 51 | 0.899 | 0.788 |
| Cell-cell adhesion | 0016337 | BP | 14 | 0.883 | 0.867 |
| Actin binding | 0003779 | MFn | 43 | 0.676 | 0.664 |
| Lysozyme activity | 0003796 | MFn | 4 | 0.782 | 0.774 |
| Sequence-specific DNA binding TFA | 0003700 | MFn | 79 | 0.956 | 0.894 |
Our approach achieved consistently higher accuracy than the kernel-based approach. With the exception of “actin binding” and “lysozyme activity” terms, F1 scores are rather high. We also found that prediction of less specific terms such as “chemotaxis” and “response to bacterium” showed high performance. That was not expected because genes annotated with less specific terms tend to have their profiles in data sets less similar. High performance is important as all nine gene functions and processes are of interest in the current research of D. discoideum where data fusion may propose new candidate genes for down-stream experimental studies.
6.3. Ribosomal and Membrane Protein Classification
Table 3 shows the results of training a factorization-based fusion model and a kernel-based method to recognize membrane and cytoplasmic ribosomal proteins in yeast. Our approach yielded better accuracy than kernel-based method on the membrane proteins but worse on the cytoplasmic ribosomal class. However, fused data sources were those whose kernels gave best individual performance in kernel learning.18 Thus, the selection of data sources was biased toward kernel-based method. The approach using factorization circumvents tedious work of transforming different objects (e.g., strings, vectors, graphs) into kernel matrices. These transformations depend on the choice of the kernels and may affect MKL’s performance.
Table 3.
Cross-validated F1 scores for yeast membrane and cytoplasmic ribosomal proteins using matrix factorization-based fusion (MF) and kernel-based method (MKL).
| Yeast recognition task | MF | MKL |
|---|---|---|
| Membrane proteins | 0.843 | 0.835 |
| Ribosomal proteins | 0.901 | 0.921 |
Results in this and previous sections suggest that factorization-based data fusion might be useful not only to identify proteins that share the same molecular function but also to recognize proteins that participate in the same biological processes or are located in the same subcellular region.
7. Conclusion
We have examined the applicability of our recently proposed matrix factorization-based data fusion approach1 on the problem of gene function prediction. We studied three fusion scenarios to demonstrate high accuracy of our approach when learning from disparate, incomplete and noisy data. The studies were successfully carried out for two different organisms, where, for example, the protein-protein interaction network for yeast is nearly complete but it is noisy, whereas the sets of available interactions for slime mold are rather sparse and only about one-tenth of its genes have experimentally derived annotations.
Our approach can model any number of data sources that can be expressed in a matrix, and, unlike most current data fusion approaches, does not require transformation of data into gene-function space. This flexibility allows us to fuse the data derived from possibly very diverse data sources without substantial preprocessing and loss of information. Described method is applicable to problems such as prediction of regulatory, metabolic and other functional classes, prediction of protein subcellular location and their interactions.
Acknowledgements
We thank Gad Shaulsky from Baylor College of Medicine, Houston, TX, for selecting functional terms from Table 2. This work was supported by the Slovenian Research Agency (P2-0209, J2-9699, L2-1112), National Institute of Health (P01-HD39691) and European Commission (Health-F5-2010-242038).
Footnotes
Contributor Information
MARINKA ŽITNIK, Faculty of Computer and Information Science, University of Ljubljana, Tržaška 25, SI-1000, Slovenia, marinka.zitnik@fri.uni-lj.si.
BLAŽ ZUPAN, Faculty of Computer and Information Science, University of Ljubljana, Tržaška 25, SI-1000, Slovenia; Department of Molecular and Human Genetics, Baylor College of Medicine, Houston, TX-77030, USA, blaz.zupan@fri.uni-lj.si.
References
- 1.Žitnik M, Zupan B. 2013 (submitted) Available at Arxiv:1307.0803. [Google Scholar]
- 2.Žitnik M, Zupan B. Matrix factorization-based data fusion for drug-induced liver injury prediction; Proc. of the 12th Annual International Conference on Critical Assessment of Massive Data Analysis (CAMDA); ISMB/ECCB. 2013. [Google Scholar]
- 3.Chen Y, Xu D. Nucleic Acids Research. 2004;32:6414. doi: 10.1093/nar/gkh978. [DOI] [PMC free article] [PubMed] [Google Scholar]
- 4.Wu H, Su Z, Mao F, Olman V, Xu Y. Nucleic Acids Research. 2005;33:2822. doi: 10.1093/nar/gki573. [DOI] [PMC free article] [PubMed] [Google Scholar]
- 5.Mostafavi S, Morris Q. Proteomics. 2012;12:1687. doi: 10.1002/pmic.201100607. [DOI] [PubMed] [Google Scholar]
- 6.Radivojac P, et al. Nature Methods. 2013;10:221. doi: 10.1038/nmeth.2340. [DOI] [PMC free article] [PubMed] [Google Scholar]
- 7.Ashburner M, Ball CA, Blake JA, Botstein D, Butler H, Cherry JM, Davis AP, Dolinski K, Dwight SS, Eppig JT, et al. Nature Genetics. 2000;25:25. doi: 10.1038/75556. [DOI] [PMC free article] [PubMed] [Google Scholar]
- 8.Falda M, Toppo S, Pescarolo A, Lavezzo E, Di Camillo B, Facchinetti A, Cilia E, Velasco R, Fontana P. BMC Bioinformatics. 2012;13(Suppl 4):S14. doi: 10.1186/1471-2105-13-S4-S14. [DOI] [PMC free article] [PubMed] [Google Scholar]
- 9.Vinayagam A, König R, Moormann J, Schubert F, Eils R, Glatting K-H, Suhai S. BMC Bioinformatics. 2004;5:116. doi: 10.1186/1471-2105-5-116. [DOI] [PMC free article] [PubMed] [Google Scholar]
- 10.Barutcuoglu Z, Schapire RE, Troyanskaya OG. Bioinformatics. 2006;22:830. doi: 10.1093/bioinformatics/btk048. [DOI] [PubMed] [Google Scholar]
- 11.Yan H, Venkatesan K, Beaver JE, Klitgord N, Yildirim MA, Hao T, Hill DE, Cusick ME, Perrimon N, Roth FP, Vidal M. PLoS One. 2010;5:e12139. doi: 10.1371/journal.pone.0012139. [DOI] [PMC free article] [PubMed] [Google Scholar]
- 12.Jung J, Yi G, Sukno S, Thon M. BMC Bioinformatics. 2010;11:215. doi: 10.1186/1471-2105-11-215. [DOI] [PMC free article] [PubMed] [Google Scholar]
- 13.Mitsakakis N, Razak Z, Escobar M, Westwood JT. BioData Mining. 2013;6:8. doi: 10.1186/1756-0381-6-8. [DOI] [PMC free article] [PubMed] [Google Scholar]
- 14.Saraç ÖS, Atalay V, Cetin-Atalay R. PLoS One. 2010;5:e12382. doi: 10.1371/journal.pone.0012382. [DOI] [PMC free article] [PubMed] [Google Scholar]
- 15.Troyanskaya OG, Dolinski K, Owen AB, Altman RB, Botstein D. Proceedings of the National Academy of Sciences. 2003;100:8348. doi: 10.1073/pnas.0832373100. [DOI] [PMC free article] [PubMed] [Google Scholar]
- 16.Mostafavi S, Ray D, Warde-Farley D, Grouios C, Morris Q. Genome Biology. 2008;9:S4. doi: 10.1186/gb-2008-9-s1-s4. [DOI] [PMC free article] [PubMed] [Google Scholar]
- 17.Mostafavi S, Morris Q. Bioinformatics. 2010;26:1759. doi: 10.1093/bioinformatics/btq262. [DOI] [PMC free article] [PubMed] [Google Scholar]
- 18.Lanckriet GR, De Bie T, Cristianini N, Jordan MI, Noble WS. Bioinformatics. 2004;20:2626. doi: 10.1093/bioinformatics/bth294. [DOI] [PubMed] [Google Scholar]
- 19.Yu S, Falck T, Daemen A, Tranchevent L-C, Suykens JA, De Moor B, Moreau Y. BMC Bioinformatics. 2010;11:309. doi: 10.1186/1471-2105-11-309. [DOI] [PMC free article] [PubMed] [Google Scholar]
- 20.Peña-Castillo L, Tasan M, Myers CL, Lee H, Joshi T, Zhang C, Guan Y, Leone M, Pagnani A, Kim WK, et al. Genome Biology. 2008;9:S2. doi: 10.1186/gb-2008-9-s1-s2. [DOI] [PMC free article] [PubMed] [Google Scholar]
- 21.Clark WT, Radivojac P. Bioinformatics. 2013;29:i53. doi: 10.1093/bioinformatics/btt228. [DOI] [PMC free article] [PubMed] [Google Scholar]
- 22.Parikh A, Miranda ER, Katoh-Kurasawa M, Fuller D, Rot G, Zagar L, Curk T, Sucgang R, Chen R, Zupan B, Loomis WF, Kuspa A, Shaulsky G. Genome Biology. 2010;11:R35. doi: 10.1186/gb-2010-11-3-r35. [DOI] [PMC free article] [PubMed] [Google Scholar]