

Abstract
Objective:
Interferon-β (IFN-β) has been shown to reduce relapse rates in multiple sclerosis; however, the clinical response appears to vary among individuals. Can early MRI be used to identify those patients who have a poor response to treatment?
Methods:
A systematic review of studies examining differential treatment response and clinical endpoints in groups defined as responders or nonresponders to IFN-β was performed. Meta-analytic techniques were used to combine study results where appropriate.
Results:
Patients with MRI evidence of poor response to IFN-β treatment as defined by either ≥2 new hyperintense T2 lesions or new gadolinium-enhancing lesions had significantly increased risk of both future relapses and progression as defined by the Expanded Disability Status Scale. There appeared to be an increased risk of poor outcomes 16 years after treatment initiation in those with an initial poor response to treatment. Previous evidence has shown this not to be the case in placebo arms of clinical trials.
Conclusions:
For those patients starting IFN-β, early MRI, within 6 to 24 months after starting treatment, has the potential to provide important information when counseling patients about the likelihood of future treatment failure. This can inform treatment decisions before clinical relapses or disease progression.
Interferon-β (IFN-β) preparations are the mainstay of treatment for relapsing-remitting multiple sclerosis (MS). They reduce overall relapse rates by approximately 30%1–6 and delay progression to clinically definite MS (CDMS) in those with clinically isolated syndrome (CIS).7–9 Patients treated with IFN-β have a high probability of a reduction in the number of active T2 lesions on MRI; however, a minority of patients show an increase in T2 lesions.10,11 This implies the presence of 2 subgroups: a relatively large responder group and a smaller nonresponder group. In contrast to IFN-β, the data on glatiramer acetate are less clear. Identifying nonresponders early would enable therapy escalation before the development of fixed disability.
A problem when examining MRI as a surrogate for clinical outcomes is the lack of standardization across studies. To generalize results, both the timing of MRI and duration of follow-up must be standardized. Studies using MRI to examine efficacy vary in a number of ways: the MRI sequences, the definition of a poor response to IFN-β, the clinical outcome (Expanded Disability Status Scale [EDSS] score vs relapse rate), and the duration of follow-up.
To our knowledge, no attempt has been made to integrate the results of clinical trials of IFN-β preparations alone.1–9 A recent study examined the relationship between MRI and relapses, but this included a variety of treatments and only a single outcome measure.12 In this study, we examined the various MRI outcome measures that are relevant to routine clinical practice and whether these can predict patients at high risk of treatment failure.
METHODS
Search strategy.
On May 21, 2013, PubMed was searched using the terms “MRI AND interferon”; 1,560 results were obtained, of which the abstracts and/or articles were individually searched. Articles published between 2000 and 2013 were considered for inclusion. In addition, leaders in the field were asked whether they were aware of any suitable abstracts or other articles. Studies were considered if they included patients with either CIS or CDMS, treated patients with an IFN-β preparation(s), had a clearly defined protocol including interval MRI, and followed up patients for at least 18 months. Studies were then included if they separated patients receiving treatment into responders and nonresponders/poor responders, with clearly defined clinical outcome measures (such as relapse rate or sustained increase in EDSS score).
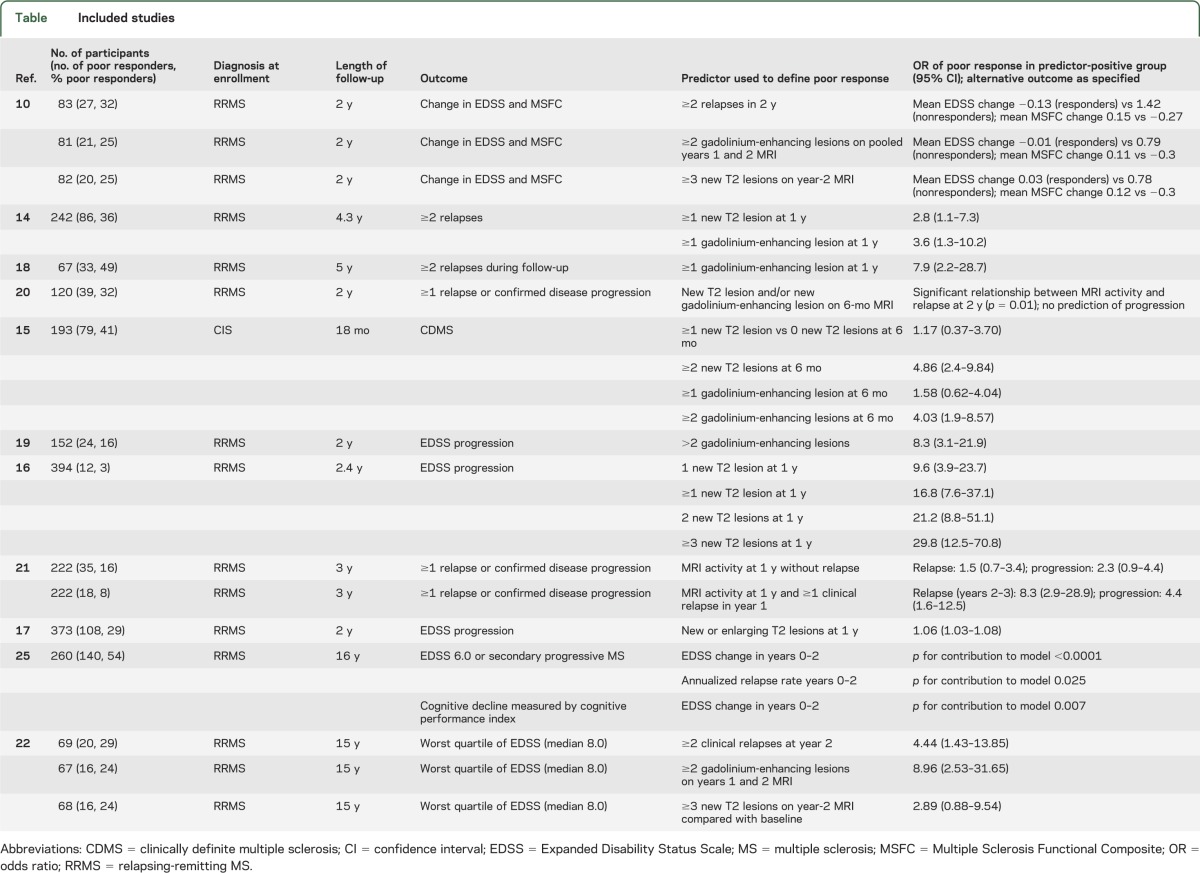
One study was excluded because it included patients who received azathioprine and/or corticosteroids in addition to Avonex.13 Several articles provided data on more than one MRI outcome,14–16 and in these cases, all outcomes were recorded. Details of included articles are in the table.
Table.
Included studies
Analysis.
Not all results were pooled because of the variation among studies; this is discussed in the results section. Where meta-analytic techniques were applied, RevMan 5.1 (Cochrane collaboration) was used. A generic inverse variance with random-effects model was used. Heterogeneity was assessed using I2. An overall odds ratio (OR) with 95% confidence interval (CI) was calculated for each MRI predictor examined mathematically. Analysis was performed separately for each MRI outcome measure examined.
RESULTS
MRI predictors of short-term clinical outcomes (<5 years).
Unenhanced scans.
Different studies used different numbers of new T2-weighted lesions as an outcome measure, and some studies gave information about more than one MRI parameter.
Four studies gave information about the outcome of patients with ≥1 T2-weighted MRI lesion.14–17 One examined the role of MRI in predicting conversion from CIS to CDMS.15 Patients with ≥1 new T2 lesion at 6 months did not have an increased risk of developing CDMS at 18 months (OR 1.17, 95% CI 0.37–3.70). The other 3 studies examined patients with CDMS. One examined the relationship between MRI activity and relapses.14 This demonstrated a significantly increased risk of those with ≥1 new T2 lesion at 1 year having at least 2 relapses during a mean follow-up of 4.3 years (OR 2.8, 95% CI 1.1–7.3).14
Both studies examining the relationship between ≥1 new T2 lesion on MRI at 1 year and EDSS progression at 2 years16,17 found a significantly increased OR of progression in those with new MRI lesions (table). When the results from these studies were combined using a meta-analytic approach, the overall effect was nonsignificant (OR 4.00, 95% CI 0.27–59.83) with high heterogeneity (I2 = 96%) reflecting the wide 95% CI in one of the studies16 and the marked difference between the results of the 2 studies (figure 1).
Figure 1. Pooled analysis of those with ≥1 new T2 lesion at 1 year.
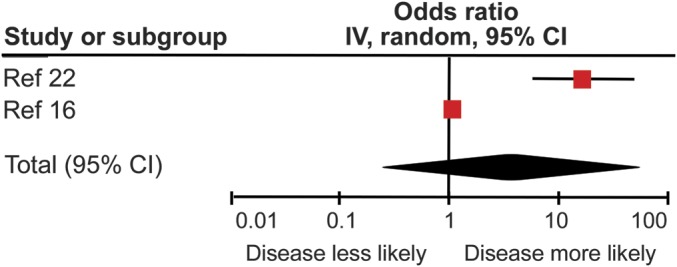
Pooled analysis of those studies examining the odds ratio of those with ≥1 new T2 lesion on MRI at 1 year demonstrating Expanded Disability Status Scale progression at 2 years. CI = confidence interval.
Two studies15,16 provided information about outcomes in patients with ≥2 new T2-weighted lesions on interval MRI. Although the MRI timings and clinical outcomes used were different (progression from CIS to MS with MRI at 6 months15 vs progression in EDSS of ≥1 point with MRI at 1 year16), they both demonstrated a significant OR of poor treatment response associated with MRI activity (ref. 15: OR 4.86, 95% CI 2.4–9.84; ref. 16: OR 21.2, 95% CI 8.8–51.1) (table). Given the difference in the outcome measures between these studies, the results were not combined.
Only one study provided information about the OR of poor treatment response in patients with ≥3 new T2-weighted lesions on a single scan; this gave an OR of EDSS progression of 29.8 (95% CI 12.5–70.8).16 In the single article in which patients were described as nonresponders on the basis of pooled years 1 and 2 MRI results (nonresponders defined as ≥3 new T2 lesions on pooled years 1 and 2 MRI),10 nonresponders had a significantly greater change in EDSS (mean EDSS change 0.78 vs 0.03, p = 0.05) and Multiple Sclerosis Functional Composite (MSFC) (−0.30 vs 0.12, p = 0.03) scores at 2 years.10
Gadolinium-enhanced scans.
Three studies14,15,18 provided data on the outcome of patients with ≥1 gadolinium-enhancing lesion. One used the progression from CIS to CDMS in 18 months to define a poor outcome15; those patients with ≥1 gadolinium-enhancing lesion on MRI at 6 months did not have a significantly increased risk of CDMS (OR 1.58, 95% CI 0.62–4.04).15 The remaining 2 studies examined the relationship between the presence of ≥1 gadolinium-enhancing lesion on MRI at 1 year and ≥2 relapses during a follow-up period of either 4.314 or 518 years. Both of these studies demonstrated a significantly increased OR of having relapses in the active MRI group (ref. 14: OR 3.6, 95% CI 1.3–10.2; ref. 18: OR 7.9, 95% CI 2.2–28.7). When these results were combined, this gave an overall OR of 5.10 (95% CI 1.98–13.14, p = 0.0007) with no between-study heterogeneity (I2 = 0%) (figure 2).
Figure 2. Pooled analysis of those with ≥1 gadolinium-enhancing lesion.
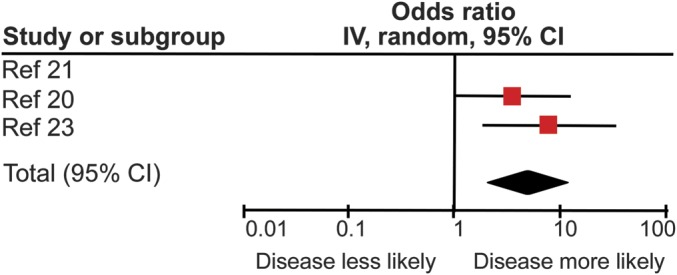
Pooled analysis of those studies examining the odds ratio of those with ≥1 gadolinium-enhancing lesion demonstrating ≥2 relapses in 5 years. CI = confidence interval.
Two studies15,19 provided data on the outcome of patients with ≥2 gadolinium-enhancing lesions on MRI. One study15 examined progression from CIS to CDMS, whereas the other used EDSS increase of ≥1 point.19 There was a markedly increased risk of either CDMS at 18 months (OR 4.03, 95% CI 1.9–8.57) or EDSS progression at 2 years (OR 8.3, 95% CI 3.1–21.9) in the nonresponder group. Because of the difference in both the clinical populations studied and the outcome measures used, these results were not combined. In a further study, when patients were described as nonresponders on the basis of pooled years 1 and 2 MRI scan results (nonresponders defined as ≥2 gadolinium-enhancing lesions on pooled years 1 and 2 scan results),10 nonresponders had a significant increase in EDSS score at 2 years (mean 0.79 vs 0.01, p = 0.07), as well as a significant reduction in MSFC score (−0.30 vs 0.11, p = 0.04).10
Combined T2 and gadolinium-enhanced lesions.
Two studies combined both MRI measures of disease activity into a single measure of nonresponse.20,21 One study20 demonstrated a significant relationship between ≥1 new T2 lesion and/or ≥1 gadolinium-enhancing lesion at 6 months, and ≥1 relapse (p = 0.01) but not progression (increase in EDSS of ≥1 point sustained for 6 months) (p = 0.5) at 2 years.20 The second study21 demonstrated that the presence of either new/enlarging T2 lesions and/or new gadolinium-enhancing lesions at 12 months in the absence of clinical disease activity (i.e., no relapses or evidence of progressive disability) was not associated with relapses (OR 1.5, 95% CI 0.7–3.4, p = 0.3) or progression (defined as above) (OR 2.3, 95% CI 0.9–4.4) at 3 years.21 However, when relapses at 12 months were added as an additional predictor, there was a significant increase in the risk of both future relapses (OR 8.3, 95% CI 2.9–28.9, p < 0.0001) and progression (OR 4.4, 95% CI 1.6–12.5, p = 0.004).21
MRI predictors of longer-term clinical outcomes (>5 years).
Long-term follow-up outcomes of patients from the pivotal IFN-β trials have recently become available. A single analysis attempts to define patients as responders or nonresponders before examining long-term outcomes according to this paradigm.22 By defining early MRI disease activity as either ≥3 new T2 lesions or ≥2 gadolinium-enhancing lesions on pooled years 1 and 2 MRI, early MRI disease activity can predict longer-term outcomes for those receiving IFN-β.22 While patients with new T2 lesions did not have a significantly increased OR of being in the worst quartile of EDSS (median EDSS score 8.0) at 15 years (OR 2.89, 95% CI 0.88–9.54, p = 0.080), those with gadolinium-enhancing lesions did (OR 8.96, 95% CI 2.53–31.65, p < 0.001).22
Clinical predictors of clinical outcomes.
There are relatively few publications using clinical criteria to define a nonresponder group on IFN-β and then examining longer-term outcomes, despite the fact that this has been investigated in untreated natural history cohorts.23 Similarly, long-term outcomes in IFN-β–treated cohorts have been compared with untreated patients, but without detailed study of on-treatment predictors of outcome.24
One study, examining relatively short-term outcomes at 2 years, used the number of relapses in years 1 and 2 to define a nonresponder group.10 Those with ≥2 relapses in 2 years demonstrated greater change in both EDSS (1.02 vs −0.13, p < 0.01) and MSFC (−0.27 vs 0.15, p = 0.01) at 2-year follow-up.10 Similarly, patients with MRI activity and relapses at 12 months have a significantly increased chance of further relapses and progression at 3 years21; however, analysis of all patients with relapses regardless of MRI status was not performed.
One study examined the clinical outcomes at 15 years according to the early clinical outcome of those receiving IFN-β.22 Patients with ≥2 relapses in the first 2 years of treatment had significantly increased odds of being in the worst EDSS quartile at 15-year follow-up (OR 4.44, 95% CI 1.43–13.85, p = 0.010). A further study examining 16-year outcomes from an original IFN-β trial demonstrated that on-study (i.e., years 0–2) actual EDSS change (p < 0.0001) and relapse rate (p = 0.025) were associated with poor outcome at 16 years in a logistic regression model (poor outcome defined as EDSS score 6.0 or development of secondary progressive MS).25 However, it must be noted that relapse rate did not predict long-term cognitive outcome, but actual EDSS change did (p = 0.007 in a linear regression model).25
DISCUSSION
The overall message from these data is clear: early MRI activity appears to predict worse later outcomes in those receiving IFN-β. The ability of early MRI changes to predict later clinical outcomes appears to increase with the number of new T2 lesions and the presence of gadolinium enhancement. In addition to the relevance of these changes to disease activity, rater accuracy may also have a role in these findings. Accuracy improves significantly when looking for gadolinium-enhancing lesions rather than new T2 lesions26; when compared with image analysis software, concordance correlation was high (0.8–0.96) for gadolinium-enhancing lesions, intermediate (0.6–0.8) for new T2 lesions, and very poor (0.0–0.14) for enlarging lesions.26
A further possible explanation for the improved predictive power of gadolinium-enhanced lesions compared with new T2 lesions is that new T2 lesions could develop in the period between baseline MRI and the commencement of IFN-β therapy (and indeed the period in which it becomes effective), whereas new lesions that enhance after gadolinium administration must have developed in a relatively short time period before the on-treatment MRI was performed. Thus, new T2 lesions do not solely represent disease activity on IFN-β, potentially diluting the predictive power of this MRI outcome. It may be that for those patients who demonstrate new T2 lesions on MRI at 6 months, a second on-treatment MRI performed at 12 months to examine for new T2 lesions that are certain to have developed on treatment would be of benefit to improve the diagnostic certainty regarding nonresponders and thus prevent patients from discontinuing IFN-β needlessly.
Overall, 24.1% (range 3.0%–49.3%) of the patients were defined as poor responders or nonresponders according to the definitions used within each article. While there is a considerable degree of heterogeneity within the definitions used, as discussed above, the fact remains that approximately a quarter of patients receiving IFN-β are destined to experience ongoing disease activity in the first 2 years.
Why some patients fail to respond to IFN-β treatment is poorly understood. To date, there are no biomarkers that can predict treatment response in individual patients,27 although promising results have been reported regarding gene transcription profiles in peripheral blood.28 It was recently shown that combining lesions seen on MRI at 1 year and relapses at 1 year was able to fully predict EDSS worsening at 2 years.17
Neutralizing antibodies (NAbs) are likely to only account for a minority of poor responders.29 First, NAbs tend to develop after 12 to 18 months of treatment with IFN-β22; thus, it is difficult to correlate their presence with early (i.e., after 6 months) changes on MRI. A recent study investigating long-term outcomes in patients receiving IFN-β was unable to demonstrate a relationship between the presence of NAbs and lesion formation at 2 years.22,27 Similarly, when molecular markers of IFN-β response were examined,27 none of the 15 of 85 patients who were categorized as poor responders on the basis of ≥3 new lesions at 6 months had NAbs. Indeed, in this study, the single patient who developed NAbs in the first 6 months of treatment did not develop any new lesions on MRI in this time.27
There appears to be a significant difference between those receiving IFN-β and those receiving placebo. The relationship between MRI lesions and longer-term outcome seems stronger for patients receiving IFN-β than for placebo patients. In patients on placebo arms of clinical trials, a relationship between both early gadolinium-enhancing lesions (OR 1.79, 95% CI 0.62–5.16, p = 0.284) and early relapses (OR 1.53, 95% CI 0.56–4.19, p = 0.408) and poor disability outcomes at 15 years was not observed.22 This was also observed in studies with shorter follow-up,10 where differences in clinical outcomes between responder and nonresponder groups were significant in the IFN-β, but not the placebo, arm.
We do not have a definite explanation for this observation, which suggests that poor outcome for patients with new lesions while receiving IFN-β treatment is interferon-dependent. Why might this be? One possibility is that there is variability in immune pathogenesis within a clinical trial population and that IFN-β treatment identifies a subgroup with different pathogenic mechanisms. Further research is required to explore this possibility. The placebo-controlled study results suggest, however, that poor outcome is not attributable solely to the general predictive value of MRI lesions.27
MRI is a readily available investigative tool for most neurologists and has a role in informing individual treatment decisions. This study suggests that those who develop new MRI lesions on IFN-β within 2 years of starting therapy are at significantly higher risk of future relapses and/or EDSS worsening. The converse of this is that the treatment benefit conferred by IFN-β is concentrated in those without MRI evidence of active disease. Our analyses indicate that these patients can be identified after just 6 to 12 months of treatment. As the available treatment repertoire increases, our decision-making processes become more complex, and predictive information such as new MRI lesions have to be considered.
As a practical conclusion from the evidence presented above, we suggest that patients with MS who are receiving IFN-β treatment should have a follow-up MRI 6 to 12 months into their treatment. Patients who are poor responders on the basis of their MRI could then either be switched to a different first-line therapy, or escalated to second-line treatment. However, at the present time, the regulatory authorities in certain regions do not support the initiation of second-line disease-modifying therapies on the basis of radiologic treatment failure alone. The best treatment strategy for patients with ongoing disease activity despite IFN-β is not clear because both aggressive disease and poor response to IFN-β may be responsible. With increasing evidence, it may be that radiologic outcomes are used in the future to define “disease activity free” status, rather than waiting for clinical relapses.
GLOSSARY
- CDMS
clinically definite multiple sclerosis
- CI
confidence interval
- CIS
clinically isolated syndrome
- EDSS
Expanded Disability Status Scale
- IFN-β
interferon-β
- MS
multiple sclerosis
- MSFC
Multiple Sclerosis Functional Composite
- NAb
neutralizing antibody
- OR
odds ratio
AUTHOR CONTRIBUTIONS
R.D., R.R., and G.G. conceived the idea of this work. R.D. and R.R. performed the literature search with input from all other authors. R.D. performed the mathematical analysis and produced the first draft of the manuscript. All authors provided important input into the final manuscript.
STUDY FUNDING
This work received no specific funding. Dr. Dobson is funded by an Association of British Neurologists/MS Society of Great Britain Clinical Research Fellowship. Prof. Giovannoni receives grant support from the MRC, National MS Society, MS Society of Great Britain and Northern Ireland, AIMS2CURE, and the Roan Charitable Trust. Dr. Schmierer is supported by a HEFCE Clinical Senior Lectureship and receives grant support from Barts and The London Charity and Novartis.
DISCLOSURE
R. Dobson reports no disclosures. R. Rudick has received consulting or speaking fees in the last 3 years from Biogen Idec, Genzyme, Novartis, and Pfizer/Wyeth. B. Turner reports no disclosures. K. Schmierer received research support from Biogen Idec to perform the MRI analysis of the phase 2b trial of BG-12. He has received honoraria for speaking from Merck Serono, Novartis, and Sanofi-Aventis. G. Giovannoni has received research grant support from Bayer-Schering Healthcare, Biogen Idec, GW Pharma, Merck Serono, Merz, Novartis, Teva, and Sanofi-Aventis. G.G. has received personal compensation for participating on advisory boards in relation to clinical trial design, trial steering committees, and data and safety monitoring committees from Bayer-Schering Healthcare, Biogen Idec, Eisai, Elan, Fiveprime, Genzyme, Genentech, GSK, Ironwood, Merck Serono, Novartis, Pfizer, Roche, Sanofi-Aventis, Synthon BV, Teva, UCB Pharma, and Vertex Pharmaceutic. Go to Neurology.org for full disclosures.
REFERENCES
- 1.PRISMS Study Group and the University of British Columbia MS/MRI Analysis Group PRISMS-4: long-term efficacy of interferon-beta-1a in relapsing MS. Neurology 2001;56:1628–1636 [DOI] [PubMed] [Google Scholar]
- 2.The IFNB Multiple Sclerosis Study Group Interferon beta-1b is effective in relapsing-remitting multiple sclerosis: I: clinical results of a multicenter, randomized, double-blind, placebo-controlled trial. Neurology 1993;43:655–661 [DOI] [PubMed] [Google Scholar]
- 3.Jacobs LD, Cookfair DL, Rudick RA, et al. Intramuscular interferon beta-1a for disease progression in relapsing multiple sclerosis. The Multiple Sclerosis Collaborative Research Group (MSCRG). Ann Neurol 1996;39:285–294 [DOI] [PubMed] [Google Scholar]
- 4.Kappos L, Freedman MS, Polman CH, et al. Long-term effect of early treatment with interferon beta-1b after a first clinical event suggestive of multiple sclerosis: 5-year active treatment extension of the phase 3 BENEFIT trial. Lancet Neurol 2009;8:987–997 [DOI] [PubMed] [Google Scholar]
- 5.O'Connor P, Filippi M, Arnason B, et al. 250 microg or 500 microg interferon beta-1b versus 20 mg glatiramer acetate in relapsing-remitting multiple sclerosis: a prospective, randomised, multicentre study. Lancet Neurol 2009;8:889–897 [DOI] [PubMed] [Google Scholar]
- 6.Durelli L, Verdun E, Barbero P, et al. Every-other-day interferon beta-1b versus once-weekly interferon beta-1a for multiple sclerosis: results of a 2-year prospective randomised multicentre study (INCOMIN). Lancet 2002;359:1453–1460 [DOI] [PubMed] [Google Scholar]
- 7.Jacobs LD, Beck RW, Simon JH, et al. Intramuscular interferon beta-1a therapy initiated during a first demyelinating event in multiple sclerosis. CHAMPS Study Group. N Engl J Med 2000;343:898–904 [DOI] [PubMed] [Google Scholar]
- 8.Kappos L, Polman CH, Freedman MS, et al. Treatment with interferon beta-1b delays conversion to clinically definite and McDonald MS in patients with clinically isolated syndromes. Neurology 2006;67:1242–1249 [DOI] [PubMed] [Google Scholar]
- 9.Comi G, Filippi M, Barkhof F, et al. Effect of early interferon treatment on conversion to definite multiple sclerosis: a randomised study. Lancet 2001;357:1576–1582 [DOI] [PubMed] [Google Scholar]
- 10.Rudick RA, Lee JC, Simon J, Ransohoff RM, Fisher E. Defining interferon beta response status in multiple sclerosis patients. Ann Neurol 2004;56:548–555 [DOI] [PubMed] [Google Scholar]
- 11.Sormani MP, Bruzzi P, Beckmann K, et al. The distribution of magnetic resonance imaging response to interferonbeta-1b in multiple sclerosis. J Neurol 2005;252:1455–1458 [DOI] [PubMed] [Google Scholar]
- 12.Sormani MP, Bruzzi P. MRI lesions as a surrogate for relapses in multiple sclerosis: a meta-analysis of randomised trials. Lancet Neurol 2013;12:669–676 [DOI] [PubMed] [Google Scholar]
- 13.Horakova D, Kalincik T, Dolezal O, et al. Early predictors of non-response to interferon in multiple sclerosis. Acta Neurol Scand 2012;126:390–397 [DOI] [PubMed] [Google Scholar]
- 14.Pozzilli C, Prosperini L, Sbardella E, De Giglio L, Onesti E, Tomassini V. Post-marketing survey on clinical response to interferon beta in relapsing multiple sclerosis: the Roman experience. Neurol Sci 2005;26(suppl 4):S174–S178 [DOI] [PubMed] [Google Scholar]
- 15.Kinkel RP, Simon J, Carulli J, et al. Magnetic resonance imaging activity predicts multiple sclerosis patients’ response to treatment with interferon beta-1a (P76). Mult Scler 2008;14:S51.Abstract [Google Scholar]
- 16.Prosperini L, Gallo V, Petsas N, Borriello G, Pozzilli C. One-year MRI scan predicts clinical response to interferon beta in multiple sclerosis. Eur J Neurol 2009;16:1202–1209 [DOI] [PubMed] [Google Scholar]
- 17.Sormani MP, Li DK, Bruzzi P, et al. Combined MRI lesions and relapses as a surrogate for disability in multiple sclerosis. Neurology 2011;77:1684–1690 [DOI] [PubMed] [Google Scholar]
- 18.Tomassini V, Paolillo A, Russo P, et al. Predictors of long-term clinical response to interferon beta therapy in relapsing multiple sclerosis. J Neurol 2006;253:287–293 [DOI] [PubMed] [Google Scholar]
- 19.Rio J, Rovira A, Tintore M, et al. Relationship between MRI lesion activity and response to IFN-beta in relapsing-remitting multiple sclerosis patients. Mult Scler 2008;14:479–484 [DOI] [PubMed] [Google Scholar]
- 20.Durelli L, Barbero P, Bergui M, et al. MRI activity and neutralising antibody as predictors of response to interferon beta treatment in multiple sclerosis. J Neurol Neurosurg Psychiatry 2008;79:646–651 [DOI] [PubMed] [Google Scholar]
- 21.Rio J, Castillo J, Rovira A, et al. Measures in the first year of therapy predict the response to interferon beta in MS. Mult Scler 2009;15:848–853 [DOI] [PubMed] [Google Scholar]
- 22.Bermel RA, You X, Foulds P, et al. Predictors of long-term outcome in multiple sclerosis patients treated with interferon beta. Ann Neurol 2013;73:95–103 [DOI] [PubMed] [Google Scholar]
- 23.Scalfari A, Neuhaus A, Daumer M, Muraro PA, Ebers GC. Onset of secondary progressive phase and long-term evolution of multiple sclerosis. J Neurol Neurosurg Psychiatry Epub 2013 Mar 15 [DOI] [PubMed]
- 24.Shirani A, Zhao Y, Karim ME, et al. Association between use of interferon beta and progression of disability in patients with relapsing-remitting multiple sclerosis. JAMA 2012;308:247–256 [DOI] [PubMed] [Google Scholar]
- 25.Goodin DS, Traboulsee A, Knappertz V, et al. Relationship between early clinical characteristics and long term disability outcomes: 16 year cohort study (follow-up) of the pivotal interferon beta-1b trial in multiple sclerosis. J Neurol Neurosurg Psychiatry 2012;83:282–287 [DOI] [PubMed] [Google Scholar]
- 26.Erbayat-Altay E, Fisher E, Lee JC, Hara-Cleaver C, Jones S, Rudick RA. Reliability of classifying multiple sclerosis disease activity using magnetic resonance imaging in a clinic setting. Int J MS Care 2011;13:S113 Abstract [DOI] [PMC free article] [PubMed] [Google Scholar]
- 27.Rudick RA, Rani MR, Xu Y, et al. Excessive biologic response to IFNbeta is associated with poor treatment response in patients with multiple sclerosis. PLoS One 2011;6:e19262. [DOI] [PMC free article] [PubMed] [Google Scholar]
- 28.Hesse D, Sellebjerg F, Sorensen PS. Absence of MxA induction by interferon beta in patients with MS reflects complete loss of bioactivity. Neurology 2009;73:372–377 [DOI] [PubMed] [Google Scholar]
- 29.Sbardella E, Tomassini V, Gasperini C, et al. Neutralizing antibodies explain the poor clinical response to interferon beta in a small proportion of patients with multiple sclerosis: a retrospective study. BMC Neurol 2009;9:54. [DOI] [PMC free article] [PubMed] [Google Scholar]