

Abstract
Study Objectives:
To identify baseline behavioral and physiologic markers that associate with individual differences in sustained attention during sleep deprivation.
Design:
In a retrospective study, ocular, electrocardiogram, and electroencephalogram (EEG) measures were compared in subjects who were characterized as resilient (n = 15) or vulnerable (n = 15) to the effects of total sleep deprivation on sustained attention.
Setting:
Chronobiology and Sleep Laboratory, Duke-NUS Graduate Medical School Singapore.
Participants:
Healthy volunteers aged 22-32 years from the general population.
Interventions:
Subjects were kept awake for at least 26 hours under constant environmental conditions. Every 2 hours, sustained attention was assessed using a 10-minute psychomotor vigilance task (PVT).
Measurements and Results:
During baseline sleep and recovery sleep, EEG slow wave activity was similar in resilient versus vulnerable subjects, suggesting that individual differences in vulnerability to sleep loss were not related to differences in homeostatic sleep regulation. Rather, irrespective of time elapsed since wake, subjects who were vulnerable to sleep deprivation exhibited slower and more variable PVT response times, lower and more variable heart rate, and higher and more variable EEG spectral power in the theta frequency band (6.0-7.5 Hz).
Conclusions:
Performance decrements in sustained attention during sleep deprivation associate with instability in behavioral and physiologic measures at baseline. Small individual differences in sustained attention that are present at baseline are amplified during prolonged wakefulness, thus contributing to large between-subjects differences in performance and sleepiness.
Citation:
Chua EC; Yeo SC; Lee IT; Tan LC; Lau P; Cai S; Zhang X; Puvanendran K; Gooley JJ. Sustained attention performance during sleep deprivation associates with instability in behavior and physiologic measures at baseline. SLEEP 2014;37(1):27-39.
Keywords: Sleep deprivation, inter-individual differences, psychomotor vigilance, variability, instability
INTRODUCTION
One of the enduring questions in sleep research is why some people cope well with sleep loss, whereas others do not. During prolonged wakefulness, all individuals eventually show impaired cognitive function, but there are large differences between subjects in the magnitude of performance deficits. Individual differences in cognitive performance are stable over repeated exposures to total sleep deprivation, regardless of recent sleep history, indicating that vulnerability to sleep loss is trait-like.1 Similarly, individual differences in task-dependent brain activation assessed by functional magnetic resonance imaging (fMRI) are stable across multiple exposures to sleep deprivation,2 suggesting a neurobiological basis for between-subjects differences in performance.
During prolonged wakefulness, the homeostatic drive for sleep competes with effort to remain awake, resulting in impaired and/or unstable cognitive function.3 The buildup of sleep pressure is only dissipated by sleep itself, and the intensity or depth of sleep, as assessed by the amount of electroencephalogram (EEG) slow wave activity (SWA; 0.75-4.5 Hz) in NREM sleep,4 is trait-like and related to the duration of prior wakefulness.5 Polymorphic genes associated with individual differences in SWA during NREM sleep include adenosine deaminase (ADA),6 adenosine A2A receptor (ADORA2A),7 Period 3 (Per3),8 catechol-O-methyltransferase (COMT),9 human leukocyte antigen DQB1 (HLA-DQB1),10 and brain-derived neurotrophic factor (BDNF).11 While individual differences in cognitive performance during sleep deprivation could potentially be explained by genetically determined differences in the buildup or dissipation of sleep pressure, there is no consensus as to the usefulness of the aforementioned genes in predicting performance vulnerability to sleep loss in the general population.
Based on retrospective analyses, individuals who are phenotypically identified as resilient or vulnerable to sleep deprivation differ in their neural activation patterns not only during sleep deprivation, but also when they are rested.12–15 In studies using fMRI, individuals who show higher levels of task-dependent brain activation at baseline are more resilient to the effects of total sleep deprivation on cognitive performance, as compared to individuals with lower brain activation after normal sleep. These findings raise the possibility that differential vulnerability to sleep loss can be estimated by assessing brain activation patterns—or perhaps other physiologic signals—at baseline. Alternatively, decrements in performance during sustained wakefulness could potentially be estimated using behavioral data, as demonstrated by adaptive individual-specific performance models that rely on repeated testing over time to predict future performance.16,17 Based on these studies, we hypothesized that baseline physiologic and behavioral measures carry information about a person's relative vulnerability to subsequent sleep deprivation. The aim of our study was to identify retrospectively features of baseline neurobehavioral performance, and measures derived from the EEG and electrocardiogram (ECG), that associate reliably with individual differences in sustained attention during sleep deprivation. Herein, we describe substantial baseline individual differences in psychomotor vigilance task (PVT) performance, heart rate and its variability, and EEG theta activity in subjects from the general population who were characterized as resilient or vulnerable to the effects of total sleep deprivation on sustained attention.
MATERIALS AND METHODS
Subjects
Healthy ethnic Chinese subjects (n = 45; 42 males) aged 22-32 years were enrolled in a laboratory study at the Chronobiology and Sleep Laboratory (CSL), Duke-NUS Graduate Medical School Singapore. Health was assessed using screening questionnaires and self-reported medical history, and participants reported no use of medications or nicotine products. Individuals with an extreme chronotype (< 31 or > 69 on the Horne-Östberg Morningness-Eveningness questionnaire [MEQ]),18 or score > 5 on the Pittsburgh Sleep Quality Index (PSQI)19 were excluded. One participant with a PSQI score of 6 was enrolled; this was due to a scoring error that was discovered after the study was completed. Subjects were ineligible if they had a history of shift work or if they travelled across time zones within 3 weeks prior to the start of the study. In the week before the laboratory study, participants were required to maintain a fixed daily sleep-wake schedule (8 h time in bed for sleep at night), which was verified by actigraphy monitoring (Actiwatch-L or Actiwatch 2, Mini Mitter, Inc., Bend, OR). Actigraphy data from 3 subjects were not available for analysis due to technical problems with the Actiwatch device; these individuals were admitted to the study on the basis of their sleep-wake diaries. In the week prior to study, subjects were asked to avoid caffeine, alcohol, and over-the-counter medications. Informed consent was obtained from all participants, and research procedures were approved by the SingHealth Centralized Institutional Review Board. Procedures were compliant with the Health Insurance Portability and Accountability Act regulations and the Declaration of Helsinki.
Sleep Deprivation Procedures
In our retrospective analysis, we pooled available data from subjects (n = 45) who underwent sleep deprivation in our laboratory. Subjects lived individually in a windowless suite that was shielded from external time cues. Participants arrived in the evening and went to bed at their regular pre-study sleep time. After an 8-h sleep opportunity, subjects were kept awake for 26 h (Protocol 1; n = 9) or 40 h (Protocol 2; n = 36) using constant routine (CR) procedures. In both protocols, participants did not know the duration of time that they would be kept awake. The CR procedure, which is designed to minimize the effects of environmental stimuli on circadian rhythms, consisted of wakefulness enforced by research staff, semi-recumbent position in bed, dim ambient lighting (< 5 lux), and equicaloric snacks given every hour.20 Researchers were present at all times to carry out the protocol and to ensure subject compliance. During the CR procedure, light was provided by ceiling-mounted light-emitting diode lamps dimmed to < 5 lux (1.9 μW/cm2), measured at a height of 187 cm with the detector aimed at the brightest point in the room (ILT1400 portable radiometer; International Light Technologies, Inc., Peabody, MA).
Assessment of Self-Rated Sleepiness and Sustained Attention
Starting 2.5 h or 3.5 h after wake time, subjects rated their sleepiness every hour by completing the Karolinska Sleepiness Scale (KSS) and a visual analogue scale (VAS) for sleepiness. The KSS is a 9-point scale with responses ranging from “very alert (1)” to “very sleepy, great effort to keep awake, fighting sleep (9).”21 For the VAS, subjects rated their sleepiness by selecting a point on a line that was labeled with the word pair “sleepy” and “alert” at opposite ends.22 Every 2 h (starting 2.5 h or 4.5 h after wake time), participants completed a 10-min PVT, which is a reaction time test that assesses sustained visual attention. During the PVT, participants maintained their fastest possible reaction time (RT) to a simple visual stimulus presented at random inter-stimulus intervals (1-ms resolution) ranging from 2-10 seconds.23 PVT lapses were defined as RTs > 0.5 seconds.23 We stratified our pool of subjects (n = 45) into 3 groups based on the number of PVT lapses that occurred between 16.5-24.5 h after wake. The tertile with the fewest number of lapses (n = 15) was defined as resilient to the effects of total sleep deprivation on sustained attention, and the tertile with the highest number of lapses (n = 15) was defined as vulnerable. Using this stratification scheme, resilient and vulnerable groups both consisted of 2 subjects who completed Protocol 1 and 13 subjects who completed Protocol 2. The primary rationale for comparing top and bottom tertiles is that these groups show an unambiguous difference in their response to sleep deprivation, i.e., they have distinct pheno-types. This analysis approach was based on previous retrospective studies, in which subjects were stratified into tertiles based on their cognitive performance during a single session of sleep deprivation, followed by comparison of top and bottom groups when subjects were rested.12,13,15 Our approach was also based on prior work demonstrating large differences in PVT performance in groups stratified by tertiles.24
Physiologic Measurements
Polysomnography (PSG)
Polysomnographic recordings were performed during baseline sleep, the CR procedure, and recovery sleep. Electrodes were placed on the scalp according to the standard International 10-20 system of electrode placement. During sleep, the EEG was recorded from central (C3-A2, C4-A1) and occipital (O1-A2, O2-A1) derivations; the EOG was recorded from electrodes placed lateral to the outer canthus of each eye, slightly above (right eye) and below (left eye) the bi-canthal plane, and referenced to the contralateral mastoid electrode (A1 or A2); the EMG was recorded with electrodes placed on the chin and submentally; and the ECG was recorded with electrodes placed just below the clavicle on the right shoulder and below the fifth intercostal space at the anterior axillary line, i.e., using a modified lead V5 configuration. The waking EEG was recorded from the z-line using frontal (Fz), central (Cz), parietal (Pz), and occipital (Oz) derivations referenced to the mastoids (A1 and A2). Each derivation was averaged online to obtain a single mastoid-referenced channel. The waking EOG and ECG were recorded using the same procedures described for the sleep montage. All signals were bandpass-filtered online (EEG, EOG, and ECG at 0.3 to 35 Hz, EMG at 10 to 100 Hz), and recorded at 200 Hz using a Comet Portable EEG system (Astro-Med, Inc., West Warwick, RI). As described previously, the onset and offset of PVT testing was marked in the polysomnographic recording using an event marker, and signals were analyzed during the middle 8 min between marked events.25
Eyelid Closure Monitoring
To assess percentage eyelid closure over the pupil over time (PERCLOS), we performed infrared pupillography in a subset of individuals (n = 34), including 12 who were defined as resilient and 11 who were defined as vulnerable to the effects of sleep deprivation on PVT performance. During the PVT, pupil diameter of the left eye was recorded at 120 Hz using a head-mounted eye-tracker that was worn like a visor (ISCAN, Inc., Woburn, MA).
Core Body Temperature
During the CR procedure, core body temperature readings were collected every minute using an ingestible temperature sensor (Mini Mitter, Inc., Bend, OR) that transmitted data to a VitalSense Integrated Physiologic Monitor placed near the subject. Participants swallowed the transmitter just prior to the start of the baseline sleep opportunity, and were given a second transmitter during the CR procedure if the first sensor was passed in a bowel movement. Data from 1 resilient individual and 2 vulnerable individuals were lost due to equipment failure.
Data Analysis
Actigraphy
To assess sleep behavior in the week prior to the laboratory study, actigraphy data were collected on a per-minute basis and analyzed using Actiware 5 software (Mini Mitter, Inc.). Participants' sleep diaries were used to demarcate time-inbed for sleep in the actigraphy record. Within this rest period, activity counts were smoothed using a weighted average that takes into account activity before and after each epoch using the following formula: a(n)smoothed = 1/25*a(n-2) + 1/5*a(n-1) + a(n) + 1/5*a(n+1) + 1/25*a(n+2). Epochs were scored as wake when the smoothed activity count exceeded an individualized threshold, which was determined by dividing each person's total daily activity counts by mobile time and multiplying by 0.88888. Mobile epochs were defined as those in which the activity count was ≥ epoch length in 15-s intervals; hence for a 1-min epoch length, the threshold was 4 for scoring an epoch as mobile. Sleep onset was defined as the beginning of the first 5-min block of epochs with all but one epoch scored as immo-bile. Similarly, sleep offset was defined as the end of the last 5-min block of epochs with all but 1 epoch scored as immobile. Total sleep time (TST) was calculated as the total duration of scored sleep from sleep onset to sleep offset, and sleep efficiency (SE) was defined as TST divided by the duration of time-in-bed for sleep. Averaged TST and SE values were determined for each subject in the week prior to the laboratory study. In 2 participants, only 6 days of actigraphy data were available for estimating TST and SE.
Sleep Staging and EEG Spectral Analysis
PSG recordings were converted to European Data Format and outsourced to The Siesta Group for sleep staging (The Siesta Group Schlafanalyse GmbH, Vienna, Austria). Sleep was staged in non-overlapping 30-s epochs according to the rules of Rechtschaffen and Kales26 using the Somnolyzer 24 × 7 system, an automated scoring system with human quality control. In a large polysomnographic database (n = 590), the Somnolyzer system has been shown to provide inter-rater reliability against a human expert comparable to that between 2 human scorers.27
EEG spectral power during sleep episodes was analyzed in running 4-s epochs that overlapped by 2 s. For each epoch, EEG spectral power was estimated using FFT analysis with a Tukey window. Epochs with artifacts were identified and removed using an algorithm based on spectral power thresholds (The Siesta Group Schlafanalyse GmbH). To assess the time course of EEG spectral power during baseline sleep and recovery sleep, data were log-transformed and reduced by averaging in 2-h, non-overlapping time bins. Data were analyzed separately for NREM sleep and REM sleep. Comparisons for EEG spectral power between baseline sleep and recovery sleep were performed in subjects who participated in Protocol 2. Since participants were kept awake for 40 h, bedtime occurred at the same clock time during baseline and recovery sleep episodes. In 1 resilient subject and 2 vulnerable subjects, EEG data were not available for the recovery sleep episode. The resilient subject withdrew after 30 h of wakefulness due to difficulty tolerating the hourly snacks given during the constant routine procedure. Technical problems resulted in data loss in one of the vulnerable subjects, and EEG electrodes were not applied in the other vulnerable subject due to scalp irritation.
EEG spectral power during wakefulness was analyzed for each PVT in running 2-s, non-overlapping epochs. The EEG was manually inspected for artifacts caused by movements, blinks, or cardiac activity. Power spectral density for each epoch was estimated using the modified periodogram method, and EEG spectral power computed in 0.5-Hz bins from 0 to 16 Hz using the trapezoidal method. Data were log-transformed and averaged across epochs within each PVT session. Since our findings did not differ across EEG derivations (data not shown), we show results only for central derivation (Cz during wake and C3/C4 during sleep). In parallel, to quantify variability in EEG spectral power, we computed the standard deviation of EEG spectral power for all available artifact-free epochs during each PVT. Data from 1 subject who was defined as vulnerable to sleep deprivation could not be analyzed due to technical problems in the waking polysomnographic recording.
Heart Rate Variability Analysis
The ECG was analyzed during the PVT, as well as during a 3-min Karolinska Drowsiness Test (KDT) that took place immediately before the PVT. The RR-interval time series was determined using a Hilbert transform-based method to detect QRS peaks.28 We examined time-domain measures including heart rate (HR) and the standard deviation of sinus RR-intervals (SDNN), as well as HRV frequency-domain metrics defined by the Task Force for Heart Rate Variability Analysis.29 Using the Lomb periodogram method,30 spectral power was determined for each RR-interval time series in the very-low-frequency (VLF, ≤ 0.04 Hz), low-frequency (LF, 0.04-0.15 Hz), and high-frequency (HF, 0.15-0.40 Hz) bands. Data from 3 subjects (2 resilient individuals and 1 vulnerable individual) were excluded from analysis; 2 subjects exhibited sustained ectopic beats and HRV metrics are unreliable in these cases,29 while there were technical problems with the third subject's data (the same subject whose waking EEG could not be used).
Ocular Measures of Sleepiness
The EOG recorded during PVT sessions was manually scored for eye blinks. The middle 8 min of each PVT was divided into 240 two-s, non-overlapping epochs. The percentage of epochs containing ≥ 1 eye blink was determined for each PVT session. Data from 1 subject could not be used for EOG analyses due to technical problems in the polysomnographic recording (the same subject whose waking EEG and ECG could not be used). Eye-tracking data obtained during the PVT were analyzed to determine PERCLOS, defined as the percentage of time per minute that the pupil was ≥ 80% covered by the eyelid.31 Since PERCLOS is used to assess slow closures of the eyes caused by drowsiness, closures < 400 ms (i.e., blinks) were excluded.32
Circadian Phase Assessment
Core body temperature data from the CR procedure were fitted using a two-harmonic with correlated noise regression model.33 To compare circadian phase in individuals who were resilient versus vulnerable to sleep deprivation, we used the fitted core body temperature minimum.
Procedures for the Follow-Up Laboratory Visit
Protocol
A subset of vulnerable (n = 13) and resilient (n = 12) subjects participated in a follow-up study at the CSL. In the week before the return visit, subjects recorded their bedtimes and wake times in a diary. There were no restrictions on the timing of night sleep, but participants were instructed to not take daytime naps. Subjects reported to the laboratory in the mid-afternoon (between 14:00 and 18:00) to take a 10-min PVT. Environmental conditions were the same as those described for the CR procedure (i.e., dim ambient light and semi-recumbent position in bed), except that participants were seated for only 10 min before the commencement of testing. The ECG was recorded during the PVT to assess heart rate and its variability. After testing, participants provided a blood sample for genotyping of the Per3 variable number tandem repeat (VNTR).
Genotyping of the Per3 VNTR
Genomic DNA was extracted from whole blood using a MasterPure DNA Purification Kit for Blood (Epicentre), and Per3 VNTR genotyping was performed by polymerase chain reaction (PCR) using the following primers: forward, 5'-CAAAATTTTATGACACTACCAGAATGGCTGAC-3'; reverse, 5'-AACCTTGTACTTCCACATCAGTGCCTGG-3'.34 DNA was denatured at 94°C for 2 min, followed by 40 cycles of denaturing at 94°C for 30 s, primer annealing at 60°C for 30 s, and PCR extension at 72°C for 30 s. Allelic variants of the Per3 VNTR carrying 4 repeats (581 bp) and 5 repeats (635 bp) were identified by gel electrophoresis.
Statistical Analysis
Subject characteristics, pre-study actigraphy, and sleep staging results were compared between groups (resilient versus vulnerable) using a 2-tailed Student's t-test. Levene's test was used to check homogeneity of variances, and where non-homogeneity was detected, adjustments were made to the error term for the t-statistic and to the degrees of freedom. In such cases, we report the adjusted degrees of freedom. EEG spectral power was log-transformed and compared in 0.5-Hz bins between groups using 2-tailed t-tests, as previously described.35 The time-course of EEG slow wave activity during NREM sleep was compared using 2-way repeated measures ANOVA (group and time as between- and within-subject factors respectively, with data binned 2-hourly). During the CR procedure, the interaction of group (resilient versus vulnerable) and wake state (baseline versus sleep deprived) on PVT performance and EEG, ECG, and ocular measures was assessed by 2-way repeated measures ANOVA. The baseline state was defined as the first 16 h of wakefulness, and the sleep deprived state was defined as wakefulness after habitual bedtime (16-24.5 h after wake). In each subject, data were averaged across the baseline state (i.e., across 5 PVT sessions) and sleep deprived state (i.e., across 6 PVT sessions) prior to statistical testing. Repeated measures ANOVA was also used to compare PVT performance and ECG-derived measures during the CR procedure (8.5 h after wake) versus the return visit to the laboratory (group × sleep schedule; fixed versus ad libitum sleep). For ANOVAs with statistically significant interactions, t-tests were used post hoc to examine the simple effects of group (resilient versus vulnerable) by wake state. Statistical analyses were performed using SPSS software (IBM Corp., New York, NY), and P < 0.05 was considered statistically significant.
RESULTS
Individual Differences in Sustained Attention and Sleepiness during Total Sleep Deprivation
Forty-five healthy subjects underwent total sleep deprivation in a controlled laboratory setting. After a night of baseline sleep (8 h time in bed), subjects were kept awake continuously for 26 h (Protocol 1; n = 9) or 40 h (Protocol 2; n = 36). Every 2 h, participants completed a 10-min PVT to assess their ability to sustain visual attention (Figure 1A). In most participants, lapses in attention (response time > 500 ms) increased near habitual bedtime, but there were marked individual differences in the magnitude of performance impairment (Figure 1B). We stratified our pool of 45 subjects by tertiles based on each person's total number of PVT lapses during one night of sleep deprivation (16.5 to 24.5 h after wake). Vulnerable individuals were defined as the third of participants with the greatest number of PVT lapses (n = 15), and resilient individuals were defined as the third of participants with the fewest number of lapses (n = 15). Using this stratification scheme, there was almost no overlap in individual profiles of PVT lapses for vulnerable versus resilient participants during the usual hours of sleep (Figure 1C); i.e., these groups were phenotypically distinct.
Figure 1.
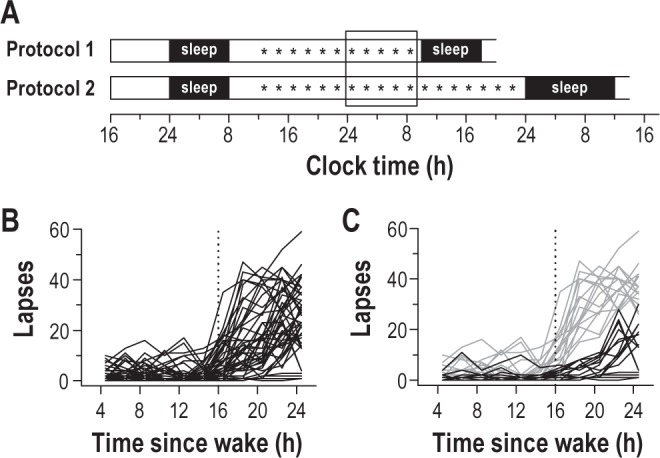
Stratification of participants into resilient and vulnerable groups. (A) After an 8-h opportunity for sleep, subjects underwent sleep deprivation for 26 h (Protocol 1; n = 9) or 40 h (Protocol 2; n = 36) using constant routine procedures. Every 2 h, subjects completed a 10-min psychomotor vigilance task (PVT), indicated by the asterisks. PVTs scheduled during one night of sleep deprivation are shown by the box. (B) The time-course of PVT lapses in individual subjects (n = 45) revealed large inter-individual differences in sustained attention after habitual bedtime. (C) Subjects were stratified into tertiles based on each person's number of lapses during sleep deprivation. The group of participants with the fewest number of lapses was defined as resilient to sleep deprivation (n = 15; black traces), whereas the group with the greatest number of lapses was defined as vulnerable (n = 15; gray traces). In panels B-C, the vertical dotted line indicates habitual bedtime.
During each PVT, we examined objective measures of sleepiness derived from ocular measures. During the first 16 h of wakefulness, there was no difference between vulnerable and resilient groups in percentage eyelid closure over the pupil over time (PERCLOS) or blink rate (Figure 2A-B). After habitual bedtime, vulnerable individuals showed a greater increase in PERCLOS relative to resilient individuals (Figure 2A; post hoc t20 = -5.07, P < 0.001), whereas blink rate, which is negatively correlated with sleepiness and PVT performance,25 decreased across the night only in vulnerable individuals (Figure 2B; post hoc t27 = 3.46, P = 0.002). There was no difference between groups in self-rated sleepiness, however, assessed using a VAS for sleepiness (Figure 2C; F1,27 = 0.03, P = 0.87) and the Karolinska Sleepiness Scale (data not shown; F1,27 = 0.11, P = 0.74). There was also no difference between groups in circadian timing, as assessed by the core body temperature rhythm (Figure 2D; F1,23 = 0.51, P = 0.48).
Figure 2.
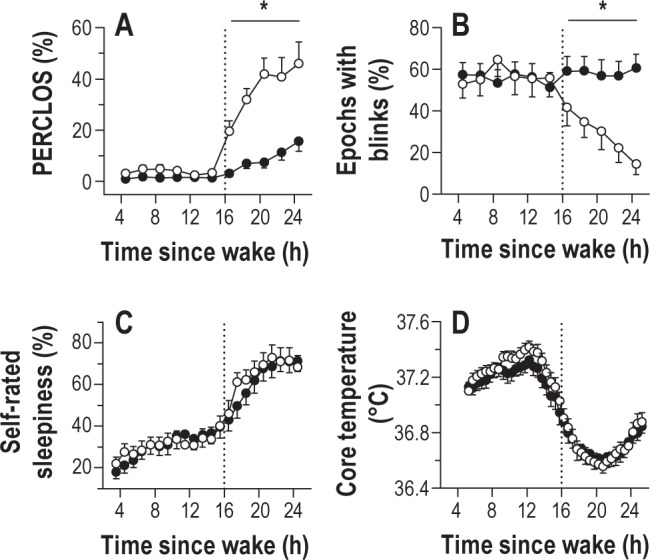
Individual differences in sustained attention during sleep deprivation are related to differences in objective sleepiness. (A) Subjects who were vulnerable to the effects of sleep deprivation on sustained attention (open circles) closed their eyes a greater percentage of the time during sleep deprivation, as compared to subjects who were resilient to sleep loss (black circles). The percentage of eyelid closure over the pupil over time (PERCLOS) was assessed during a 10-min psychomotor vigilance task (PVT) taken every 2 h. (B) During prolonged wakefulness, vulnerable subjects showed a decrease in blink rate relative to resilient subjects. (C) Despite differences in ocular measures of sleepiness, the time-course of self-rated sleepiness was similar between groups. (D) The timing of the circadian system was also similar in resilient and vulnerable subjects, as shown for the rhythm of core body temperature. In each plot, the vertical dotted line indicates habitual bedtime, which defines the boundary between baseline wakefulness and sleep deprivation. Asterisks indicate significant differences between groups by wake state (baseline versus sleep deprived). In each plot, the mean ± SEM is shown.
Differential Vulnerability to Sleep Deprivation is Not Explained by Differences in Homeostatic Sleep Pressure Assessed by EEG Slow Wave Activity
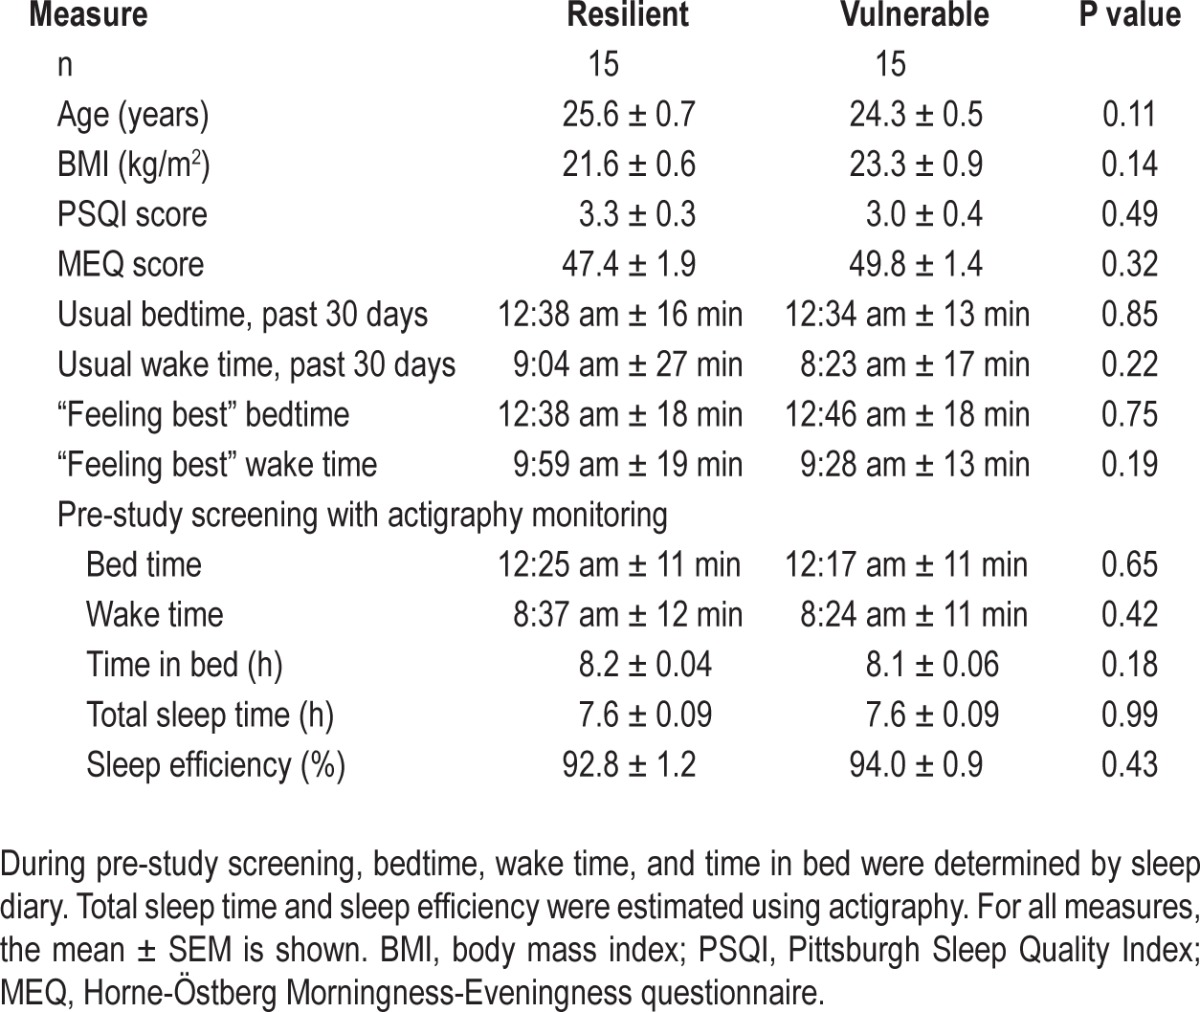
Next, we examined whether individual differences in sustained attention during sleep deprivation were related to differences in recent sleep history. Based on their responses on the Pittsburgh Sleep Quality Index (PSQI) and Horne-Östberg Questionnaire, vulnerable and resilient individuals reported good quality sleep in the month prior to the study and did not differ in their usual or preferred wake times and bedtimes (Table 1). In the week before the laboratory study, subjects were required to keep a regular sleep-wake schedule (8 h time in bed each night), during which there was no difference between vulnerable and resilient groups in estimated TST or SE as determined by actigraphy monitoring (Table 1). On the night before being admitted to the study, both groups slept about 7.5 h (resilient, 7.6 ± 0.08 h; vulnerable, 7.5 ± 0.10 h), and sleep efficiency was about 93% (resilient, 93.0% ± 1.0%; vulnerable, 93.5% ± 1.0%).
Table 1.
Subject characteristics
Prior to sleep deprivation, participants were given an 8-h opportunity for sleep in the laboratory, which was assessed by polysomnography (Table 2). Individuals who were resilient to the effects of sleep deprivation on PVT performance slept about 15 min less than vulnerable individuals (t28 = -2.43, P = 0.022), resulting in a small but significant difference between groups in sleep efficiency (t28 = -2.11, P = 0.045). The percentage of time spent in stage 2 sleep, slow wave sleep, and REM sleep was similar between groups, whereas resilient individuals spent slightly more time in stage 1 sleep (Table 2). Next, we examined recovery sleep in participants who were kept awake for 40 h (vulnerable, n = 11; resilient, n = 12), and who were given a 12-h opportunity for recovery sleep beginning at their habitual bedtime (Figure 1A; Protocol 2). There were no differences between groups in TST, SE, or percentage of time spent across sleep stages, assessed during the first 8 h of time in bed (Table 2), or across the entire 12-h sleep episode (data not shown).
Table 2.
Polysomnographic measures during baseline sleep and recovery sleep in individuals who were resilient versus vulnerable to the effects of sleep deprivation on sustained attention
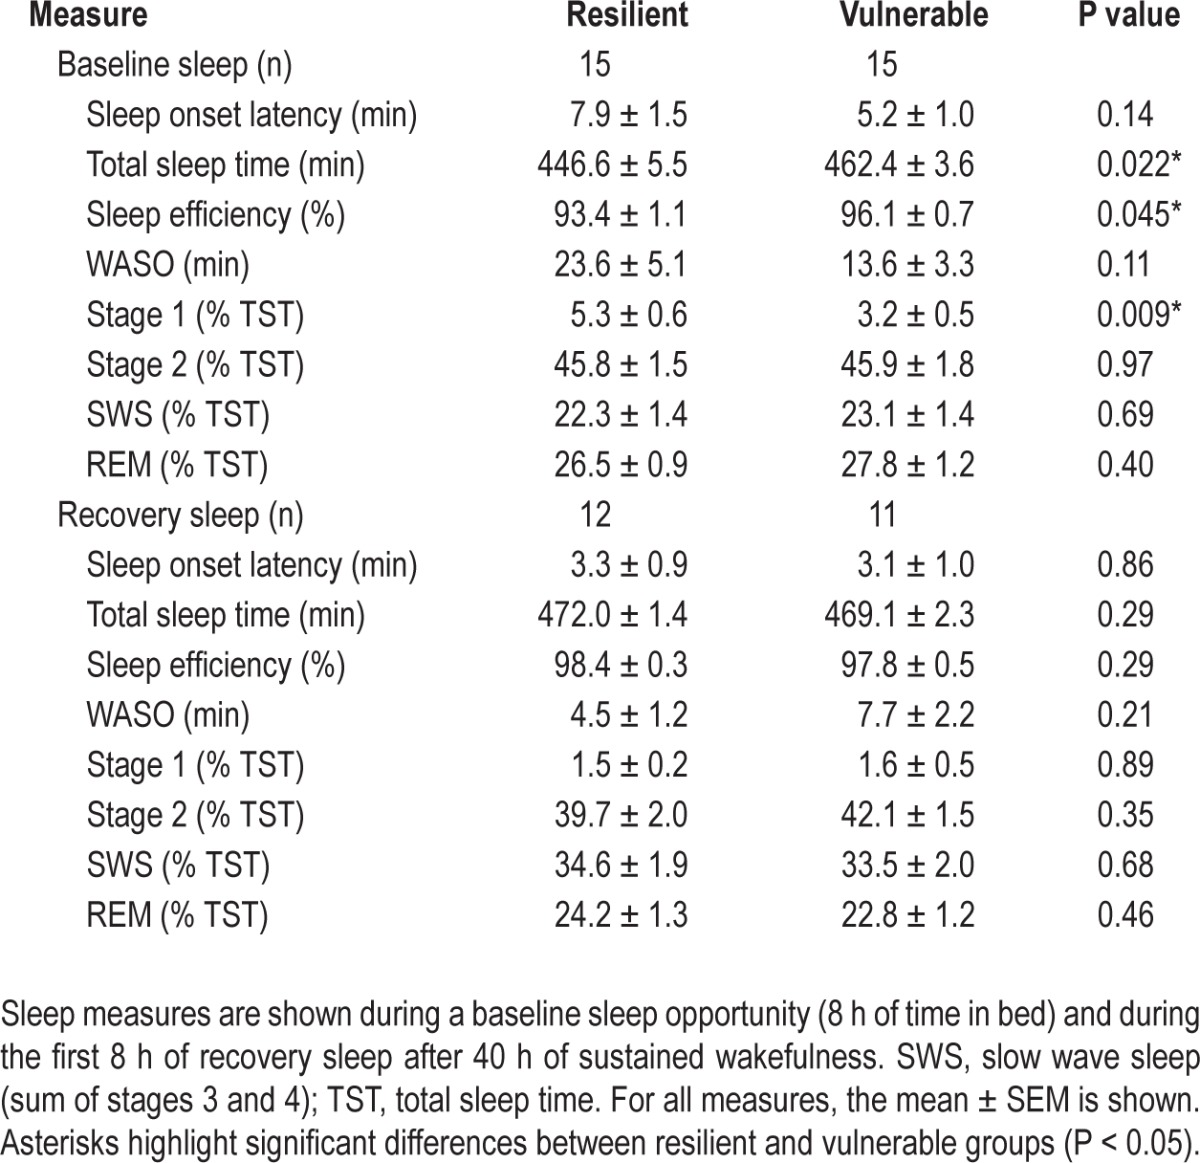
To assess whether vulnerable and resilient groups differed in their buildup or dissipation of homeostatic sleep pressure, we examined EEG spectral power during baseline sleep and recovery sleep. EEG power spectra were similar between groups during NREM sleep and REM sleep, assessed during the entire sleep episode (Figure 3A-B) and in 2-h bins across baseline sleep and recovery sleep (t28 > -1.65, P > 0.11 for all pairwise comparisons across frequency bins). To assess more directly whether vulnerable individuals showed a greater buildup of sleep pressure during prolonged wakefulness relative to resilient individuals, we measured the increase in SWA during the first 2 h of recovery sleep versus baseline sleep. Resilient and vulnerable groups showed a similar increase in SWA near the beginning of the recovery sleep episode (Figure 3C). In addition, SWA decreased at the same rate in both groups during baseline sleep and recovery sleep (Figure 3D).
Figure 3.
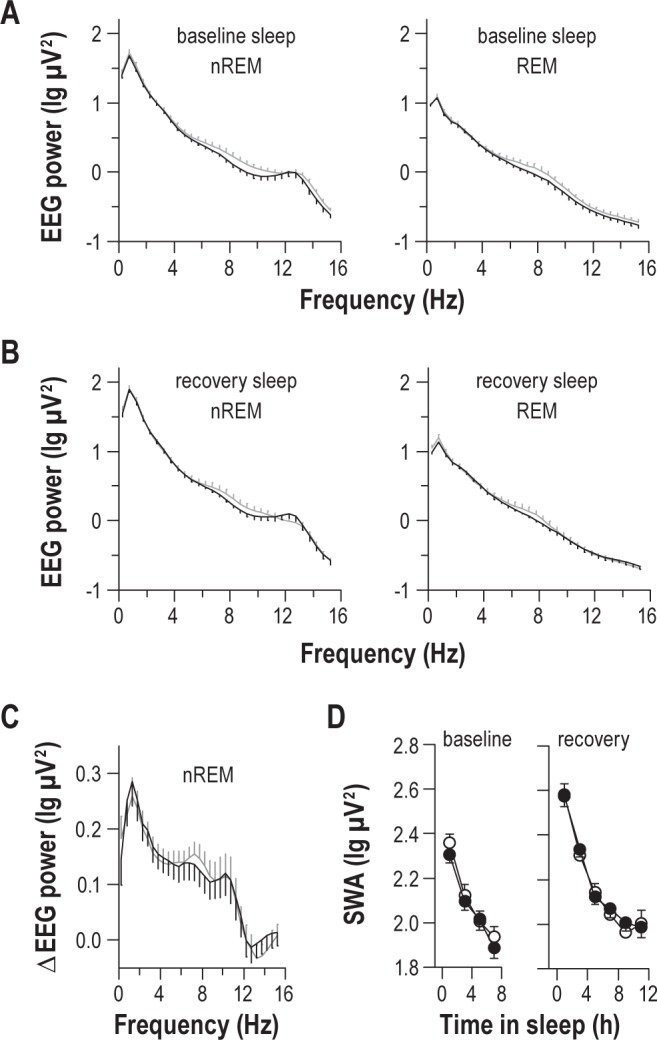
Individual differences in vulnerability to sleep deprivation are not explained by differences in homeostatic sleep regulation. (A) During baseline sleep, subjects who were resilient (black traces) or vulnerable (gray traces) to the effects of sleep deprivation on sustained attention displayed similar EEG spectral power, assessed during NREM sleep or REM sleep. (B) Similarly, during the first 8 h of recovery sleep that followed sleep deprivation, there was no difference between groups in EEG spectral power for NREM sleep or REM sleep. (C) Resilient and vulnerable groups showed an equivalent increase in spectral power in the 0-12 Hz range from baseline sleep to recovery sleep, assessed during NREM sleep in the first 2 h of the sleep episode. (D) The time-course of EEG slow wave activity (SWA) during NREM sleep was similar between resilient (black circles) and vulnerable (open circles) groups during baseline sleep and recovery sleep, suggesting that there was no difference in the buildup or dissipation of homeostatic sleep pressure. In each plot, the mean ± SEM is shown, and data are shown for the central EEG derivation.
Vulnerable Individuals Show Greater Instability in Sustained Attention at Baseline than Resilient Individuals
Next, we examined whether individual differences in sustained attention during sleep deprivation could be explained by differences in performance at baseline. Although vulnerable individuals showed a much greater deterioration in PVT performance during sleep deprivation than resilient individuals, there were also differences between groups at baseline (Figure 4). Vulnerable individuals exhibited a small but significantly greater number of lapses in attention (Figure 4A; post hoc t21.3 = -3.21, P = 0.004) and slower average response times (Figure 4B; post hoc t28 = -2.58, P = 0.015), as compared to resilient individuals. PVT performance during the daytime was also more variable in vulnerable subjects, as evidenced by a higher standard deviation of responses times within each PVT session (Figure 4C; post hoc t28 = -3.59, P = 0.001), and a greater number of consecutive PVT response times that differed by more than 250 ms (Figure 4D; post hoc t18.7 = -3.30, P = 0.004). Despite having slower average response times, vulnerable individuals could nonetheless respond as quickly as resilient individuals for the fastest 10% of responses during the daytime (post hoc t28 = -1.06, P = 0.30).
Figure 4.

Individual differences in psychomotor vigilance task (PVT) performance during baseline wakefulness and sleep deprivation. PVT performance measures are shown in vulnerable subjects (open circles) and resilient subjects (black circles) during prolonged wakefulness. During sleep deprivation, vulnerable individuals showed a much greater increase than resilient individuals in (A) lapses, (B) mean reaction time (RT), (C) standard deviation (SD) of RT, and (D) the number of consecutive RTs that differed by greater than 250 ms. In the right column, PVT measures during the daytime are re-plotted on a different scale to highlight baseline differences between resilient and vulnerable groups. In the left column, asterisks indicate significant differences between groups by wake state (baseline versus sleep-deprived). The vertical dotted line indicates habitual bedtime, which defines the boundary between baseline wakefulness and sleep deprivation. In the right column, asterisks show significant differences between groups at each time point (t-test, P < 0.05). In each plot, the mean ± SEM is shown.
Vulnerable Individuals Show a Slower and More Variable Heart Rate than Resilient Individuals
In a previous study, we showed that some measures of heart rate variability (HRV) track individual PVT performance during sleep deprivation.25 We therefore hypothesized that individual differences in HRV might associate with relative vulnerability to sleep deprivation. We found that heart rate was slower (Figure 5A) and more variable (Figure 5B) in vulnerable individuals, regardless of time since wake. In contrast, heart rate and its variability did not differ between groups during baseline sleep or recovery sleep (data not shown). To examine differences in HRV during wakefulness in greater detail, we performed spectral analysis on the RR-interval time series during each PVT. We found that, compared to resilient individuals, RR-interval spectral power was significantly greater in vulnerable participants in the very-low-frequency (VLF, ≤ 0.04 Hz; Figure 5C) and low-frequency (LF, 0.04– 0.15 Hz; Figure 5D) bands (F1,24 > 12.5, P < 0.002 for both comparisons). In contrast to VLF and LF spectral power, there was a significant interaction between group and wake state for high-frequency spectral power (HF, 0.15-0.40 Hz; Figure 5E), such that HF power increased by a greater amount in vulnerable individuals during the usual hours of sleep (post hoc t24 = -2.71, P = 0.012).
Figure 5.
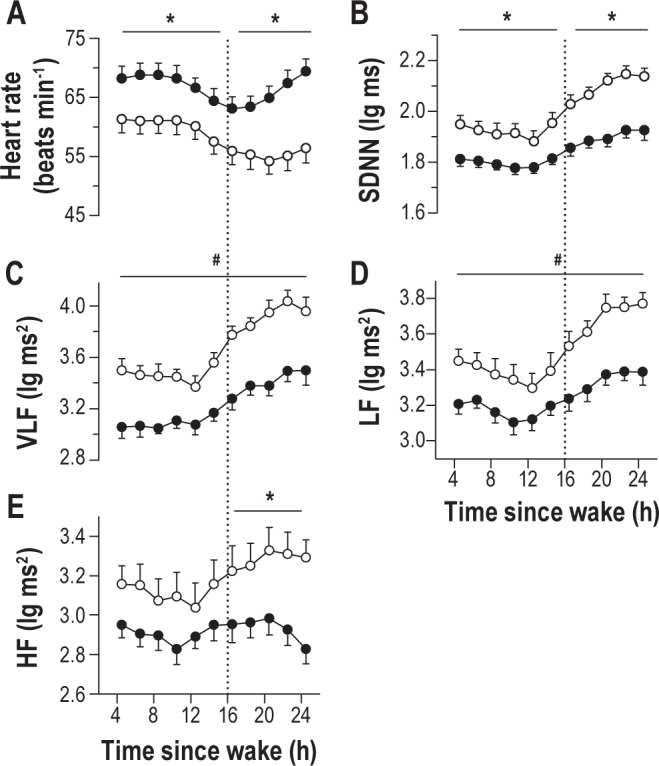
Individual differences in heart rate and its variability associate with differences in psychomotor vigilance task (PVT) performance during sleep deprivation. (A) Irrespective of time elapsed since wake, individuals who were vulnerable to the effects of sleep deprivation (open circles) on sustained attention exhibited a lower heart rate than resilient individuals (black circles) during the PVT. (B) Vulnerable participants also displayed greater variability in heart rate than resilient individuals, as assessed by the standard deviation of sinus normal to normal inter-beat intervals (SDNN). Based on frequency domain measures of the RR-interval time series, vulnerable subjects exhibited greater spectral power in (C) very-low-frequency (VLF, ≤ 0.04 Hz), (D) low-frequency (LF, 0.04-0.15 Hz), and (E) high-frequency (HF, 0.15-0.40 Hz) bands, as compared to resilient subjects. Asterisks indicate significant differences between groups by wake state (baseline versus sleep deprived). Where a significant interaction between group and wake state was not observed, number symbols (#) indicate a significant main effect of group on heart rate variability. In each plot, the mean ± SEM is shown.
Vulnerable Individuals Show Higher and More Variable Waking EEG Theta Power than Resilient Individuals
Next, we examined individual differences in EEG spectral power during sustained wakefulness. At baseline, sleep deprivation-vulnerable individuals demonstrated significantly more spectral power in the high frequency theta range (6.0-7.5 Hz) than resilient individuals (Figure 6A; t27 < -2.20, P < 0.037 across pairwise comparisons in 0.5-Hz bins). When wakefulness was extended beyond habitual bedtime, vulnerable individuals continued to show higher levels of high frequency theta activity, as well as more delta power relative to resilient individuals (Figure 6B; t27 < -2.24, P < 0.033 for both comparisons). Consistent with ocular measures of objective sleepiness (Figure 2), vulnerable participants showed a greater increase in EEG delta power after habitual bedtime than resilient individuals (Figure 6C, post hoc t27 = -3.28, P = 0.003). By comparison, theta power in the 6.0-7.5 Hz range was higher in vulnerable individuals irrespective of time elapsed since wake (Figure 6D; F1,27 = 6.74, P = 0.015). We also assessed variability in EEG delta and theta activity by computing the standard deviation of spectral power in 2-s non-overlapping epochs during each PVT session. There was a small main effect of group on standard deviation of EEG delta power, with higher variability observed in vulnerable subjects (Figure 6E; F1,25 = 6.51, P = 0.017). There was also a main effect of group on the standard deviation of high-frequency EEG theta power, such that variability in theta activity was significantly greater in vulnerable participants during wakefulness, as compared to resilient participants (Figure 6F; F1,25 = 10.3, P = 0.004).
Figure 6.
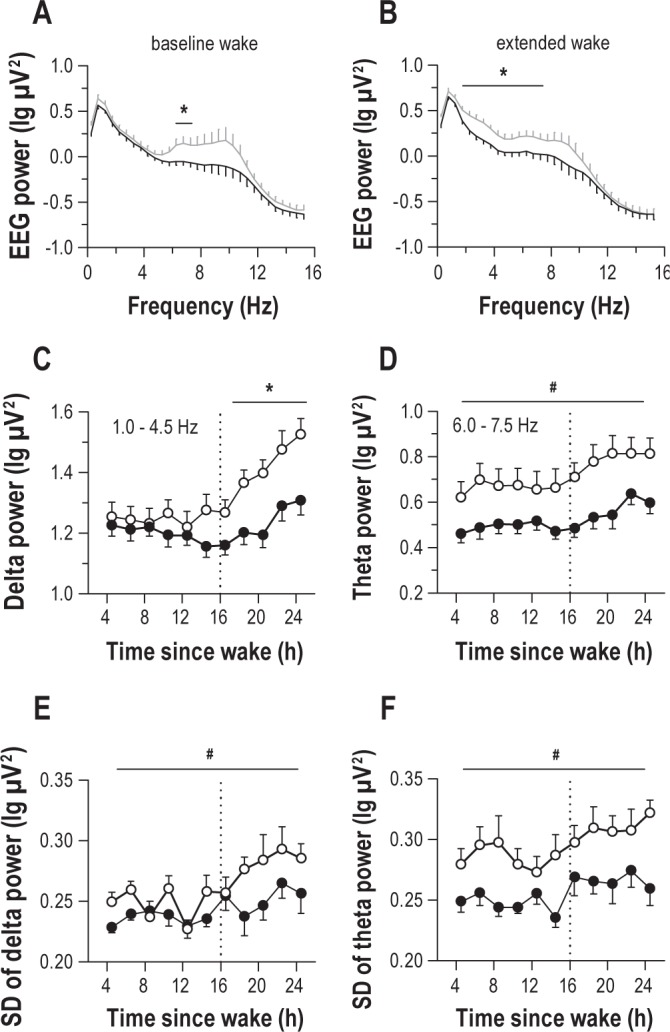
Individual differences in EEG spectral power associate with differences in psychomotor vigilance task (PVT) performance during prolonged wakefulness. (A) During the daytime, individuals who were vulnerable to the effects of sleep deprivation on sustained attention (gray trace) exhibited greater EEG spectral power in the high-frequency theta range (6.0-7.5 Hz) range while taking the PVT, as compared to resilient individuals (black trace). (B) After habitual bedtime, vulnerable individuals continued to show greater high-frequency theta activity than resilient individuals, as well as more spectral power in the delta band. (C) Vulnerable subjects (open circles) showed a greater increase in delta power during sleep deprivation relative to resilient subjects (black circles), whereas (D) EEG theta power was consistently higher in vulnerable participants at all times of day, regardless of time elapsed since wake. (E) Vulnerable individuals showed greater variability in delta power, as well as (F) theta power, relative to resilient individuals, assessed by the epoch-to-epoch standard deviation (SD) of spectral power within each PVT. In panels C-F, the vertical dotted line indicates habitual bedtime, which defines the boundary between baseline wakefulness and sleep deprivation. Asterisks indicate significant differences between groups by wake state (baseline versus sleep deprived). Where a significant interaction between group and wake state was not observed, number symbols (#) indicate a significant main effect of group on EEG measures. In each plot, the mean ± SEM is shown.
Variability in PVT Performance and Heart Rate at Baseline are Reproducible across Study Visits
Next, we evaluated whether baseline differences in attentional or physiologic stability, assessed during a single 10-min PVT, could potentially be used to estimate individual differences in vulnerability to sleep deprivation. We assessed PVT and ECG-derived measures collected in the middle of the day (i.e., 8.5 h after wake), based on our finding that individual differences in daytime PVT performance were greatest at this time point. In our sample of 45 subjects, the baseline markers that associated most strongly with attentional lapses during sleep deprivation were the standard deviation of PVT response times (Spearman rho = 0.63, P < 0.001), and RR-interval spectral power in the VLF band (Spearman rho = 0.55, P < 0.001). Using these measures, we stratified our original pool of 45 subjects by tertiles and found that subjects with high variability in PVT performance, or with high VLF spectral power in the middle of the day, showed a significantly greater increase in PVT lapses during subsequent sleep deprivation, as compared to individuals with low variability in PVT response times or low VLF spectral power (Figure 7A-B; post hoc t < -3.38, P < 0.002). Similarly, individuals with high variability in PVT performance or heart rate exhibited a greater increase in objectively measured sleepiness during the usual hours of sleep, as assessed by PERCLOS (Figure 7C-D; post hoc t < -2.82, P < 0.011).
Figure 7.
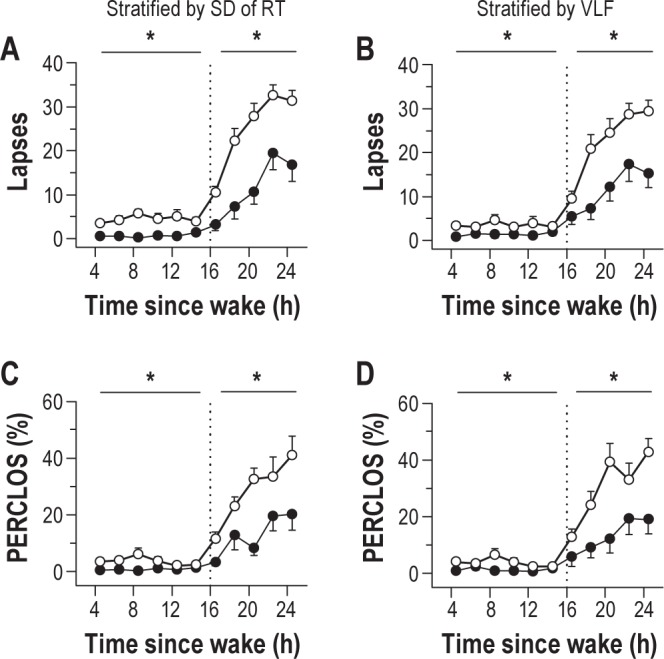
Baseline individual differences in psychomotor vigilance task (PVT) performance variability and heart rate variability associate with relative vulnerability to sleep deprivation. Subjects were stratified into top and bottom tertiles (n = 15 in each group) based on their standard deviation of PVT reaction times, or by RR-interval spectral power in the very-low-frequency band (VLF, ≤ 0.04 Hz), assessed during a single 10-min PVT taken in the middle of the habitual wake period. (A) Individuals with high variability in PVT reaction time (open circles) showed a greater increase in attentional lapses during sleep deprivation than individuals with low variability (black circles). (B) Similarly, subjects with high VLF spectral power (open circles) during the daytime showed a greater decline in PVT performance during prolonged wakefulness than subjects with low VLF spectral power (black circles). (C) Individuals with high variability in daytime PVT performance showed a greater increase in eye closures during sleep deprivation, (D) as did individuals with high spectral power in the VLF band, relative to individuals with low variability in these measures. In each panel, the vertical dotted line indicates habitual bedtime, which defines the boundary between baseline wakefulness and sleep deprivation. Asterisks indicate significant differences between groups by wake state (baseline versus sleep deprived). In each plot, the mean ± SEM is shown.
To assess whether individual differences in daytime PVT performance and heart rate measures were reproducible, we invited participants to return for additional testing ≥ 5 months after they had undergone sleep deprivation in our laboratory. Thirteen vulnerable individuals and 12 resilient individuals agreed to take part in the follow-up study. In the week prior to the return visit, participants recorded their sleep-wake times in a sleep diary, but they were not required to keep a regular sleep schedule. Subjects reported to the laboratory to complete a 10-min PVT in the mid-afternoon (between 14:00 and 18:00), during which the ECG was recorded. Prior to being discharged from the study, participants provided a blood sample for geno-typing of the Per3 variable number tandem repeat (VNTR), to explore the possibility that the vulnerable group had more individuals with 2 copies of the long Per3 allele (Per35/5). This genotype is associated with higher EEG theta activity and increased cognitive vulnerability to sleep deprivation, as compared to individuals with two copies of the shorter allele (Per34/4).8,36 We found that one subject was a Per35/5 carrier, and this person belonged to the group that was resilient to the effects of sleep deprivation on sustained attention. Two individuals in the vulnerable group were heterozygous (Per34/5), and all other participants were homozygous for the short Per3 allele (Per34/4). The low prevalence of the longer Per3 allele in our subject pool precluded further analyses by genotype.
In the week leading up to the return visit, vulnerable and resilient groups spent a similar amount of time in bed per night (resilient, 8.0 ± 0.3 h; vulnerable, 8.1 ± 0.2 h, t23 = -0.03, P = 0.978). Resilient subjects kept more irregular sleep-wake schedules, however, based on the standard deviation of each person's midpoint of sleep over 7 days (resilient, 1.2 ± 0.2 h; vulnerable, 0.6 ± 0.1 h, t14.5 = 2.79, P = 0.014). Even though vulnerable individuals showed more stable sleep-wake timing than resilient individuals in the week prior to the return visit, they continued to show higher variability in PVT response times. Similar to results obtained when participants were studied under constant routine conditions, vulnerable individuals exhibited a higher standard deviation of PVT response times (Figure 8A; F1,23 = 19.62, P < 0.001), and a greater number of consecutive response times that differed by > 250 ms (Figure 8B; F1,23 = 17.33, P < 0.001). An increase in heart rate was observed in both groups during the return visit, but vulnerable individuals continued to exhibit a lower heart rate than resilient subjects (Figure 8C; F1,21 = 4.40, P = 0.048). Additionally, vulnerable individuals continued to show higher variability in heart rate, including RR-interval spectral power in the VLF band (Figure 8D; F1,21 = 7.89, P = 0.011). Hence, baseline differences between vulnerable and resilient individuals in PVT performance variability and HRV were stable across study visits, even when these measures were studied several months apart and participants kept fixed or irregular sleep-wake schedules prior to testing.
Figure 8.
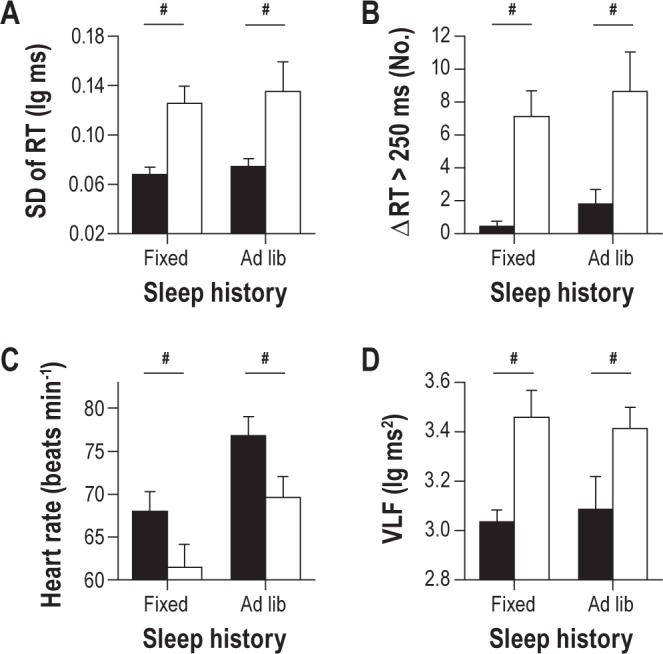
Baseline individual differences in psychomotor vigilance task (PVT) performance variability and heart rate variability are reproducible across study visits. A subset of individuals that was characterized as resilient (n = 12) or vulnerable (n = 13) to the effects of sleep deprivation on sustained attention participated in a follow-up study at least 5 months after their initial visit to the laboratory. Participants were required to keep a fixed sleep schedule with 8 h time-in-bed per night prior to the first laboratory visit, but they were free to choose their sleep and wake times prior to the second visit. We compared PVT performance and heart rate variability during the middle of the habitual wake period between study visits. Regardless of prior sleep history (fixed versus ad libitum sleep), vulnerable individuals (white bars) exhibited more variable response times than resilient individuals (black bars), as assessed by (A) the standard deviation of PVT reaction time (RT), and (B) the number of consecutive RTs that differed by greater than 250 ms. (C) During both study visits, resilient subjects displayed a higher heart rate than vulnerable subjects, and both groups showed an increase in heart rate during the second visit. (D) Vulnerable subjects exhibited greater RR-interval VLF spectral power than resilient subjects, irrespective of differences in sleep history. Number symbols (#) show main effects of group on PVT and heart rate measures. In each plot, the mean ± SEM is shown.
DISCUSSION
Our retrospective analyses show that individual differences in PVT performance and sleepiness during total sleep deprivation associate with baseline differences in attentional and physiologic stability. Regardless of time elapsed since wake, individuals who were vulnerable to sleep deprivation showed more unstable PVT performance, and exhibited greater variability in heart rate and EEG theta power, as compared to resilient individuals. These laboratory findings raise the possibility that baseline measures of cognitive and physiologic intra-individual variability can be used to estimate inter-individual differences in vulnerability to sleep deprivation.
According to the state instability hypothesis, sustained attention during sleep deprivation becomes unstable as sleep initiating mechanisms compete with increased compensatory effort to remain awake.3 Our findings suggest that individual differences in performance during sleep deprivation are at least partially explained by between-subjects differences in performance instability at baseline. We hypothesize that small baseline differences in performance variability are amplified by state-instability during sleep deprivation, and thus contribute to very large between-subjects differences in the magnitude of performance impairment. While the mechanisms governing attentional lapses might differ across wake states,37 our findings nonetheless demonstrate that instability in baseline PVT performance correlates with the magnitude of PVT performance impairment during sleep deprivation.
On average, individuals who were resilient to the effects of sleep deprivation on sustained attention exhibited several more heart beats per minute than vulnerable individuals, irrespective of time elapsed since wake. Resilient participants also exhibited lower HRV, demonstrating that sustained attention performance and variability in cardiovascular control are co-related. Previous studies have shown that with increasing time-on-task, performance decline is associated with an increase in HRV; hence, HRV has been proposed as a marker of effort allocation. In our study, however, vulnerable individuals exhibited higher HRV than resilient individuals, even when they were not performing the PVT. We assessed this during a 3-min Karolinska Drowsiness Test (KDT) taken prior to each PVT (data not shown, F1,24 = 11.7, P = 0.002). The KDT has minimal task load (participants simply stare at a circle) and requires almost no mental effort. In addition, the fastest 10% of PVT response times was similar in resilient versus vulnerable individuals, suggesting that participants who were vulnerable to sleep deprivation were responding as quickly as possible, as instructed. These results suggest that individual differences in HRV were not related to differences in effort allocation. An alternative explanation for our findings is that resilient subjects are in a constant state of increased arousal relative to vulnerable subjects, and hence show greater sympathetic activity, i.e., increased heart rate and lower beat-to-beat variability, regardless of time since wake.38 Consistent with this interpretation, resilient subjects exhibited less total sleep and lower sleep efficiency during baseline sleep and lower theta activity in the waking EEG.39 It should be pointed out, however, that resilient subjects did not report difficulty falling asleep or maintaining sleep, and their EEG sleep staging results were in the normal range for young adults. Also, there were no group differences in heart rate or its variability or EEG spectral power during sleep, which contrasts with hyperarousal in insomnia.38,40 Nonetheless, our findings during wakefulness could be attributed, at least in part, to higher waking sympathetic drive and arousal in resilient participants.
During wakefulness, vulnerable individuals exhibited more high-frequency EEG theta activity than resilient individuals. Although it has been suggested that differences in baseline EEG theta activity might reflect differences in homeostatic sleep pressure or sleep history,35 only the rise rate in EEG theta activity during sustained wakefulness has been shown to correlate with the buildup of EEG slow wave activity in recovery sleep.41 Notably, in our study the increase in EEG theta power during sleep deprivation did not differ between resilient and vulnerable groups. We speculate that high waking EEG theta activity might be a general marker that associates with susceptibility to sleep deprivation. Similar to our findings, Per35/5 carriers have greater EEG theta activity regardless of time spent awake, and these individuals show increased susceptibility to the effects of total sleep deprivation on executive function.8,36 Alternatively, group differences in EEG theta activity might reflect differences in sympathetic drive, as insomniacs with hyperarousal exhibit lower waking theta power than controls despite having disrupted sleep.39 As discussed above, lower theta activity in resilient subjects could be attributed to greater sympathetic arousal. Group differences in EEG theta activity at baseline could also reflect differences in EEG-generating mechanisms that are not related to sleep-wake regulation, as proposed for individuals with the ADORA2A 1976 > C polymorphism.42 We found, however, that variability in EEG spectral power increased in delta and theta frequency bands during sleep deprivation, which parallels our results for PVT performance and could reflect increased state instability.
Individual differences in sustained attention during sleep deprivation did not appear to be explained by differences in homeostatic sleep regulation. Resilient and vulnerable groups showed a similar increase in EEG SWA in NREM sleep in response to sleep deprivation; and other markers of sleep homeostasis, including spindle frequency activity in NREM sleep and theta-alpha activity during REM sleep, were similar between groups during both baseline sleep and recovery sleep. At baseline, resilient individuals had slightly more stage 1 sleep (by about 2%), and slept about 15 min less than vulnerable individuals. Based on these results, it could be argued that resilient individuals experienced shallower sleep or less sleep pressure. We consider this possibility unlikely, however, as the amounts of light sleep (stage 2), REM sleep, and deep sleep were not different between groups, and there were no differences in EEG power spectra during baseline sleep or recovery sleep. Rather, our findings are consistent with those reported by Van Dongen et al., in which homeostatic sleep drive did not correlate with waking performance.43 To be clear, our results do not exclude the possibility that individual differences in sleep homeostasis can give rise to differences in cognitive vulnerability.8,36 Rather, our findings suggest that in the general population, differential vulnerability in sustained attention to sleep deprivation is probably only weakly influenced by individual differences in sleep homeostasis (assessed by SWA), suggesting that other factors likely play a more important role in determining the rate of performance decline during prolonged wakefulness. Consistent with this interpretation, individual differences in sleep homeostasis that derive from allelic variation in ADA, ADORA2A, COMT, HLA-DQB1, and BDNF are not associated with differences in deterioration in cognitive performance during sleep loss.6,7,10,11,44,45 Also, based on studies of monozygotic versus dizygotic twin pairs, individual differences in PVT performance during sleep deprivation are highly heritable, but are not explained by genetic variation in the Per3 or ADA genes.45 While genotype-dependent differences for specific behavioral performance measures have been reported for some allelic variants (ADA 22G > A; ADORA2A HT4 haplotype; BDNF Val66Met), these differences are present at baseline and are not modulated by total sleep deprivation, i.e., there is not a significant interaction between state and genotype on performance. By comparison, we found that individuals with high variability in PVT response times or heart rate at baseline showed a much greater deterioration in sustained attention during sleep deprivation relative to individuals with lower variability in these measures.
An important limitation of our study is that we do not know if differences between resilient and vulnerable groups were driven by differences in state or trait. In the week prior to the laboratory study, participants were required to keep a regular sleep schedule with 8 h of time in bed for sleep. Although this amount falls within the recommended range for sleep duration in young adults, and both groups felt equally alert at baseline based on ocular measures and self-rated sleepiness, we cannot be sure that resilient and vulnerable groups were equally rested before undergoing sleep deprivation. Both groups chose to spend an average of 8 h of time in bed per night under real-life conditions, but it is possible that subjects who were defined as vulnerable need more sleep to perform at an optimal level on the PVT relative to resilient subjects. Here, we did not test whether subjects are capable of performing better if time-in-bed for sleep is extended beyond 8 h each night, i.e., to satiate sleep need. As such, we do not know if each group was studied under equal state conditions. Similarly, we cannot exclude the possibility that resilient and vulnerable groups were differentially affected by the first-night effect of sleeping in our laboratory. There were small group differences in stage 1 sleep and sleep efficiency during baseline sleep, but the percentage of wakefulness after sleep onset was in the normal range (< 5%) in both groups. Even if baseline sleepiness was equivalent between groups, trait-like stability in vulnerability to sleep deprivation was not assessed in our study, as participants were deprived of sleep only once. Prior work has shown that trait-like differences in PVT performance account for a large proportion of observed individual differences, even when prior sleep history (i.e., state) is manipulated.1,2,45,46 Therefore, in future work it should be tested whether individual differences in baseline measures of attentional and physiologic instability associate with decrements in performance across repeated exposures to sleep deprivation, under equal and unequal state conditions (e.g., in response to sleep extension or sleep restriction).
The present study focused on vulnerability in sustained attention to sleep deprivation using PVT performance; however, individual differences in PVT performance during sustained wakefulness do not necessarily associate with differences in performance in other cognitive domains, e.g., working memory and processing speed.1,47 Nonetheless, our findings are potentially relevant for real-world tasks that require sustained attention, e.g., driving at night, baggage screening, and radar monitoring. Since we only examined performance vulnerability during total sleep deprivation, it will be important to test whether our findings translate to different types of sleep loss, e.g., partial sleep restriction or fragmented sleep caused by a sleep disorder. Participants reported good quality sleep prior to our study, but we did not perform a sleep disorders screen in the laboratory. We cannot rule out the possibility that some subjects had an undiagnosed sleep disorder, although we did not find evidence of disordered sleep in our subjects based on sleep staging results. Similarly, we cannot rule out the possibility that some subjects experienced caffeine withdrawal,48 as participants were asked to avoid consumption of caffeinated products for at least one week prior to the study. Symptoms of withdrawal typically peak within the first two days of caffeine cessation, but it is possible that some individuals were still affected by the start of the laboratory study. Also, because we only studied young healthy participants, most of whom were males, in ongoing studies we are examining the influence of sex and age on PVT performance stability.
Herein, we used the terms “resilient” and “vulnerable” to describe subject PVT performance in relative terms. Similar to previous studies, we stratified our subject pool into top and bottom tertiles, based on performance during sleep deprivation.12,13,15 If we had started with a much larger pool of subjects (e.g., hundreds of participants), we could have applied more stringent criteria for defining resilient and vulnerable groups, such as the top and bottom 10% of performers, or individuals whose performance was more than two standard deviations from the mean. Despite some overlap in behavioral and physiologic measures in subjects who were defined as resilient versus vulnerable, we show that differential vulnerability to sleep deprivation at the group level can be estimated based on individual differences at baseline. It might prove considerably more difficult, however, to predict performance vulnerability to sleep deprivation on a per-individual basis. Another limitation of our study is that baseline markers that associated with vulnerability to sleep deprivation were identified retrospectively. Although inter-subject differences in daytime PVT performance and heart rate variability measures were reproducible across study visits, prospective studies are required to determine whether it is possible to predict individual differences in sustained attention during sleep deprivation.
The mechanisms linking baseline variability in PVT performance and physiologic measures with susceptibility to sleep deprivation remain to be elucidated. During tasks that require sustained attention, the frontoparietal system is engaged and activity in the default-mode network (DMN) is reduced.49 The DMN consists of several brain regions whose activity is highly correlated during rest, when individuals are not engaged in a task. During sleep deprivation, impaired PVT performance is associated with decreased deactivation of DMN activity relative to baseline.50 Additionally, partial or total sleep deprivation is associated with reduced functional connectivity of the DMN, as well as reduced connectivity of the DMN with its anti-correlated network (ACN), which includes brain regions required for attention.51,52 Given that individuals who are resilient versus vulnerable to the effects of sleep deprivation differ in their task-dependent brain activation during rested wakefulness,12–15 as well as their baseline attentional stability, in future studies it will be important to establish whether these groups also differ in their functional connectivity of the DMN and ACN when they are well rested or sleep deprived.
In conclusion, our results show that intra-individual variability in baseline PVT performance could potentially be used to estimate inter-individual differences in sustained attention and sleepiness during total sleep deprivation. Also, irrespective of time elapsed since wake, individuals who are vulnerable to sleep deprivation show higher wake-dependent variability in heart rate and EEG theta activity. Our results therefore establish a feature set that associates with vulnerability to sleep deprivation consisting of increased behavioral and physiologic instability at baseline. These findings have potential implications for safety-sensitive occupations and night shift work; if it were possible to identify individuals who are at greatest risk of committing errors or falling asleep by assessing their baseline cognitive stability, these persons could be managed with appropriate fatigue countermeasures. Based on our results, future work on individual differences in cognitive vulnerability to sleep deprivation should examine the neural origins of behavioral performance instability.
DISCLOSURE STATEMENT
This was not an industry supported study. The authors have indicated no financial conflicts of interest. This work was supported by the Duke-NUS Signature Research Program funded by the Agency for Science, Technology and Research, Singapore, and the Ministry of Health, Singapore; National Medical Research Council, Singapore under NIG/1000/2009 (to Dr. Gooley); and SingHealth Foundation, Singapore, under SHF/FG410P/2009 (to Dr. Puvanendran).
ACKNOWLEDGMENTS
The authors thank Dr. Ivan Ho Mien, Eric Fang, Sara S. Tan, Jonathan Bostick, Victor Pachas, Aiysvariyah Rajedadram, Isabelle Jang, Wen-Qi Tan, Jonathan Chua, Hui-Ning Lim, Merryn Ang, Szeching Lee, and Esther Peh for their assistance in carrying out these studies. Work for this study was performed at Duke-NUS Graduate Medical School Singapore.
REFERENCES
- 1.Van Dongen HP, Baynard MD, Maislin G, Dinges DF. Systematic interindividual differences in neurobehavioral impairment from sleep loss: evidence of trait-like differential vulnerability. Sleep. 2004;27:423–33. [PubMed] [Google Scholar]
- 2.Lim J, Choo WC, Chee MW. Reproducibility of changes in behaviour and fMRI activation associated with sleep deprivation in a working memory task. Sleep. 2007;30:61–70. doi: 10.1093/sleep/30.1.61. [DOI] [PubMed] [Google Scholar]
- 3.Doran SM, Van Dongen HP, Dinges DF. Sustained attention performance during sleep deprivation: evidence of state instability. Arch Ital Biol. 2001;139:253–67. [PubMed] [Google Scholar]
- 4.Borbely AA, Baumann F, Brandeis D, Strauch I, Lehmann D. Sleep deprivation: effect on sleep stages and EEG power density in man. Electroencephalogr Clin Neurophysiol. 1981;51:483–95. doi: 10.1016/0013-4694(81)90225-x. [DOI] [PubMed] [Google Scholar]
- 5.Tucker AM, Dinges DF, Van Dongen HP. Trait interindividual differences in the sleep physiology of healthy young adults. J Sleep Res. 2007;16:170–80. doi: 10.1111/j.1365-2869.2007.00594.x. [DOI] [PubMed] [Google Scholar]
- 6.Bachmann V, Klaus F, Bodenmann S, et al. Functional ADA polymorphism increases sleep depth and reduces vigilant attention in humans. Cereb Cortex. 2012;22:962–70. doi: 10.1093/cercor/bhr173. [DOI] [PubMed] [Google Scholar]
- 7.Bodenmann S, Hohoff C, Freitag C, et al. Polymorphisms of ADORA2A modulate psychomotor vigilance and the effects of caffeine on neurobehavioural performance and sleep EEG after sleep deprivation. Br J Pharmacol. 2012;165:1904–13. doi: 10.1111/j.1476-5381.2011.01689.x. [DOI] [PMC free article] [PubMed] [Google Scholar]
- 8.Viola AU, Archer SN, James LM, et al. PER3 polymorphism predicts sleep structure and waking performance. Curr Biol. 2007;17:613–8. doi: 10.1016/j.cub.2007.01.073. [DOI] [PubMed] [Google Scholar]
- 9.Bodenmann S, Xu S, Luhmann UF, et al. Pharmacogenetics of modafinil after sleep loss: catechol-O-methyltransferase genotype modulates waking functions but not recovery sleep. Clin Pharmacol Ther. 2009;85:296–304. doi: 10.1038/clpt.2008.222. [DOI] [PubMed] [Google Scholar]
- 10.Goel N, Banks S, Mignot E, Dinges DF. DQB1*0602 predicts interindividual differences in physiologic sleep, sleepiness, and fatigue. Neurology. 2010;75:1509–19. doi: 10.1212/WNL.0b013e3181f9615d. [DOI] [PMC free article] [PubMed] [Google Scholar]
- 11.Bachmann V, Klein C, Bodenmann S, et al. The BDNF Val66Met polymorphism modulates sleep intensity: EEG frequency- and state-specificity. Sleep. 2012;35:335–44. doi: 10.5665/sleep.1690. [DOI] [PMC free article] [PubMed] [Google Scholar]
- 12.Caldwell JA, Mu Q, Smith JK, et al. Are individual differences in fatigue vulnerability related to baseline differences in cortical activation? Behav Neurosci. 2005;119:694–707. doi: 10.1037/0735-7044.119.3.694. [DOI] [PubMed] [Google Scholar]
- 13.Chee MW, Chuah LY, Venkatraman V, Chan WY, Philip P, Dinges DF. Functional imaging of working memory following normal sleep and after 24 and 35 h of sleep deprivation: Correlations of fronto-parietal activation with performance. Neuroimage. 2006;31:419–28. doi: 10.1016/j.neuroimage.2005.12.001. [DOI] [PubMed] [Google Scholar]
- 14.Chuah YM, Venkatraman V, Dinges DF, Chee MW. The neural basis of interindividual variability in inhibitory efficiency after sleep deprivation. J Neurosci. 2006;26:7156–62. doi: 10.1523/JNEUROSCI.0906-06.2006. [DOI] [PMC free article] [PubMed] [Google Scholar]
- 15.Mu Q, Mishory A, Johnson KA, et al. Decreased brain activation during a working memory task at rested baseline is associated with vulnerability to sleep deprivation. Sleep. 2005;28:433–46. doi: 10.1093/sleep/28.4.433. [DOI] [PubMed] [Google Scholar]
- 16.Rajaraman S, Gribok AV, Wesensten NJ, Balkin TJ, Reifman J. An improved methodology for individualized performance prediction of sleep-deprived individuals with the two-process model. Sleep. 2009;32:1377–92. doi: 10.1093/sleep/32.10.1377. [DOI] [PMC free article] [PubMed] [Google Scholar]
- 17.Van Dongen HP, Mott CG, Huang JK, Mollicone DJ, McKenzie FD, Dinges DF. Optimization of biomathematical model predictions for cognitive performance impairment in individuals: accounting for unknown traits and uncertain states in homeostatic and circadian processes. Sleep. 2007;30:1129–43. doi: 10.1093/sleep/30.9.1129. [DOI] [PMC free article] [PubMed] [Google Scholar]
- 18.Horne JA, Ostberg O. A self-assessment questionnaire to determine morningness-eveningness in human circadian rhythms. Int J Chronobiol. 1976;4:97–110. [PubMed] [Google Scholar]
- 19.Buysse DJ, Reynolds CF, III, Monk TH, Berman SR, Kupfer DJ. The Pittsburgh Sleep Quality Index: a new instrument for psychiatric practice and research. Psychiatry Res. 1989;28:193–213. doi: 10.1016/0165-1781(89)90047-4. [DOI] [PubMed] [Google Scholar]
- 20.Duffy JF, Dijk DJ. Getting through to circadian oscillators: why use constant routines? J Biol Rhythms. 2002;17:4–13. doi: 10.1177/074873002129002294. [DOI] [PubMed] [Google Scholar]
- 21.Akerstedt T, Gillberg M. Subjective and objective sleepiness in the active individual. Int J Neurosci. 1990;52:29–37. doi: 10.3109/00207459008994241. [DOI] [PubMed] [Google Scholar]
- 22.Babkoff H, Caspy T, Mikulincer M. Subjective sleepiness ratings: the effects of sleep deprivation, circadian rhythmicity and cognitive performance. Sleep. 1991;14:534–9. doi: 10.1093/sleep/14.6.534. [DOI] [PubMed] [Google Scholar]
- 23.Dinges DF, Powell JW. Microcomputer analyses of performance on a portable simple visual RT task during sustained operations. Behav Res Meth Instr Comp. 1985;17:652–5. [Google Scholar]
- 24.Van Dongen HP, Belenky G. Individual differences in vulnerability to sleep loss in the work environment. Ind Health. 2009;47:518–26. doi: 10.2486/indhealth.47.518. [DOI] [PubMed] [Google Scholar]
- 25.Chua EC, Tan WQ, Yeo SC, et al. Heart rate variability can be used to estimate sleepiness-related decrements in psychomotor vigilance during total sleep deprivation. Sleep. 2012;35:325–34. doi: 10.5665/sleep.1688. [DOI] [PMC free article] [PubMed] [Google Scholar]
- 26.Rechtschaffen A, Kales A. A manual of standardized terminology, techniques and scoring system for sleep stages of human subjects. Bethesda, MD: National Institutes of Health; 1968. [Google Scholar]
- 27.Anderer P, Gruber G, Parapatics S, et al. An E-health solution for automatic sleep classification according to Rechtschaffen and Kales: validation study of the Somnolyzer 24 x 7 utilizing the Siesta database. Neuropsychobiology. 2005;51:115–33. doi: 10.1159/000085205. [DOI] [PubMed] [Google Scholar]
- 28.Benitez D, Gaydecki PA, Zaidi A, Fitzpatrick AP. The use of the Hilbert transform in ECG signal analysis. Comput Biol Med. 2001;31:399–406. doi: 10.1016/s0010-4825(01)00009-9. [DOI] [PubMed] [Google Scholar]
- 29.Task Force of the European Society of Cardiology and the North American Society of Pacing and Electrophysiology. Heart rate variability: standards of measurement, physiological interpretation and clinical use. Circulation. 1996;93:1043–65. [PubMed] [Google Scholar]
- 30.Moody G.B. Spectral analysis of heart rate without resampling. Computers in Cardiology. 1993;20:715–8. [Google Scholar]
- 31.Dinges DF, Mallis M, Maislin G, Powell JW. Final report: Evaluation of techniques for ocular measurement as an index of fatigue and the basis for alertness management. Washington, DC: National Highway Traffic Safety Administration; 1998. Report No. DOT HS 808 762. [Google Scholar]
- 32.Hammoud RI, Zhang H. Alertometer: Detecting and mitigating driver drowsiness and fatigue using an integrated human factors and computer vision approach. In: Hammoud RI, editor. Passive eye monitoring: Algorithms, applications and experiments. Springer; 2008. pp. 301–22. [Google Scholar]
- 33.Brown EN, Czeisler CA. The statistical analysis of circadian phase and amplitude in constant-routine core-temperature data. J Biol Rhythms. 1992;7:177–202. doi: 10.1177/074873049200700301. [DOI] [PubMed] [Google Scholar]
- 34.Ebisawa T, Uchiyama M, Kajimura N, et al. Association of structural polymorphisms in the human period3 gene with delayed sleep phase syndrome. EMBO Rep. 2001;2:342–6. doi: 10.1093/embo-reports/kve070. [DOI] [PMC free article] [PubMed] [Google Scholar]
- 35.Aeschbach D, Postolache TT, Sher L, Matthews JR, Jackson MA, Wehr TA. Evidence from the waking electroencephalogram that short sleepers live under higher homeostatic sleep pressure than long sleepers. Neuroscience. 2001;102:493–502. doi: 10.1016/s0306-4522(00)00518-2. [DOI] [PubMed] [Google Scholar]
- 36.Groeger JA, Viola AU, Lo JC, von SM, Archer SN, Dijk DJ. Early morning executive functioning during sleep deprivation is compromised by a PERIOD3 polymorphism. Sleep. 2008;31:1159–67. [PMC free article] [PubMed] [Google Scholar]
- 37.Chee MW, Tan JC, Zheng H, et al. Lapsing during sleep deprivation is associated with distributed changes in brain activation. J Neurosci. 2008;28:5519–28. doi: 10.1523/JNEUROSCI.0733-08.2008. [DOI] [PMC free article] [PubMed] [Google Scholar]
- 38.Bonnet MH, Arand DL. Hyperarousal and insomnia: state of the science. Sleep Med Rev. 2010;14:9–15. doi: 10.1016/j.smrv.2009.05.002. [DOI] [PubMed] [Google Scholar]
- 39.Wolynczyk-Gmaj D, Szelenberger W. Waking EEG in primary insomnia. Acta Neurobiol Exp (Wars) 2011;71:387–92. doi: 10.55782/ane-2011-1860. [DOI] [PubMed] [Google Scholar]
- 40.Merica H, Blois R, Gaillard JM. Spectral characteristics of sleep EEG in chronic insomnia. Eur J Neurosci. 1998;10:1826–34. doi: 10.1046/j.1460-9568.1998.00189.x. [DOI] [PubMed] [Google Scholar]
- 41.Finelli LA, Baumann H, Borbely AA, Achermann P. Dual electroencephalogram markers of human sleep homeostasis: correlation between theta activity in waking and slow-wave activity in sleep. Neuroscience. 2000;101:523–9. doi: 10.1016/s0306-4522(00)00409-7. [DOI] [PubMed] [Google Scholar]
- 42.Retey JV, Adam M, Honegger E, et al. A functional genetic variation of adenosine deaminase affects the duration and intensity of deep sleep in humans. Proc Natl Acad Sci U S A. 2005;102:15676–81. doi: 10.1073/pnas.0505414102. [DOI] [PMC free article] [PubMed] [Google Scholar]
- 43.Van Dongen HP, Maislin G, Mullington JM, Dinges DF. The cumulative cost of additional wakefulness: dose-response effects on neurobehavioral functions and sleep physiology from chronic sleep restriction and total sleep deprivation. Sleep. 2003;26:117–26. doi: 10.1093/sleep/26.2.117. [DOI] [PubMed] [Google Scholar]
- 44.Goel N, Banks S, Lin L, Mignot E, Dinges DF. Catechol-O-methyltransferase Val158Met polymorphism associates with individual differences in sleep physiologic responses to chronic sleep loss. PLoS One. 2011;6:e29283. doi: 10.1371/journal.pone.0029283. [DOI] [PMC free article] [PubMed] [Google Scholar]
- 45.Kuna ST, Maislin G, Pack FM, et al. Heritability of performance deficit accumulation during acute sleep deprivation in twins. Sleep. 2012;35:1223–33. doi: 10.5665/sleep.2074. [DOI] [PMC free article] [PubMed] [Google Scholar]
- 46.Rupp TL, Wesensten NJ, Balkin TJ. Trait-like vulnerability to total and partial sleep loss. Sleep. 2012;35:1163–72. doi: 10.5665/sleep.2010. [DOI] [PMC free article] [PubMed] [Google Scholar]
- 47.Frey DJ, Badia P, Wright KP., Jr Inter- and intra-individual variability in performance near the circadian nadir during sleep deprivation. J Sleep Res. 2004;13:305–15. doi: 10.1111/j.1365-2869.2004.00429.x. [DOI] [PubMed] [Google Scholar]
- 48.Silverman K, Evans SM, Strain EC, Griffiths RR. Withdrawal syndrome after the double-blind cessation of caffeine consumption. N Engl J Med. 1992;327:1109–14. doi: 10.1056/NEJM199210153271601. [DOI] [PubMed] [Google Scholar]
- 49.Buckner RL, Andrews-Hanna JR, Schacter DL. The brain's default network: anatomy, function, and relevance to disease. Ann N Y Acad Sci. 2008;1124:1–38. doi: 10.1196/annals.1440.011. [DOI] [PubMed] [Google Scholar]
- 50.Drummond SP, Bischoff-Grethe A, Dinges DF, Ayalon L, Mednick SC, Meloy MJ. The neural basis of the psychomotor vigilance task. Sleep. 2005;28:1059–68. [PubMed] [Google Scholar]
- 51.De Havas JA, Parimal S, Soon CS, Chee MW. Sleep deprivation reduces default mode network connectivity and anti-correlation during rest and task performance. Neuroimage. 2012;59:1745–51. doi: 10.1016/j.neuroimage.2011.08.026. [DOI] [PubMed] [Google Scholar]
- 52.Samann PG, Tully C, Spoormaker VI, et al. Increased sleep pressure reduces resting state functional connectivity. MAGMA. 2010;23:375–89. doi: 10.1007/s10334-010-0213-z. [DOI] [PubMed] [Google Scholar]