

Abstract
Study Objectives:
Given the detailed respiratory waveform signal provided by the nasal cannula in polysomnographic (PSG) studies, to quantify sleep breathing disturbances by extracting a continuous variable based on the coefficient of variation of the envelope of that signal.
Design:
Application of an algorithm for envelope analysis to standard nasal cannula signal from actual polysomnographic studies.
Setting:
PSG recordings from a sleep disorders center were analyzed by an algorithm developed on the Igor scientific data analysis software.
Patients or Participants:
Recordings representative of different degrees of sleep disordered breathing (SDB) severity or illustrative of the covariation between breathing and particularly relevant factors and variables.
Interventions:
The method calculated the coefficient of variation of the envelope for each 30-second epoch. The normalized version of that coefficient was defined as the respiratory disturbance variable (RDV). The method outcome was the all-night set of RDV values represented as a time series.
Measurements and Results:
RDV quantitatively reflected departure from normal sinusoidal breathing at each epoch, providing an intensity scale for disordered breathing. RDV dynamics configured itself in recognizable patterns for the airflow limitation (e.g., in UARS) and the apnea/hypopnea regimes. RDV reliably highlighted clinically meaningful associations with staging, body position, oximetry, or CPAP titration.
Conclusions:
Respiratory disturbance variable can assess sleep breathing disturbances as a gradual phenomenon while providing a comprehensible and detailed representation of its dynamics. It may thus improve clinical diagnosis and provide a revealing descriptive tool for mechanistic sleep disordered breathing modeling. Respiratory disturbance variable may contribute to attaining simplified screening methodologies, novel diagnostic criteria, and insightful research tools.
Citation:
Díaz JA; Arancibia JM; Bassi A; Vivaldi EA. Envelope analysis of the airflow signal to improve polysomnographic assessment of sleep disordered breathing. SLEEP 2014;37(1):199-208.
Keywords: Signal envelope analysis, polysomnography, nasal cannula / pressure, transducer, medical informatics applications, upper airway resistance sleep apnea syndrome, sleep apnea syndromes
INTRODUCTION
Given the drastic impact on morbidity and mortality,1–9 increasing prevalence,3,10–13 and efficient treatability of sleep disordered breathing (SDB),3,14–16 improving its diagnostic procedures is a relevant health goal. SDB includes obstructive sleep apnea (OSA)17 and upper airway resistance syndrome (UARS).17,18 Currently, both diagnoses are assessed through polysomnography by detecting and counting abnormal respiratory events such as apneas, hypopneas and respiratory effort-related arousals (RERAs). The apnea-hypopnea index (AHI)17,19,20 is considered the standard measure for case identification, severity quantification, and prevalence assessment.17,19,21 Nonetheless, defining respiratory events has remained a controversial subject, particularly with hypopneas.
The search for event thresholds that differentiate normal from abnormal breathing in a physiologically and clinically meaningful manner entails several issues. Firstly, signals obtained from standard PSG airflow sensors, including nasal cannula pressure transducers and thermistors,19 are uncalibrated and prone to scale fluctuations, yielding nonlinear relationships with pneumotachography data, the gold standard for airflow measurement.17,21,22 Accordingly, event definitions based on a given decrease of signal amplitude are inherently arbitrary. This uncertainty prompted the use of corroborative data such as oxhyhemoglobin desaturation or EEG arousal to judge the pathophysiological relevance of assumed hypopneas or even more subtle airflow limitation episodes. These additional variables fall short of solving the issue; the threshold of pathophysiological relevance for a desaturation event remains a matter of disagreement, as does the reliability of EEG arousal detection.21 As a consequence there is still much inter-laboratory disparity over the criteria used to measure sleep breathing disruption in PSG.20,23,24 Several reports conclude that different hypopnea definitions lead to marked discrepancies in AHI.25–29 This lack of consistency hampers disease identification, severity grading, and inter-laboratory report agreement.
Departing from event-oriented paradigms, we have developed an alternative method for quantifying sleep respiratory disturbance. In our approach a continuous variable represents the main morphological features of the airflow signal monitored by a nasal-pressure cannula. The method takes full advantage of the sensitivity of this device which, although non-calibrated, provides a respiratory waveform whose morphology approximates that obtained by direct airflow measurements.30,31 Moreover, the method circumvents instrumental liability, a major shortcoming of the current approach. These properties are at the basis of the reliability of our technique and of its suitability for computer-assisted analysis. This report provides illustrative examples of its application to actual SDB records.
METHODS
Data Collection
The data presented in this report to illustrate the procedures and results of the proposed method were obtained from routine clinical PSGs in the database of project FONIS SA10I20034, CONICYT, Chile, Automated analysis of bioelectric signals: application to polysomnography in the diagnosis of OSA (www.conicyt.cl/fonis/). The database contained 71 PSGs that included 15 non OSA studies (AHI < 5). The mild, moderate, and severe OSA categories determined by AHI standard breakpoints of 5, 15, and 30, included 19, 19, and 18 PSGs, respectively. The project was approved by the Human Research Ethics Committee of the Faculty of Medicine, University of Chile.
Standard PSG Procedures
Routine clinical PSGs had been recorded using Alice 5 Sleepware (Respironics, Pennsylvania, USA). The variables monitored were: electroencephalogram (F3/M1, F4/M2, C3/ M1, C4/M2, O1/M1 and O2/M2); left and right electrooculogram; submental electromyogram; nasal pressure signal (pressure transducer airflow [PTAF]) and nasal/ oral thermistor; oximetry; unipolar electrocardiogram; thoracic and abdominal excursion (piezoelectric strain gauges); body position; and eventually, CPAP pressure. Electrode placement complied with the 2007 AASM standards.19
Expert PSG Scoring
Sleep staging and respiratory disturbance scoring for each PSG had been performed by an expert, following the 2007 AASM standards.19 These outputs were conventionally summarized in hypnograms and AHIs.
Data Visualization and Analysis
A software for PSG visualization and analysis was implemented in IgorPro V6.22 data analysis and programming environment (Wavemetrics, Lake Oswego, OR). All PSG signals were loaded directly from native binary files readily exported from the Alice 5 System. Among those signals were the 6 EEG channels, nasal cannula (PTAF), oxygen saturation, body position, and CPAP pressure.
Spectrogram Computation
Central EEG channel (C3/M1) underwent FFT processing according to Welch method using Hanning-tapered 4s-windows with 50% overlapping. Frequencies > 30 Hz were discarded. The resulting spectrogram was log scaled and aggregated in 30-s epoch averages. The spectrogram was normalized by subtracting a model of background noise, which corresponds to the 5% lower percentile of the log power distribution for each frequency bin.
RDV Computation
The nasal-cannula (PTAF) signal was analyzed using a sliding window procedure with 30-s span and 10-s steps. Each 30s-window was band-filtered (0.05 Hz-5 Hz) using a built-in fourth-order digital Butterworth filter implemented in IgorPro. From that filtered signal (fs), the Hilbert transform was obtained (HTfs) using the built-in operation implemented and documented in IgorPro. The filtered signal envelope (fse) was then computed following a standard calculation: fse = √(fs2 + HTfs2). The mean (μ) and standard deviation (sd) of fse as well as their ratio, the coefficient of variation of the envelope (CVE = sd/μ), were calculated for each 30-s window. We defined RDV as a normalized version of CVE, dividing it by √(4/π - 1) ≈ 0.523. In addition, we obtained an alternative version of RDV from a smoothed fse, by a convolution with a Gaussian kernel that spanned 3 s. We defined the RDV-spread as the span between both RDVs. The RDV data that had been originally calculated in 30-s windows using 10-s steps was down-sampled, selecting the highest RDV every 3 points, resulting in one RDV value (and its corresponding spread) for each 30-s epoch.
Relating RDV to AHI
RDV was calculated for 24 all-night PSG studies, 6 from each of 4 categories: none, mild, moderate, and severe OSA. Respiratory events and their duration were determined for each study. The full length PSG studies were segmented according to RDV values. The RDV range 0.50-4.00 was subdivided into 14 categories using 0.25-unit grouping intervals. For each RDV category the specific AHI was calculated as events per hour, just as in routine PSG reports this calculation is performed for subsets within the full-night study representing categories such as sleep stage or body position. In addition to specific AHI, a time-in-event fraction was calculated to reflect the fraction of the total time spent in a given RDV category that had been occupied by hypopneas or apneas. Since there were 14 possible RDV categories in 24 PSG studies, up to 336 groups could be configured to provide data points for specific AHI and time-in-event fraction analysis. Only groups ≥ 10 epochs were kept for further analysis—a criterion that resulted in 197 validated data points. Simple linear regression models were calculated with RDV as the regressor and either specific AHI or time-in-event fraction as the regressand. The coefficient of determination (R-squared) assessed the goodness-of-fit of the regressions.
Relating RDV to the Evolution of Other PSG Variables
To assess the relationship between RDV and factors potentially determinant for SDB, RDV was calculated separately for the categories of those factors: sleep state REM and NREM, body position supine and lateral, oxygen saturation in 3 categories using 90% and 95% as breakpoints, and CPAP pressure. Results are expressed as mean ± standard error of mean (SEM), and categories of the explanatory variable are compared by one-way ANOVAs and Bonferroni post hoc analysis.
RESULTS
Application of Envelope Analysis to Respiratory Assessment in Humans
Visual inspection of the PSG airflow signal can be conceived as the assessment of its amplitude modulation. This task can in turn be seen as the perceptual equivalent to the extraction of the signal envelope, analytically performed using the Hilbert Transform. Previous work has shown that the coefficient of variation of the envelope (CVE) is a particularly informative descriptor for differentiating several envelope profiles generated by dynamic systems (Figure 1A-C).32 CVE is the quotient between the standard deviation and the mean of the signal envelope. In the CVE scale the lower end takes the value zero, which describes perfectly sinusoidal oscillations (of any frequency) given that their envelopes are totally flat. The upper end is given by a single impulse signal (Dirac delta), in which the relative dispersion of the envelope is maximum. Another referential value in the CVE scale emerges from randomly generated noise signals (Gaussian noise or any filtered sub-band), which takes the value 0.523.32 This constant theoretically corresponds to sqrt(4/π - 1), which is the coefficient of variation of the Rayleigh distribution.33 This value is also the reference that discerns 2 other categories: regular synchronous oscillations with CVEs below 0.523, and unsteady pulsating oscillations with CVEs greater than 0.523.32 The work reported here was prompted by the observation that archetypical normal respiratory patterns exhibit morphological similarities with synchronous oscillations just as disturbed respiration does with pulsating oscillations (Figure 1D-F). In order to use the CVE scale to evaluate the breathing signal, we define the respiratory disturbance variable (RDV) as the result of normalizing the CVE in a scale having as unit the constant 0.523, i.e., RDV = CVE/0.523. In the RDV scale, the value that distinguishes regular synchronous oscillations from unsteady pulsating oscillations is 1.0.
Figure 1.
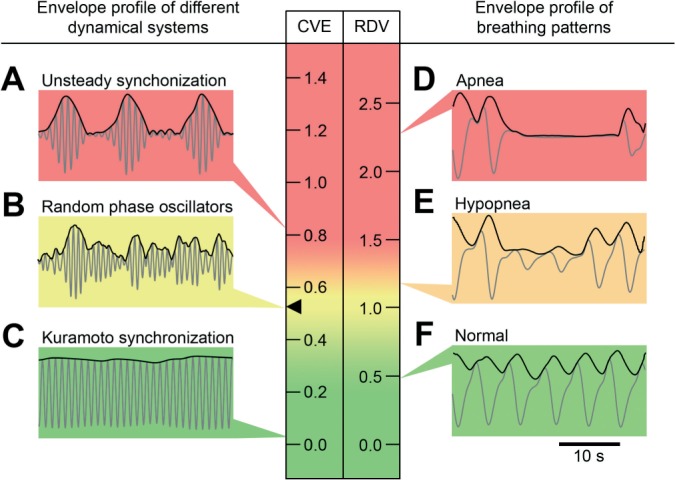
Signal analysis based on the coefficient of variation of the envelope (CVE). Signals are presented as gray traces and envelopes as black traces. Scales for the CVE and the respiratory disturbance variable (RDV = CVE/0.523) are color coded in a rising gradient from green to yellow to red. The value 0.523 (black arrowhead) corresponds to the coefficient of variation of the Rayleigh distribution. Insets on the left: signals and envelopes generated by different dynamical system models: (A) Unsteady synchronization, one of the complex dynamic system behaviors reported by Matthews et al.63 (B) Random phase oscillators. (C) Synchronous behavior of the Kuramoto model64 with an overcritical coupling constant. Insets on the right: 30-second representative segments of the airflow signal and its envelopes. (D) Apnea. (E) Hypopnea. (F) Normal breathing. Each inset points to the CVE or RDV value of the signal envelope in the scale.
Breathing Patterns Assessed by RDV
Figure 2 illustrates how RDV accounts for key morphological aspects of the breathing signal by displaying 15 representative traces of actual airflow recordings. For every trace the middle 30-s window has been framed with the computed envelope overlaid and highlighted. For each envelope the calculated RDV is displayed. A label was added to indicate how the windowed trace was scored according to standard criteria.19 We chose 30 sec as the window span because this has the advantage of being the standard epoch length for staging human polysomnograms. However, we explored different epoch lengths, obtaining consistent results in the range between 20 and 90 sec (not shown). Cases are ranked by their RDV to make evident the parallel between RDV increment and the visual assessment of respiratory disruption both in amplitude and duration.
Figure 2.

Characterization of breathing signal morphology by RDV. Representative examples of respiratory airflow recording are displayed as gray traces. The signal envelope is graphed as a black trace, boxed in a central 30-second window. The actual calculated RDV for each envelope is indicated on the right. Each panel is labeled as “no-event,” “hypopnea,” or “apnea,” according to how it would have been scored following AASM criteria.19 Cases are ranked by their RDV. (A-F) Respiratory patterns that would have not been considered as respiratory events. Note that D, despite its regularity, exhibits a characteristic airflow limitation pattern that yields a relatively high RDV. (G-O) Respiratory patterns related to hypopneas and apneas of increasing severity.
Normal breathing such as that of Figure 2A, which is almost regular and with rounded contours, displays little envelope fluctuations and yields a low RDV. At the other extreme, Traces 2K-O display marked envelope fluctuations associated with apneas, thus the longer the apnea, the greater the value of RDV. Figure 2A-F presents respiratory patterns below the hypopnea or apnea threshold criteria. Nonetheless, differences in calculated RDVs suggest actual heterogeneity. The subtle perturbations seen in Figure 2B compared to Figure 2A result in a RDV increment. In Figure 2C, a brief and isolated narrowing in signal amplitude yields a further noticeable increase in RDV. As a matter of fact, Figure 2C-F features RDVs that progressively depart from zero. These correspond to breathing patterns that, although irregular, do not meet apnea or hypopnea definition criteria. Standard rules ascribe traces 2F and 2G to different categories, although both are quite similar, as appropriately reflected by their proximity in RDV values. The same occurs with traces 2J and 2K.
Figure 2D deserves special attention because, although it displays a very regular pattern, at the same time it departs markedly from the rounded contour of normal breathing. The rising inspiratory waveform is systematically interrupted by a notch. In clinical practice, this pattern suggests an underlying airflow limitation indicative of upper airway resistance, even in the absence of hypopneas.30,31 Stable and recurrent airflow limitation pattern is a prominent feature of UARS, a condition that drastically affects sleep quality.18,34–36 This distortion in inspiratory waveform becomes an additional source of envelope fluctuation that will be reflected in RDV. The implication is that RDV can increase either because of apnea and hypopnea-like patterns in which the breathing envelope changes through several cycles or because of the contour flattening linked to airflow limitation patterns where the envelope fluctuates within the breathing cycles. We refer to these situations as intercyclic or intracyclic envelope variability, respectively.
The relationship between RDV and qualitatively assessed disordered breathing severity was presented in Figure 2. This relationship can be statistically quantified by relating RDV to AHI, the conventional metrics of disturbed sleep breathing.
Figure 3 displays the relationship between RDV and specific AHI and between RDV and time-in-event fraction for 24 studies, 6 from each OSA group as explained in Methods. Note that, expectedly, while all groups contribute with data points to the lower RDV categories, only moderate and severe cases do so to the higher ones. Note also that for the 2 RDV categories below 1.0 (the threshold for breathing disruption of the method) both the specific AHI and the time-in-event fraction are always near zero. At the other end, the highest RDV categories concentrate the data points with both the highest incidence and the longest duration of disturbed breathing. Simple linear models using as regressor RDV in the range 1.0-4.0 explain a high proportion of the variability for both specific AHI and time-in-event ratio, with adjusted R-squared of 0.777 and 0.812, respectively (both P << 0.001).
Figure 3.
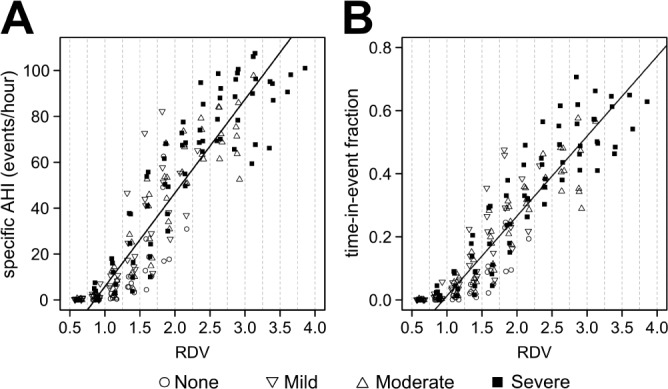
Scatter plots illustrate the relationship (A) between RDV and specific AHI and (B) between RDV and time-in-event fraction. Dashed lines delimit segments of a given RDV category, as explained in Methods. Each data point in (A) represents the specific AHI value obtained from the cumulated time that each of the 24 subjects spent in a given RDV category. The same occurs in (B) for variable time-in-event fraction. Symbols indicate the OSA case severity, based on the all-night AHI score of the case. Cases with none or mild OSA do not contribute with data points to the higher RDV categories. Almost all respiratory events occur with RDV > 1.0. Simple linear regressions were estimated and the fitted lines were displayed. In these calculations, only RDV > 1.0 were considered.
Understanding RDV Dynamics
When RDV is calculated over consecutive epochs, its dynamics can reveal several respiratory regimes. Each panel of Figure 4 shows in the left side graph a 25-min RDV analysis to illustrate different situations concerning intracyclic and inter-cyclic envelope variability. The right side graphs highlight the airflow signal and its envelope for a short representative fragment. As stated, an increase in RDV may be caused either by greater intercyclic or greater intracyclic envelope variability. To distinguish between these situations, a smoothing procedure was applied, aimed at removing the effect of intracyclic envelope dispersion. The second RDV thus obtained is sensitive only to intercyclic variability and therefore its curve is always lower than that of the RDV calculated over the original envelope. By following the temporal profile of the spread between the curves (RDV-spread), a more detailed insight of the complexity of respiratory dynamics is obtained.
Figure 4.
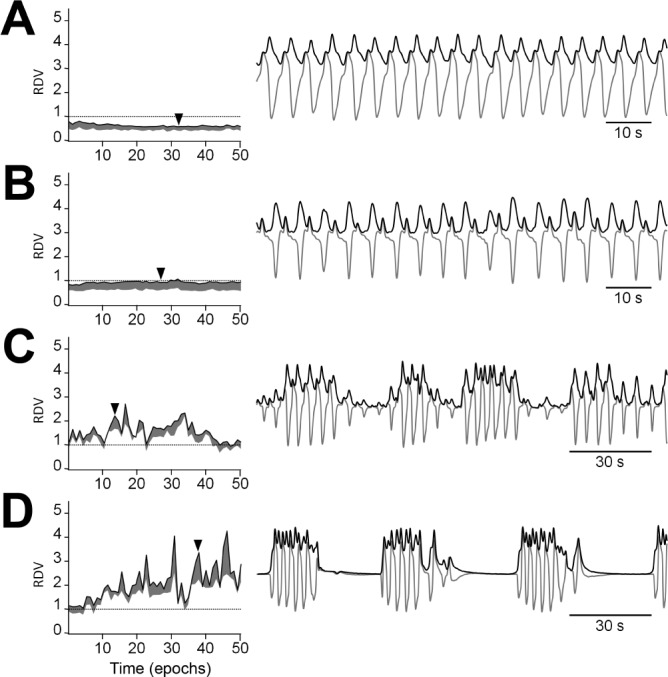
RDV time courses for representative examples of major SDB respiratory regimes. The left side graphs show 25-min spans of RDV and their spread. The right side graphs illustrate the airflow signal and its envelope for a short fragment whose temporal position is indicated by an arrowhead. (A) Normal breathing shows low RDVs, well below 1, with a narrow spread. (B) A sustained airflow limitation pattern shows a steady RDV around 1 with a wider spread. (C) A hypopnea-rich regime shows a jagged RDV curve approximately fluctuating between 1 and 2. (D) An apnea-rich regime shows sharp RDV peaks far above 2.
Figure 4A shows normal breathing with low intracyclic and low intercyclic dispersion. Consequently, RDV values are below 1.0 and display a narrow spread along the entire graph. The higher intracyclic variability of Figure 4B as compared to Figure 4A, is reflected by an RDV that, also being steady, is set at an appreciably higher level, close to 1.0, and presents a wider spread. Note that the respiratory signal accompanying Figure 4B displays a stable flattened airflow contour, as expected when upper airway resistance is increased. Figure 4C and Figure 4D illustrate the occurrence of intercyclic variability due to hypopneas and apneas, respectively. In both cases the RDV fluctuates drastically, reaching values well above 1.0 and displaying sharp breaks, reflecting the different disturbed morphologies encountered from epoch to epoch. These variants encompass a wide range of airflow signal profiles, from pure decrease of signal amplitude to a mixture of amplitude changes and contour flattening throughout the epoch.
Displaying RDV as All-Night Time Series
Sleep architecture, conventionally condensed in the hypno-gram, refers to the occurrence throughout the night of the 3 behavioral states: wakefulness, REM sleep, and NREM sleep; NREM sleep being further subdivided into the lighter stages N1 and N2 and the deeper stage N3.19 Figure 5 displays data from actual all-night recordings where RDV time series are plotted along with corresponding hypnograms and EEG spectrograms. The 4 cases represent increasing degrees of respiratory disturbance. EEG spectral analysis aims at identifying subtle respiratory-related cortical activation, which rather than being associated with standard visually detected EEG arousals are identified as variations in power density.37–39 Short segments of airflow signal and envelope are also shown. The histograms on the right side of each graph show the distribution of RDV. A red line is shown at 1.0, so that the fraction of the histogram above that line and the right side shoulder directly indicate the incidence of epochs with high RDV.
Figure 5.

RDV in the context of polysomnographic analysis. How the informative power of RDV enhances polysomnographic analysis is exemplified by one control case and three representative cases of SDB of increasing severity. Each panel shows the all-night RDV time course in the same time axis of an EEG spectrogram and its corresponding hypnogram. The insets on the right show the distribution of RDV for the whole study. Note that the more severe the case, the more right-shifted the RDV distribution. Bottom insets show airflow fragments whose temporal positions and corresponding RDV values are indicated by dashed lines. (A) Control case (AHI = 0.3) exhibiting normal sleep architecture and normal breathing. (B) UARS case (AHI = 3.6) with segments of flattened contour airflow profile. Three different respiratory regimes are highlighted: breathing in wakefulness, a sustained airflow limitation pattern, and transient airflow limitations associated to arousals. The upper inset is a segment of EEG featuring CAP activity, a marker of the electrocortical instability of UARS. (C) A state-dependent OSA case (AHI = 38.7) where apneas relate specifically to REM sleep. (D) A severe OSA case (AHI = 72.3) with long-lasting apneas.
Figure 5A exemplifies a normal respiratory pattern within normal sleep architecture. RDV is under 1.0 practically throughout the entire study, a fact confirmed by a narrow histogram barely exceeding that reference value. Baseline respiration is not necessarily homogeneous. For example, if we examine closely the interval between epochs 60 and 280, RDV consistently shows a low level during N3, while the observed spread reflects the intracyclic envelope variability (central inset) due to the physiologically expected increase in upper airway resistance in the transit from wakefulness to sleep.30,40 However, in transitions from N3 to N2 and during REM sleep in that same interval, due to some added intercyclic and intracyclic envelope variability (left and right insets), the RDV displays more fluctuations and reaches its highest values, occasionally exceeding 1.0. This is in agreement with results showing that highest increases in airflow resistance are observed during N2 and REM sleep.30 In the 110-min segment just analyzed, RDV is significantly lower (P < 0.001) for N3 (0.692 ± 0.010) than for N2 (0.781 ± 0.014) and REM (0.797 ± 0.016).
In Figure 5B the all-night RDV curve is centered on 1.0, a fact confirmed by the corresponding histogram. Several regimes can be recognized throughout the night. During quiet wakefulness, the RDV, although not perfectly stable, is always below 1.0 and displays a narrow spread. Afterwards, as transition from W to N2 occurs, the RDV curve becomes jagged, rising towards 1.0. Next, as N3 sleep ensues, RDV stabilizes around 1.0 while its spread widens, reflecting a sustained airflow limitation pattern (central bottom inset). Once NREM sleep returns to lighter stages, RDV remains near 1.0, but now it presents fluctuations and a slight decrease of its spread. This RDV instability obeys to recurrent interruptions of flow-limited breathing by more sinusoidal patterns (right bottom inset). This transient airflow limitation pattern is associated with RERA events,41 conventionally defined as an arousal followed by a decrease in respiratory effort. Expectedly, this RDV dynamics coincides with electrocortical instability, detected on the EEG with cyclic alternating pattern (CAP) analysis.42,43 The increase in the rate of A2 and A3 subtypes of CAP (exemplified in the upper inset by a sequence of phasic K-alpha complexes) is quantitatively reflected in the spectrogram as sustained increases in power density from the high and middle frequencies. It is worth noting that the A2 CAP phase is not included in the standard arousal scoring system, but the association of an increased rate of A2 phases with a recurrent flattening of the nasal cannula signal as seen here strongly supports UARS diagnosis.17,44 When the second N3 episode begins, the lowest sleep RDV is observed, as airflow disturbance temporarily fades out.
Figure 5C displays state-dependent sleep breathing disturbances. During NREM the RDV fluctuates below 2.0, due to different degrees of intercyclic envelope variability that result from hypopneas (left inset). REM sleep episodes that appear in the second half of the night are accompanied by major increases in intercyclic variability due to prolonged apneas (right inset). Hence RDV in REM sleep presents a jagged regime, with values often going over 4.0. RDV decreases again as sleep returns to NREM. RDV is highly state dependent, being significantly higher (P < 0.001) in REM (2.719 ± 0.091) than in NREM (1.209 ± 0.022). The corresponding specific AHI values were 58.3 and 29.8.
Figure 5D exemplifies an OSA case of uninterrupted high severity. The jagged RDV curve stays mostly over 2.0. The histogram displays a mode near 3.0 with a considerable number of epochs out of scale on the abscissa. The airflow inset exemplifies intercyclic envelope variability due to extremely long-lasting apneas (> 60 sec). Note that RDV dips only when sleep is interrupted by wakefulness episodes.
There is an increasing degree of severity in the 4 cases presented, with AHI values of 0.3, 3.6, 38.7, and 60.6. The corresponding mean ± SEM of RDV are 0.788 ± 0.006, 1.066 ± 0.009, 1.425 ± 0.027, and 3.312 ± 0.042 (P << 0.001). The histograms to the right provide an at-a-glance perception of RDV distributions. This visual impression can be reinforced and summarized by a single index, such as the just mentioned mean or some other statistic that can better account for positive skewness, such as p90. Percentile 90 for cases A to D is 0.970, 1.391, 2.515, and 4.929. Note that for the UARS case, the AHI is within normal range, whereas the RDV statistics are not.
Co-evolution of RDV and Other Variables
Figure 6 displays three cases that illustrate how RDV fluctuations relate to the dynamics of other PSG variables plotted in the same time axis. Note that in Figure 5 co-variations of RDV and sleep staging were already pointed out.
Figure 6.
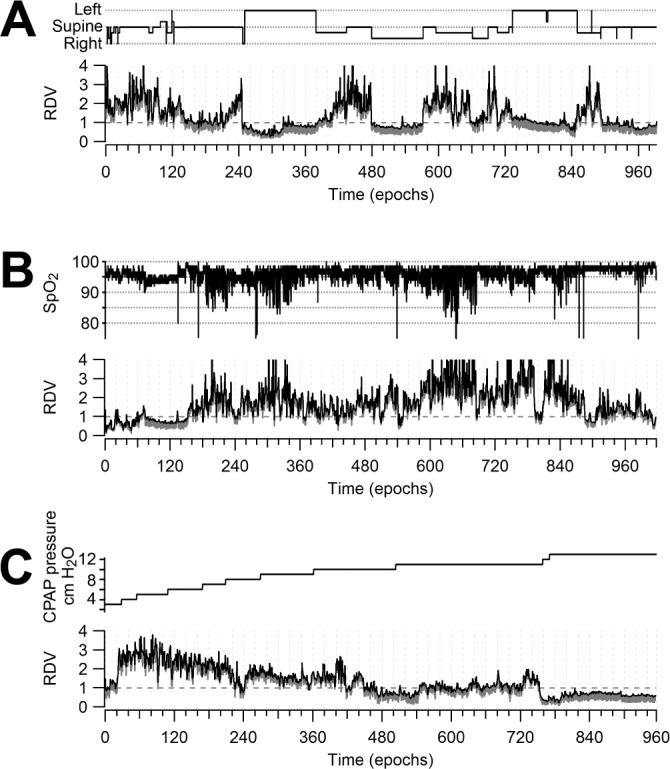
Relation of RDV to relevant polysomnographic variables. (A) RDV provides a global appraisal of the correlation between breathing disturbance and body position, with high values detected while the patient is in a supine position. (B) RDV confirms the respiratory origin of oxygen desaturation by remarkably mirroring the oximetry. (C) RDV allows an effective monitoring of breathing improvement during a CPAP titration with pressures going from 3 to 13 cm H2O.
Figure 6A illustrates the frequent association between respiratory disturbance and body position.45,46 RDV markedly increases when the patient assumes the supine position and it immediately falls under 1.0 when the patient adopts a lateral position, remaining stable at that level while this position is maintained. RDV is significantly higher (P < 0.001) in the supine (1.787 ± 0.031) than in the lateral (0.996 ± 0.022) position. The corresponding specific AHI values were 38.8 and 0.3.
Figure 6B displays another major parallel, that between respiratory disturbance and oximetry. Throughout the study RDV remarkably mirrors the oximetry. Note also that when the patient falls asleep there is a conspicuous increase in the RDV spread in correspondence with a drop in oximetry. RDV is significantly higher (P < 0.001) in the < 90% (2.521 ± 0.093) than in the ≥ 90% to < 95% (2.001 ± 0.044), which is in turn significantly higher than the ≥ 95% (1.523 ± 0.036) oxygen saturation ranges.
CPAP titration is a particular application of polysomnography aimed at determining its required therapeutic pressure level. Figure 6C illustrates a study testing pressures from 3 to 13 cm H2O. The RDV descends from its initial high level pari passu with pressure increments. RDV falls below 1.0 when the appropriate pressure level is achieved. RDV is significantly higher (P < 0.001) in post hoc comparisons between all contiguous descending pressure step categories. CPAP pressure ranges expressed in cm H2O, and the corresponding RDV values were: 3-5 (2.503 ± 0.063), 6-7 (2.200 ± 0.042), 8-9 (1.652 ± 0.022), 10-11 (1.193 ± 0.019), and 12-13 (0.767 ± 0.008).
RDV Invariance To Signal Scale
Frequently, changes in airflow signal scale during prolonged monitoring can originate in the sensors or in changes of body position and sleep state.17,21 When applying apnea and hypopnea conventional criteria, experts must infer those changes and adapt definitions accordingly. The upper trace of Figure 7 displays the amplitude of the respiratory signal as measured by its local root mean square. The lower trace shows that RDV remains unaffected when those changes occur. It is also observed that RDV accounts only for local (within the epoch) amplitude fluctuations etiologically related to actual respiratory disturbances as strongly suggested by concomitant drops in oximetry.
Figure 7.

RDV invariance to amplitude scaling. The three curves displayed are RDV, the root mean square (RMS) amplitude of the airflow signal and oximetry. At epoch 370 there is a marked airflow signal change, a common instrumental problem in polysomnography. This change is not reflected in the oximetry, suggesting its artifactual origin. Note that RDV remains unaffected by these signal variations, whereas actual airflow disruption, occurring within the epoch and caused by apneas and hypopneas, do co-vary with RDV as they do with oximetry.
DISCUSSION
Currently, SDB assessment is operationally based on the definition of respiratory events.17,19 In standard PSG these events are detected in the respiratory signals recorded with devices intended for clinical use. The recommended devices, thermal based sensors and nasal cannula pressure transducers, do not measure airflow directly and are susceptible to changes in signal scale.17,21,22 Consequently, the actual intensity of airflow reduction cannot be accurately quantified. Respiratory event definitions based on thresholds are thus questioned from the outset.
Challenging the event-oriented paradigm, our feature extraction method generates RDV, an epoch-based, normalized CVE analysis that characterizes the breathing signal. The analysis is performed on the nasal pressure cannula recording, a signal sensitive enough to reflect disturbances in respiratory waveforms even in the case of mild upper airway obstruction.30,31 Our results show the ability of RDV to synthesize and quantify this rich morphological detail, representing it in a continuous scale of respiratory disturbance, in contrast to the all-or-nothing event detection approach (Figure 2). Remarkably, by shifting the focus to the local signal morphology, RDV defines a metric that is invariant to changes in signal scale (Figure 7), and hence particularly suited for non-calibrated sensors.
The relationship between RDV and the occurrence of conventional respiratory events was tested by calculating in 24 all-night recordings the specific AHI within the cumulative time of a given RDV category. Results yielded a remarkable correlation between RDV and both specific AHI and variable time-in-event fraction (Figure 3). This outcome supports the proposition that RDV, by reflecting changes in incidence, amplitude, and duration of respiratory disturbances, appropriately quantifies the severity of the disturbances.
Empirically, in the RDV metric, the value 1.0 separates normal and apneic/hypopneic breathing patterns. RDV values around 1.0 correspond to intermediate disruptions, mostly mild hypopneas and flow limitation. They can be further differentiated by using RDV spread. Airflow limitation patterns, whose envelope variability is almost entirely intracyclic, display higher RDV spread than hypopneas.
Condensing the epoch-by-epoch analysis into a single graph facilitates the assessment of RDV dynamics and the visual appraisal of the SDB time course. Some major breathing regimes can be recognized as stereotyped RDV curves (Figure 4). Apneic/hypopneic regimes translate into jagged curves with values mostly above 1.0, whereas sustained airflow limitation regimes gives rise to a stationary curve near 1.0 with wide RDV spread. Regimes and transitions can be easily recognized within the all-night overview, while SDB severity can be further summarized by the RDV histogram (Figure 5). The all-night RDV graph provides two main benefits. First, it relates the time course of breathing patterns to those of many other relevant PSG variables (Figure 6). Since RDV quantifies departure from normal respiratory pattern as a continuous variable, it provides an objective, handy regressand for correlations with other informative variables throughout a complete study or selected intervals. Better judgment on how breathing disturbance is related to PLMs,47 cyclic alternating patterns,43,44 arousals interfering with sleep continuity, oximetry drops, snoring, and thoracic or abdominal increased effort. Such correlations, useful for decision making, are obtained much more fluidly using a continuous variable like RDV than by using a discrete variable like AHI. The latter can only set the time of occurrence and the incidence of predefined events, omitting judgment on their severity and ignoring subthreshold cases. Regressors may also be physiologic in nature, e.g., stage-dependent characterizations of respiratory patterns, particularly the description of REM patterns where covariates may include eye movement density; or changes in respiration that accompany body position. Secondly, RDV provides a detailed representation of breathing, not requiring additional signals to assess its disturbance. This parsimony has promising implications for simplifying ambulatory sleep studies, an area where breakthroughs are so much sought after.
It is accepted that the current event-oriented paradigm AHI correlates well with cardiovascular morbidity3,21 but poorly with cardinal SDB symptoms such as excessive daytime somnolence and insomnia.3,21,48 Seemingly, AHI limitations are more overt in the milder side of the severity spectrum, as with UARS. These limitations can be overcome by alternative clinical tools based on RDV. For instance, once RDVs have been calculated for each epoch and their distribution has been graphically displayed in histograms such as those of Figure 5 for qualitative visual assessment, indexes like the mean, mode, or some percentile of the distribution, or perhaps the fraction of all epochs with RDV values over 1.0 or can emerge as a statistical summarizer. As customary in PSG reports, these indexes can be calculated specifically for states, body position, and desaturation categories.
Concerning SDB pathophysiology, it has been stated that OSA occurs because ventilation during sleep is insufficient to prevent ventilatory drive from reaching the arousal threshold, thereby causing a respiratory effort-related arousal.49 Our method, by displaying RDV along with the EEG spectrogram, highlights the interrelation of breathing dynamics and cortical activity. It could be readily ascertained whether the threshold for triggering airflow resumption is above or below the arousal threshold, a relevant aspect when evaluating breathing-related sleep fragmentation and ventilatory stability.50–53
Breathing stability has been assessed during resting wakefulness by using the coefficient of variation for breath-to-breath inspiration time and by using sample entropy, an information theory-based metric of signal pattern.54 Those metrics account for apnea phenotypes of predominantly mixed, central, or obstructive sleep apnea syndromes. The morphology of breathing patterns assessed by those metrics provides an insight on the central control system of respiratory rhythm. It has also been demonstrated that these measurements can predict CPAP compliance and acceptance.54,55 The technique we are presenting is aimed primarily at describing breathing dynamics but can also be used to determine relevant patient phenotypes and subsequent implications for both OSA pathophysiology and clinical assessment.
Hence, our proposal can be contextualized within recent approaches that aim at both categorizing patient phenotypes and modeling how critical factors are involved in SDB pathogenesis. Quantitative models must emerge to define more precisely how specific traits engage in complex interactions, in order to foresee the triggering of SDB, i.e., how anatomic features and neuromuscular output, expressed in upper airway collapsibility and respiratory control stability, contribute to upper airway obstruction.49–53,56–62 These issues eloquently invite us to look beyond the restricted scope of AHI in the search for alternative objective summarizing measurements.
DISCLOSURE STATEMENT
This was not an industry supported study. Financial support for this study was from FONIS grants SA10I20034 and SA1212191. (FONIS is a branch of CONICYT, the Chilean National Commission for Scientific and Technological Research). The authors have indicated no financial conflicts of interest.
ACKNOWLEDGMENTS
The authors thank J.C. Letelier and P. Razeto-Barry who read the manuscript and provided valuable suggestions. Useful expert opinions were also provided by Ledda Aguilera, Oscar Carrasco, Gabriel Cavada and Mario Díaz.
REFERENCES
- 1.Duran J, Esnaola S, Rubio R, Iztueta A. Obstructive sleep apnea-hypopnea and related clinical features in a population-based sample of subjects aged 30 to 70 yr. Am J Respir Crit Care Med. 2001;163(3 Pt 1):685–9. doi: 10.1164/ajrccm.163.3.2005065. [DOI] [PubMed] [Google Scholar]
- 2.George CF. Sleep apnea, alertness, and motor vehicle crashes. Am J Respir Crit Care Med. 2007;176:954–6. doi: 10.1164/rccm.200605-629PP. [DOI] [PubMed] [Google Scholar]
- 3.Lee W, Nagubadi S, Kryger MH, Mokhlesi B. Epidemiology of obstructive sleep apnea: a population-based perspective. Expert Rev Respir Med. 2008;2:349–64. doi: 10.1586/17476348.2.3.349. [DOI] [PMC free article] [PubMed] [Google Scholar]
- 4.Nieto FJ, Young TB, Lind BK, et al. Association of sleep-disordered breathing, sleep apnea, and hypertension in a large community-based study. Sleep Heart Health Study. JAMA. 2000;283:1829–36. doi: 10.1001/jama.283.14.1829. [DOI] [PubMed] [Google Scholar]
- 5.Peppard PE, Szklo-Coxe M, Hla KM, Young T. Longitudinal association of sleep-related breathing disorder and depression. Arch Intern Med. 2006;166:1709–15. doi: 10.1001/archinte.166.16.1709. [DOI] [PubMed] [Google Scholar]
- 6.Peppard PE, Young T, Palta M, Skatrud J. Prospective study of the association between sleep-disordered breathing and hypertension. N Engl J Med. 2000;342:1378–84. doi: 10.1056/NEJM200005113421901. [DOI] [PubMed] [Google Scholar]
- 7.Quan SF, Wright R, Baldwin CM, et al. Obstructive sleep apnea-hypopnea and neurocognitive functioning in the Sleep Heart Health Study. Sleep Med. 2006;7:498–507. doi: 10.1016/j.sleep.2006.02.005. [DOI] [PubMed] [Google Scholar]
- 8.Yaggi HK, Concato J, Kernan WN, Lichtman JH, Brass LM, Mohsenin V. Obstructive sleep apnea as a risk factor for stroke and death. N Engl J Med. 2005;353:2034–41. doi: 10.1056/NEJMoa043104. [DOI] [PubMed] [Google Scholar]
- 9.Gami AS, Howard DE, Olson EJ, Somers VK. Day-night pattern of sudden death in obstructive sleep apnea. N Engl J Med. 2005;352:1206–14. doi: 10.1056/NEJMoa041832. [DOI] [PubMed] [Google Scholar]
- 10.Tishler PV, Larkin EK, Schluchter MD, Redline S. Incidence of sleep-disordered breathing in an urban adult population: the relative importance of risk factors in the development of sleep-disordered breathing. JAMA. 2003;289:2230–7. doi: 10.1001/jama.289.17.2230. [DOI] [PubMed] [Google Scholar]
- 11.Tufik S, Santos-Silva R, Taddei JA, Bittencourt LR. Obstructive sleep apnea syndrome in the Sao Paulo Epidemiologic Sleep Study. Sleep Med. 2010;11:441–6. doi: 10.1016/j.sleep.2009.10.005. [DOI] [PubMed] [Google Scholar]
- 12.Young T, Palta M, Dempsey J, Skatrud J, Weber S, Badr S. The occurrence of sleep-disordered breathing among middle-aged adults. N Engl J Med. 1993;328:1230–5. doi: 10.1056/NEJM199304293281704. [DOI] [PubMed] [Google Scholar]
- 13.Young T, Peppard PE, Gottlieb DJ. Epidemiology of obstructive sleep apnea: a population health perspective. Am J Respir Crit Care Med. 2002;165:1217–39. doi: 10.1164/rccm.2109080. [DOI] [PubMed] [Google Scholar]
- 14.Buchner NJ, Sanner BM, Borgel J, Rump LC. Continuous positive airway pressure treatment of mild to moderate obstructive sleep apnea reduces cardiovascular risk. Am J Respir Crit Care Med. 2007;176:1274–80. doi: 10.1164/rccm.200611-1588OC. [DOI] [PubMed] [Google Scholar]
- 15.Marin JM, Carrizo SJ, Vicente E, Agusti AG. Long-term cardiovascular outcomes in men with obstructive sleep apnoea-hypopnoea with or without treatment with continuous positive airway pressure: an observational study. Lancet. 2005;365:1046–53. doi: 10.1016/S0140-6736(05)71141-7. [DOI] [PubMed] [Google Scholar]
- 16.Weaver TE, Maislin G, Dinges DF, et al. Relationship between hours of CPAP use and achieving normal levels of sleepiness and daily functioning. Sleep. 2007;30:711–9. doi: 10.1093/sleep/30.6.711. [DOI] [PMC free article] [PubMed] [Google Scholar]
- 17.Cao MT, Guilleminault C, Kushida CA. Clinical features and evaluation of obstructive sleep apnea and upper airway resistance syndrome. In: Kryger MH, Roth T, Dement WC, editors. Principles and practice of sleep medicine. Philadelphia: Elsevier/Saunders; 2010. pp. 1206–18. [Google Scholar]
- 18.Guilleminault C, Stoohs R, Clerk A, Cetel M, Maistros P. A cause of excessive daytime sleepiness. The upper airway resistance syndrome. Chest. 1993;104:781–7. doi: 10.1378/chest.104.3.781. [DOI] [PubMed] [Google Scholar]
- 19.Iber C, Ancoli-Israel S, Chesson A, Quan SF. The AASM manual for the scoring of sleep and associated events: rules, terminology and technical specifications. Westchester, IL: American Academy of Sleep Medicine; 2007. [Google Scholar]
- 20.Redline S, Sanders M. Hypopnea, a floating metric: implications for prevalence, morbidity estimates, and case finding. Sleep. 1997;20:1209–17. doi: 10.1093/sleep/20.12.1209. [DOI] [PubMed] [Google Scholar]
- 21.Redline S, Budhiraja R, Kapur V, et al. The scoring of respiratory events in sleep: reliability and validity. J Clin Sleep Med. 2007;3:169–200. [PubMed] [Google Scholar]
- 22.Lorino AM, d'Ortho MP, Lofaso F. What actually is an obstructive sleep hypopnea? Sleep. 2000;23:151–3. [PubMed] [Google Scholar]
- 23.Moser NJ, Phillips BA, Berry DT, Harbison L. What is hypopnea, anyway? Chest. 1994;105:426–8. doi: 10.1378/chest.105.2.426. [DOI] [PubMed] [Google Scholar]
- 24.Meoli AL, Casey KR, Clark RW, et al. Hypopnea in sleep-disordered breathing in adults. Sleep. 2001;24:469–70. [PubMed] [Google Scholar]
- 25.Guilleminault C, Hagen CC, Huynh NT. Comparison of hypopnea definitions in lean patients with known obstructive sleep apnea hypopnea syndrome (OSAHS) Sleep Breath. 2009;13:341–7. doi: 10.1007/s11325-009-0253-7. [DOI] [PubMed] [Google Scholar]
- 26.Manser RL, Rochford P, Pierce RJ, Byrnes GB, Campbell DA. Impact of different criteria for defining hypopneas in the apnea-hypopnea index. Chest. 2001;120:909–14. doi: 10.1378/chest.120.3.909. [DOI] [PubMed] [Google Scholar]
- 27.Redline S, Kapur VK, Sanders MH, et al. Effects of varying approaches for identifying respiratory disturbances on sleep apnea assessment. Am J Respir Crit Care Med. 2000;161:369–74. doi: 10.1164/ajrccm.161.2.9904031. [DOI] [PubMed] [Google Scholar]
- 28.Ruehland WR, Rochford PD, O'Donoghue FJ, Pierce RJ, Singh P, Thornton AT. The new AASM criteria for scoring hypopneas: impact on the apnea hypopnea index. Sleep. 2009;32:150–7. doi: 10.1093/sleep/32.2.150. [DOI] [PMC free article] [PubMed] [Google Scholar]
- 29.Thornton AT, Singh P, Ruehland WR, Rochford PD. AASM criteria for scoring respiratory events: interaction between apnea sensor and hypopnea definition. Sleep. 2012;35:425–32. doi: 10.5665/sleep.1710. [DOI] [PMC free article] [PubMed] [Google Scholar]
- 30.Hosselet JJ, Norman RG, Ayappa I, Rapoport DM. Detection of flow limitation with a nasal cannula/pressure transducer system. Am J Respir Crit Care Med. 1998;157:1461–7. doi: 10.1164/ajrccm.157.5.9708008. [DOI] [PubMed] [Google Scholar]
- 31.Norman RG, Ahmed MM, Walsleben JA, Rapoport DM. Detection of respiratory events during NPSG: nasal cannula/pressure sensor versus thermistor. Sleep. 1997;20:1175–84. [PubMed] [Google Scholar]
- 32.Diaz J, Razeto-Barry P, Letelier JC, Caprio J, Bacigalupo J. Amplitude modulation patterns of local field potentials reveal asynchronous neuronal populations. J Neurosci. 2007;27:9238–45. doi: 10.1523/JNEUROSCI.4512-06.2007. [DOI] [PMC free article] [PubMed] [Google Scholar]
- 33.Papoulis A. Probability, random variables and stochastic processes. New York: McGraw-Hill; 1984. [Google Scholar]
- 34.Bao G, Guilleminault C. Upper airway resistance syndrome--one decade later. Curr Opin Pulm Med. 2004;10:461–7. doi: 10.1097/01.mcp.0000143689.86819.c2. [DOI] [PubMed] [Google Scholar]
- 35.Gold AR, Gold MS, Harris KW, Espeleta VJ, Amin MM, Broderick JE. Hypersomnolence, insomnia and the pathophysiology of upper airway resistance syndrome. Sleep Med. 2008;9:675–83. doi: 10.1016/j.sleep.2007.08.013. [DOI] [PubMed] [Google Scholar]
- 36.Guilleminault C, Poyares D, Rosa A, Kirisoglu C, Almeida T, Lopes MC. Chronic fatigue, unrefreshing sleep and nocturnal polysomnography. Sleep Med. 2006;7:513–20. doi: 10.1016/j.sleep.2006.03.016. [DOI] [PubMed] [Google Scholar]
- 37.Black JE, Guilleminault C, Colrain IM, Carrillo O. Upper airway resistance syndrome. Central electroencephalographic power and changes in breathing effort. Am J Respir Crit Care Med. 2000;162(2 Pt 1):406–11. doi: 10.1164/ajrccm.162.2.9901026. [DOI] [PubMed] [Google Scholar]
- 38.Guilleminault C, Do Kim Y, Chowdhuri S, Horita M, Ohayon M, Kushida C. Sleep and daytime sleepiness in upper airway resistance syndrome compared to obstructive sleep apnoea syndrome. Eur Respir J. 2001;17:838–47. doi: 10.1183/09031936.01.17508380. [DOI] [PubMed] [Google Scholar]
- 39.Poyares D, Guilleminault C, Rosa A, Ohayon M, Koester U. Arousal, EEG spectral power and pulse transit time in UARS and mild OSAS subjects. Clin Neurophysiol. 2002;113:1598–606. doi: 10.1016/s1388-2457(02)00214-6. [DOI] [PubMed] [Google Scholar]
- 40.Kay A, Trinder J, Bowes G, Kim Y. Changes in airway resistance during sleep onset. J Appl Physiol. 1994;76:1600–7. doi: 10.1152/jappl.1994.76.4.1600. [DOI] [PubMed] [Google Scholar]
- 41.Ayappa I, Norman RG, Krieger AC, Rosen A, O'Malley RL, Rapoport DM. Non-Invasive detection of respiratory effort-related arousals (RERAs) by a nasal cannula/pressure transducer system. Sleep. 2000;23:763–71. doi: 10.1093/sleep/23.6.763. [DOI] [PubMed] [Google Scholar]
- 42.Ferre A, Guilleminault C, Lopes MC. [Cyclic alternating pattern as a sign of brain instability during sleep] Neurologia. 2006;21:304–11. [PubMed] [Google Scholar]
- 43.Terzano MG, Parrino L, Smerieri A, et al. Atlas, rules, and recording techniques for the scoring of cyclic alternating pattern (CAP) in human sleep. Sleep Med. 2002;3:187–99. doi: 10.1016/s1389-9457(02)00003-5. [DOI] [PubMed] [Google Scholar]
- 44.Guilleminault C, Lopes MC, Hagen CC, da Rosa A. The cyclic alternating pattern demonstrates increased sleep instability and correlates with fatigue and sleepiness in adults with upper airway resistance syndrome. Sleep. 2007;30:641–7. doi: 10.1093/sleep/30.5.641. [DOI] [PubMed] [Google Scholar]
- 45.Oksenberg A, Silverberg DS. The effect of body posture on sleep-related breathing disorders: facts and therapeutic implications. Sleep Med Rev. 1998;2:139–62. doi: 10.1016/s1087-0792(98)90018-1. [DOI] [PubMed] [Google Scholar]
- 46.Oksenberg A, Silverberg DS, Arons E, Radwan H. Positional vs nonpositional obstructive sleep apnea patients: anthropomorphic, nocturnal polysomnographic, and multiple sleep latency test data. Chest. 1997;112:629–39. doi: 10.1378/chest.112.3.629. [DOI] [PubMed] [Google Scholar]
- 47.Stoohs RA, Blum HC, Suh BY, Guilleminault C. Misinterpretation of sleep-breathing disorder by periodic limb movement disorder. Sleep Breath. 2001;5:131–7. doi: 10.1007/s11325-001-0131-4. [DOI] [PubMed] [Google Scholar]
- 48.Macey PM, Woo MA, Kumar R, Cross RL, Harper RM. Relationship between obstructive sleep apnea severity and sleep, depression and anxiety symptoms in newly-diagnosed patients. PLoS One. 2010;5:e10211. doi: 10.1371/journal.pone.0010211. [DOI] [PMC free article] [PubMed] [Google Scholar]
- 49.Wellman A, Eckert DJ, Jordan AS, et al. A method for measuring and modeling the physiological traits causing obstructive sleep apnea. J Appl Physiol. 2011;110:1627–37. doi: 10.1152/japplphysiol.00972.2010. [DOI] [PMC free article] [PubMed] [Google Scholar]
- 50.Younes M. Role of arousals in the pathogenesis of obstructive sleep apnea. Am J Respir Crit Care Med. 2004;169:623–33. doi: 10.1164/rccm.200307-1023OC. [DOI] [PubMed] [Google Scholar]
- 51.Younes M, Ostrowski M, Atkar R, Laprairie J, Siemens A, Hanly P. Mechanisms of breathing instability in patients with obstructive sleep apnea. J Appl Physiol. 2007;103:1929–41. doi: 10.1152/japplphysiol.00561.2007. [DOI] [PubMed] [Google Scholar]
- 52.Younes M. Role of respiratory control mechanisms in the pathogenesis of obstructive sleep disorders. J Appl Physiol. 2008;105:1389–405. doi: 10.1152/japplphysiol.90408.2008. [DOI] [PubMed] [Google Scholar]
- 53.Owens R, Wellman A, Malhotra A. The chicken-or-egg debate in OSA pathogenesis. Sleep. 2009;32:1255–6. doi: 10.1093/sleep/32.10.1255. [DOI] [PMC free article] [PubMed] [Google Scholar]
- 54.Yamauchi M, Tamaki S, Yoshikawa M, et al. Differences in breathing patterning during wakefulness in patients with mixed apnea-dominant vs obstructive-dominant sleep apnea. Chest. 2011;140:54–61. doi: 10.1378/chest.10-1082. [DOI] [PMC free article] [PubMed] [Google Scholar]
- 55.Yamauchi M, Jacono FJ, Fujita Y, et al. Breathing irregularity during wakefulness associates with CPAP acceptance in sleep apnea. Sleep Breath. 2013;17:845–52. doi: 10.1007/s11325-012-0775-2. [DOI] [PubMed] [Google Scholar]
- 56.Eikermann M, Jordan AS, Chamberlin NL, et al. The influence of aging on pharyngeal collapsibility during sleep. Chest. 2007;131:1702–9. doi: 10.1378/chest.06-2653. [DOI] [PMC free article] [PubMed] [Google Scholar]
- 57.Jordan AS, Wellman A, Heinzer RC, et al. Mechanisms used to restore ventilation after partial upper airway collapse during sleep in humans. Thorax. 2007;62:861–7. doi: 10.1136/thx.2006.070300. [DOI] [PMC free article] [PubMed] [Google Scholar]
- 58.Jordan AS, White DP, Lo YL, et al. Airway dilator muscle activity and lung volume during stable breathing in obstructive sleep apnea. Sleep. 2009;32:361–8. doi: 10.1093/sleep/32.3.361. [DOI] [PMC free article] [PubMed] [Google Scholar]
- 59.Loewen A, Ostrowski M, Laprairie J, et al. Determinants of ventilatory instability in obstructive sleep apnea: inherent or acquired? Sleep. 2009;32:1355–65. doi: 10.1093/sleep/32.10.1355. [DOI] [PMC free article] [PubMed] [Google Scholar]
- 60.Wellman A, Malhotra A, Fogel RB, Edwards JK, Schory K, White DP. Respiratory system loop gain in normal men and women measured with proportional-assist ventilation. J Appl Physiol. 2003;94:205–12. doi: 10.1152/japplphysiol.00585.2002. [DOI] [PubMed] [Google Scholar]
- 61.Jordan AS, Wellman A, Edwards JK, et al. Respiratory control stability and upper airway collapsibility in men and women with obstructive sleep apnea. J Appl Physiol. 2005;99:2020–7. doi: 10.1152/japplphysiol.00410.2004. [DOI] [PMC free article] [PubMed] [Google Scholar]
- 62.Younes M. Contributions of upper airway mechanics and control mechanisms to severity of obstructive apnea. Am J Respir Crit Care Med. 2003;168:645–58. doi: 10.1164/rccm.200302-201OC. [DOI] [PubMed] [Google Scholar]
- 63.Matthews PC, Mirollo RE, Strogatz SH. Dynamics of a large system of coupled nonlinear oscillators. Physica D. 1991;52:293–331. [Google Scholar]
- 64.Strogatz S, H. From Kuramoto to Crawford: exploring the onset of synchronization in populations of coupled oscillators. Physica D. 2000;143:1–20. [Google Scholar]