

Abstract
PCR-ribotyping is a broadly used method for the classification of isolates of Clostridium difficile, an emerging intestinal pathogen, causing infections with increased disease severity and incidence in several European and North American countries. We have now carried out clustering analysis with selected genes of numerous C. difficile strains as well as gene content comparisons of their genomes in order to broaden our view of the relatedness of strains assigned to different ribotypes. We analyzed the genomic content of 48 C. difficile strains representing 21 different ribotypes. The calculation of distance matrix-based dendrograms using the neighbor joining method for 14 conserved genes (standard phylogenetic marker genes) from the genomes of the C. difficile strains demonstrated that the genes from strains with the same ribotype generally clustered together. Further, certain ribotypes always clustered together and formed ribotype groups, i.e. ribotypes 078, 033 and 126, as well as ribotypes 002 and 017, indicating their relatedness. Comparisons of the gene contents of the genomes of ribotypes that clustered according to the conserved gene analysis revealed that the number of common genes of the ribotypes belonging to each of these three ribotype groups were very similar for the 078/033/126 group (at most 69 specific genes between the different strains with the same ribotype) but less similar for the 002/017 group (86 genes difference). It appears that the ribotype is indicative not only of a specific pattern of the amplified 16S–23S rRNA intergenic spacer but also reflects specific differences in the nucleotide sequences of the conserved genes studied here. It can be anticipated that the sequence deviations of more genes of C. difficile strains are correlated with their PCR-ribotype. In conclusion, the results of this study corroborate and extend the concept of clonal C. difficile lineages, which correlate with ribotypes affiliation.
Introduction
Clostridium difficile is a Gram-positive, anaerobic, spore forming bacterium. It is responsible for a broad spectrum of intestinal diseases ranging from self-limiting diarrhoea to life-threatening pseudomembranous colitis [1]. Nosocomial transmission and the use of antibiotics are the main drivers of C. difficile infection [2].
In the past 10 years C. difficile infections with increased disease severity and incidence emerged especially in Canada, U.S.A. and Western Europe [3], [4]. These outbreaks were traced back to a C. difficile strain typed as PCR-ribotype 027. Strains with PCR-ribotype 027 are mainly so-called hypervirulent strains. The initial association with a hypertoxigenicity phenotype is still controversial and not confirmed in all studies [5].
PCR ribotyping is a typing method that is currently becoming a standard for C. difficile. It is defined by differences in the 16S–23S rRNA intergenic spacer sequences present on multiple copies within a single C. difficile chromosome [6], [7]. The mechanisms behind the variations in the 16S–23S rRNA intergenic spacer sequences have been proposed to be slipped-strand mispairing and intra- and possibly interchromosomal homologous recombination [8].
The prevalence of PCR-ribotypes is geographically correlated [9]. Recent comparative genomic studies about C. difficile focus on strains with PCR-ribotype 027, 078 and strains related to these ribotypes [10]–[14]. About 50% of all C. difficile infections in North America and the United Kingdom belonged to PCR-ribotype 027 during 2003 to 2005, whereas on the other hand only 5% of all CDIs in 34 European hospitals were typed as PCR-ribotype 027 in 2008 [11]. The most common PCR-ribotypes in Europe are 014/020 (16%), 001 (9%) and 078 (8%) [15]. The emergence of specific C. difficile strains is not understood until now. Comparative phylogenetic studies with 75 isolates of C. difficile led to the identification of three apparently hypervirulent clonal lineages (PCR-ribotype 017, PCR-ribotype 027 and PCR-ribotype 078) as well as a fourth heterogeneous grouping [16], which is in line with other studies [12], [17]. However, the term hypervirulence must be used rather carefully [18].
The finding of clonal lineages indicates that C. difficile strains with the same PCR-ribotype appear to be somehow similar. However except for PCR ribotype 027, there is no study reporting in depth the similarity of the gene contents and gene sequences between strains with the same PCR-ribotype [11]. In this study we demonstrate correlations between the degree of sequence divergence of conserved genes of C. difficile strains and the strains’ PCR-ribotypes. Further, ribotype-specific genes for genomes with the same PCR-ribotype could be identified from whole-genome comparisons of 48 genome sequences of C. difficile strains, 27 of which were sequenced for this study, representing 21 different PCR-ribotypes.
Methods
DNA Sequencing and Genome Assembly
DNA was extracted of overnight culture growth in TY media, inoculated from one colony as described in [19]. Single-end multiplex libraries were created and the sequencing was performed using the Illumina HiSeq™ platform. The read length was 36-bp and 110-bp and all isolates were sequenced at least to an average coverage of 100-fold across the isolates. Sequencing reads were first scanned to remove the adaptator sequences and then were assembled into contigs using Velvet [20]. Thereafter, contigs were re-organized using Blast [21] alignment against the genome sequence of the reference C. difficile 630 strain. All contigs that did not match to the sequence of the reference strain were localized at the end of the contigs assembled to obtain a whole genome scaffold for each of the isolates. The sequenced C. difficile strains are deposited in the European Nucleotide Archive, the accession numbers are presented in the 2nd column of Table 1.
Table 1. Listing of accesion number, host and location of isolation of the 27 C. difficile strains sequenced for this study.
| Strain | Accession number | Host | Location |
| E1 | CAMD00000000 (WGS_scaffold) CAMD01000001-CAMD01000212 (contigs) | Human | Austria |
| E10 | CAME00000000 (WGS_scaffold) CAME01000001-CAME01000293 (contigs) | Horse | Slovenia |
| E12 | CAMZ00000000 (WGS_scaffold) CAMZ01000001-CAMZ01000353 (contigs) | Human | UK |
| E13 | CAMF00000000 (WGS_scaffold) CAMF01000001-CAMF01000262 (contigs) | Human | Ireland |
| E14 | CAMS00000000 (WGS_scaffold) CAMS01000001-CAMS01000319 (contigs) | Human | Hungary |
| E15 | CAMM00000000 (WGS_scaffold) CAMM01000001-CAMM01000444 (contigs) | Human | France |
| E16 | CAMH00000000 (WGS_scaffold) CAMH01000001-CAMH01000111 (contigs) | Human | France |
| E19 | CAMO00000000 (WGS_scaffold) CAMO01000001-CAMO01000325 (contigs) | Human | UK |
| E23 | CAMY00000000 (WGS_scaffold) CAMY01000001-CAMY01000264 (contigs) | Human | France |
| E24 | CAMP00000000 (WGS_scaffold) CAMP01000001-CAMP01000063 (contigs) | Human | France |
| E25 | CAMJ00000000 (WGS_scaffold) CAMJ01000001-CAMJ01000441 (contigs) | Human | France |
| E28 | CAMX00000000 (WGS_scaffold) CAMX01000001-CAMX01000274 (contigs) | Human | France |
| E7 | CAMV00000000 (WGS_scaffold) CAMV01000001-CAMV01000409 (contigs) | Human | Austria |
| E9 | CAMU00000000 (WGS_scaffold) CAMU01000001-CAMU01000373 (contigs) | Horse | Canada |
| T10 | CANB00000000 (WGS_scaffold) CANB01000001-CANB01000460 (contigs) | Human | Germany |
| T11 | CAML00000000 (WGS_scaffold) CAML01000001-CAML01000409 (contigs) | Human | France |
| T14 | CANC00000000 (WGS_scaffold) CANC01000001-CANC01000491(contigs) | Human | Ireland |
| T15 | CAMK00000000 (WGS_scaffold) CAMK01000001-CAMK01000631 (contigs) | Human | Belgium |
| T17 | CAMT00000000 (WGS_scaffold) CAMT01000001-CAMT01000449 (contigs) | Human | Hungary |
| T19 | CANA00000000 (WGS_scaffold) CANA01000001-CANA01000247 (contigs) | Human | France |
| T20 | CAMC00000000 (WGS_scaffold) CAMC01000001-CAMC01000210 (contigs) | Human | Ireland |
| T22 | CAMI00000000 (WGS_scaffold) CAMI01000001-CAMI01000332 (contigs) | Human | Hungary |
| T23 | CAMN00000000 (WGS_scaffold) CAMN01000001-CAMN01000293 (contigs) | Human | Italy |
| T42 | CAMQ00000000 (WGS_scaffold) CAMQ01000001-CAMQ01000096 (contigs) | Human | Italy |
| T3 | CAMW00000000 (WGS_scaffold) CAMW01000001-CAMW01000275 (contigs) | Human | Italy |
| T5 | CAMB00000000 (WGS_scaffold) CAMB01000001-CAMB01000227 (contigs) | Human | Italy |
| T6 | CAMR00000000 (WGS_scaffold) CAMR01000001-CAMR01000373 (contigs) | Human | Hungary |
Reciprocal Best Hits BLAST
A variation of the BLAST [21] reciprocal-best-hit method was used to identify orthologous CDSs (coding sequences) between two genomes. With the standard BLAST reciprocal-best-hit method two CDSs, C1 and C2 (from genome G1 and G2 respectively) are considered to be orthologous if and only if C2 is the best BLAST hit when G1 is used as the query sequence and all CDSs in G2 are used as the database, and (b) C1 is the best BLAST hit when G2 is used as query sequence and all CDS of G1 are used as the database. We modified the method by extending best hit to best hits while establishing threshold 1 and threshold 2. Threshold 1 says one hit can be grouped as one of the best hits if and only if the bit-score of the hit is equal or smaller than e.g. 80% of the maximal bit-score. Threshold 2 is analogous to threshold 1, except that it refers to the length of the query CDS and is defined as the percentage of the query sequence. Threshold 1 and 2 were set to 0.8 BLAST was used with the default parameters and an E-value cut-off of 10−5 and the filter-option was set to false. The BLAST release 2.2.22 was locally installed. The BLAST reciprocal best hits method was implemented in Java. The results of the reciprocal best hits BLAST were stored in a MySQL database. That method is named reciprocal best hits BLAST.
In our dataset the genome sequences of six C. difficile genomes were not annotated (see Table 2). To use these strains we assigned functions to ORFs (open reading frames) by using the reciprocal best hits BLAST. First, ORFs (open reading frames) were predicted in all six genomes with the software GLIMMER [22]–[24]. In total, three reference genomes (C. difficile R20291, C. difficile CD196 and C. difficile 630) were used for each annotated genome (Table 2). Orthologous sequences were computed with reciprocal best hits BLAST for all predicted ORFs of each organism and all CDSs of each reference genome like described above. The reciprocal best hits BLAST was computed using translated nucleotide BLAST (tblastx) with default parameters, expect an E-value cut-off of 10−5 and the filter-option was set to false, threshold 1 and 2 were set to 0.8.
Table 2. Ribotype, toxinotype and accession number of 21 C. difficile strains with previously reported genome sequences used in this study.
| Strain | Accession number | PCR-ribotype | Toxinotype |
| BI1* | FN668941.1 (chromosome) FN668943.1 (chromosome) FN668942.1 (plasmid) | 027 | III |
| BI9* | FN668944 (chromosome) | 001 | 0 |
| 2007855* | FN665654.1 (chromosome) | 027 | III |
| 630 | AM180355.1 (chromosome) AM180356.1 (plasmid) | 012 | 0 |
| CD196 | FN538970.1 | 027 | III |
| CF5* | FN665652.1 | 017 | VIII |
| M120* | FN665653.1 | 078 | V |
| M68* | FN668375.1 | 017 | VIII |
| R20291 | FN545816.1 | 027 | III |
| ATCC 43255 | CM000604.1 | 087 | 0 |
| CIP-107932 | CM000659 (WGS_scaffold) ABKK02000001-ABKK02000055 (contigs) | 027 | III |
| QCD-23m63 | CM000660 (WGS_scaffold) ABKL02000001-ABKL02000061 (contigs) | 078 | V |
| QCD-32g58 | CM000604 (WGS_scaffold) NZ_AAML04000001-NZ_AAML04000016 (contigs) | 027 | III |
| QCD-37x79 | CM000658 (WGS_scaffold) NZ_ABHG02000001.1 - NZ_ABHG02000031.1 (contigs) | 027 | III |
| QCD-63q42 | CM000637 (WGS_scaffold) ABHD02000001-ABHD02000060 (contigs) | 001 | 0 |
| QCD-66c26 | CM000441 (WGS_scaffold) ABFD02000001-ABFD02000031 (contigs) | 027 | III |
| QCD-76w55 | CM000661 (WGS-scaffold) ABHE02000001-ABHE02000066 (contigs) | 027 | III |
| QCD-97b34 | CM000657 (WGS_scaffold) ABHF02000001-ABHF02000060 (contigs) | 027 | III |
| NAP07 | GG770744-GG770776 (WGS_scaffold) ADVM01000001-ADVM01000100 (contigs) | 078 | V |
| NAP08 | GG770710-GG770733 (WGS_scaffold) ADNX01000001-ADNX01000111 (contigs) | 078 | V |
| CD002 | CAMG00000000 (WGS_scaffold) CAMG01000001-CAMG01000071 (contigs) | 002 | 0 |
Strains marked with an asterisk are not annotated. The ribotypes of these strains were calculated using their GenBank data.
To determine the core genomes of any set of C. difficile strains, orthologous CDSs were identified between all CDSs in the set, like described before. If one CDS had an orthologous CDS in every strain of the set the CDS was assigned to the core genome. Different core genomes or the whole genomes, in case no core genome could be computed, were compared to detect CDSs that are specific for a special set.
The reciprocal best hits BLAST was computed using nucleotide BLAST (blastn) with default parameters, expect E-value cut-off of 10−5 and the filter-option was set to false, threshold 1 and 2 were set to 0.8.
Distance Matrices
Fourteen gene sequences encoding highly conserved proteins () were used for distance matrices computations. The respective protein primary structures are commonly used besides the rRNA sequences as markers in comprehensive phylogenetic studies of the organisms [25]. The nucleotide sequences of the 14 gene sequences from strain CD630 were download from the UniProt database [26]. To detect the corresponding gene sequences in the remaining C. difficile strains, nucleotide sequences comparisons with BLAST were performed using as query the nucleotide sequences of the 14 CD630 genes and as database all whole genome sequence of all analysed C. difficile strains in the study. For each of the 14 genes, the group of detected nucleotide sequences was aligned using the ARB program [27] using processed seed databases as templates. Distance matrices-based dendrograms were obtained applying the neighbor joining method implemented in ARB. The distance matrices contain always the normalized hamming distances. The normalized hamming distance between two sequences is the number of different characters divided by the number of comparisons. To estimate the root of the dendrograms, the corresponding conserved genes from close relatives of C. difficile were included.
Results
Distance Matrices of Conserved Genes Correlate with Ribotypes
In the current study we primarily investigated correlations between 14 conserved genes and 21 different ribotypes of 48 C. difficile strains with completely sequenced genomes, see Table 2 and Table 3. These 14 conserved genes were investigated to see if the ribotype is reflected in their sequences. The lengths of the 14 different conserved genes for ATPase alpha, ATPase alpha V-type, ATPase beta, ATPase beta V-type, RNA polymerase A, RNA polymerase B, RNA polymerase C, DNA gyrase A, DNA gyrase B, elongation factor G, heat shock protein 60, heat shock protein 70, initiation factor, recombinase, range from 948 to 3717 nucleotides (Table 4).
Table 3. Phenotypic description of the 27 C. difficile strains sequenced for this study.
| Strain | PCR-ribotype (agarose) | PCR-ribotype (WEBRIBO) | Toxinotype | Fluoroquinolone resistance |
| E1 | 126 | 126 | V | S |
| E10 | 033 | 033 | XIa | S |
| E12 | 106 | 106 | 0 | R |
| E13 | 017 | 017 | VIII | R |
| E14 | 014 | 014/0 | 0 | S |
| E15 | 075 | 075 | III | S |
| E16 | 001* | 577 | 0 | S |
| E19 | 036 | 578 | X | S |
| E23 | 001/072 | 241 | 0 | S |
| E24 | 020 | 020 | 0 | S |
| E25 | 005 | 005 | 0 | S |
| E28 | 012 | 012 | 0 | S |
| E7 | 053 | 053 | 0 | R |
| E9 | 009 | 009 | NA | S |
| T10 | 001/072 | 001 | 0 | R |
| T11 | 075 | 075 | III | S |
| T14 | 106 | 106 | 0 | R |
| T15 | 005 | 005 | 0 | I |
| T17 | 025 | 665 | 0 | R |
| T19 | 057 | 237 | 0 | I |
| T20 | 078 | 078 | V | S |
| T22 | No data | No data | 0 | ND |
| T23 | 019 | 019 | IX | S |
| T42 | No data | No data | No data | ND |
| T3 | 012 | 012 | 0 | I |
| T5 | 126 | 126 | V | R |
| T6 | 014 | 014/0 | 0 | I |
The strain names, PCR-ribotypes, toxinotypes, and fluoroquinolone resistance of 27 C. difficile strains used and sequenced for this study are listed. The PCR-ribotype was determined agarose-based [6] and WEBRIBO-based [35]. PCR-ribotype 001* is similar but not identical to PCR ribotype 001/072. The toxinotype of strain E9 could not be determined because it has no ToxinA and ToxinB genes, but genes for the binary toxins.
Table 4. Characteristics of the 14 conserved genes used for the computation of the distance matrices.
| Conserved gene | Locus tag | Gene ID | Length | Maximal Hamming distance |
| ATPase Alpha (atpA) | CD630_34700 | 4914804 | 1503 | 1.33 |
| ATPase Alpha V-Type (atpA) | CD630_29560 | 4913755 | 1779 | 1.35 |
| ATPase Beta (atpD) | CD630_34680 | 4914802 | 1395 | 1.15 |
| ATPase Beta V-Type (atpB) | CD630_29550 | 4913754 | 1374 | 1.97 |
| RNA polymerase A (rpoA) | CD630_00980 | 4913146 | 948 | 1.59 |
| RNA polymerase B (rpoB) | CD630_00660 | 4914216 | 3717 | 2.21 |
| RNA polymerase C (rpoC) | CD630_00670 | 4914217 | 3486 | 2.84 |
| Gyrase A (gyrA) | CD630_00060 | 4915790 | 2427 | 2.02 |
| Gyrase B (gyrB) | CD630_00050 | 4915789 | 1902 | 2.79 |
| Initiation factor | CD630_13090 | 4914468 | 1941 | 1.2 |
| Recombinase (recap) | CD630_13280 | 4914615 | 1047 | 2.29 |
| Heatshock protein 70 (dnaK) | CD630_24610 | 4916451 | 1848 | 1.25 |
| Heatshock protein 60 (groL) | CD630_01940 | 4915463 | 1629 | 2.71 |
| Elongation factor G (fusA) | CD630_00700 | 4914220 | 2067 | 1.21 |
The locus tag, length values and gene IDs listed in the table were taken from the genome data of C. difficile strain CD630. The maximal hamming distance is a measure for the dissimilarity of the 14 conserved genes in all analysed 48 C. difficile strains.
The diversity of the 48 C. difficile strains was studied by distance matrix-based clustering. To figure out the differences between the sequences, the simplest method to compute distances between sequences was used (Neighbor Joining). For each highly conserved gene a distance matrix was computed (see section on Distance matrices below). Table 4 shows that the maximal hamming distances ranged from 1.15 (ATPase beta gene) to 2.84 (RNA polymerase C gene). For the gene ATPase beta not more than 15 of overall 1395 nucleotides differ and for the gene RNA polymerase C not more than 78 of overall 3486 nucleotides. Thus, the nucleotide sequence divergence for each of the 14 investigated conserved genes is generally low, differing only in few nucleotides among the 48 studied C. difficile genomes. Considering the high degree of similarity of the nucleotide sequences, the corresponding protein sequences were neglected.
To visualize the results, dendrograms were computed for each distance matrix. Each of the 14 computed dendrograms showed that C. difficile strains with the same PCR-ribotype cluster together (Fig. 1, and Fig. S1, S2, S3, S4, S5, S6, S7, S8, S9, S10, S11, S12, S13). In addition, the dendrograms of all conserved genes showed further clustering of PCR-ribotype groups. Strains with PCR-ribotype 078, 033 and 126 always clustered together, as well as strains with PCR-ribotypes 017 and 002. Strains from ribotype 027 usually represent the independent lineage or cluster together with ribotype 019, 036 and 075.
Figure 1. DNA gyrase A gene-based dendrogram.
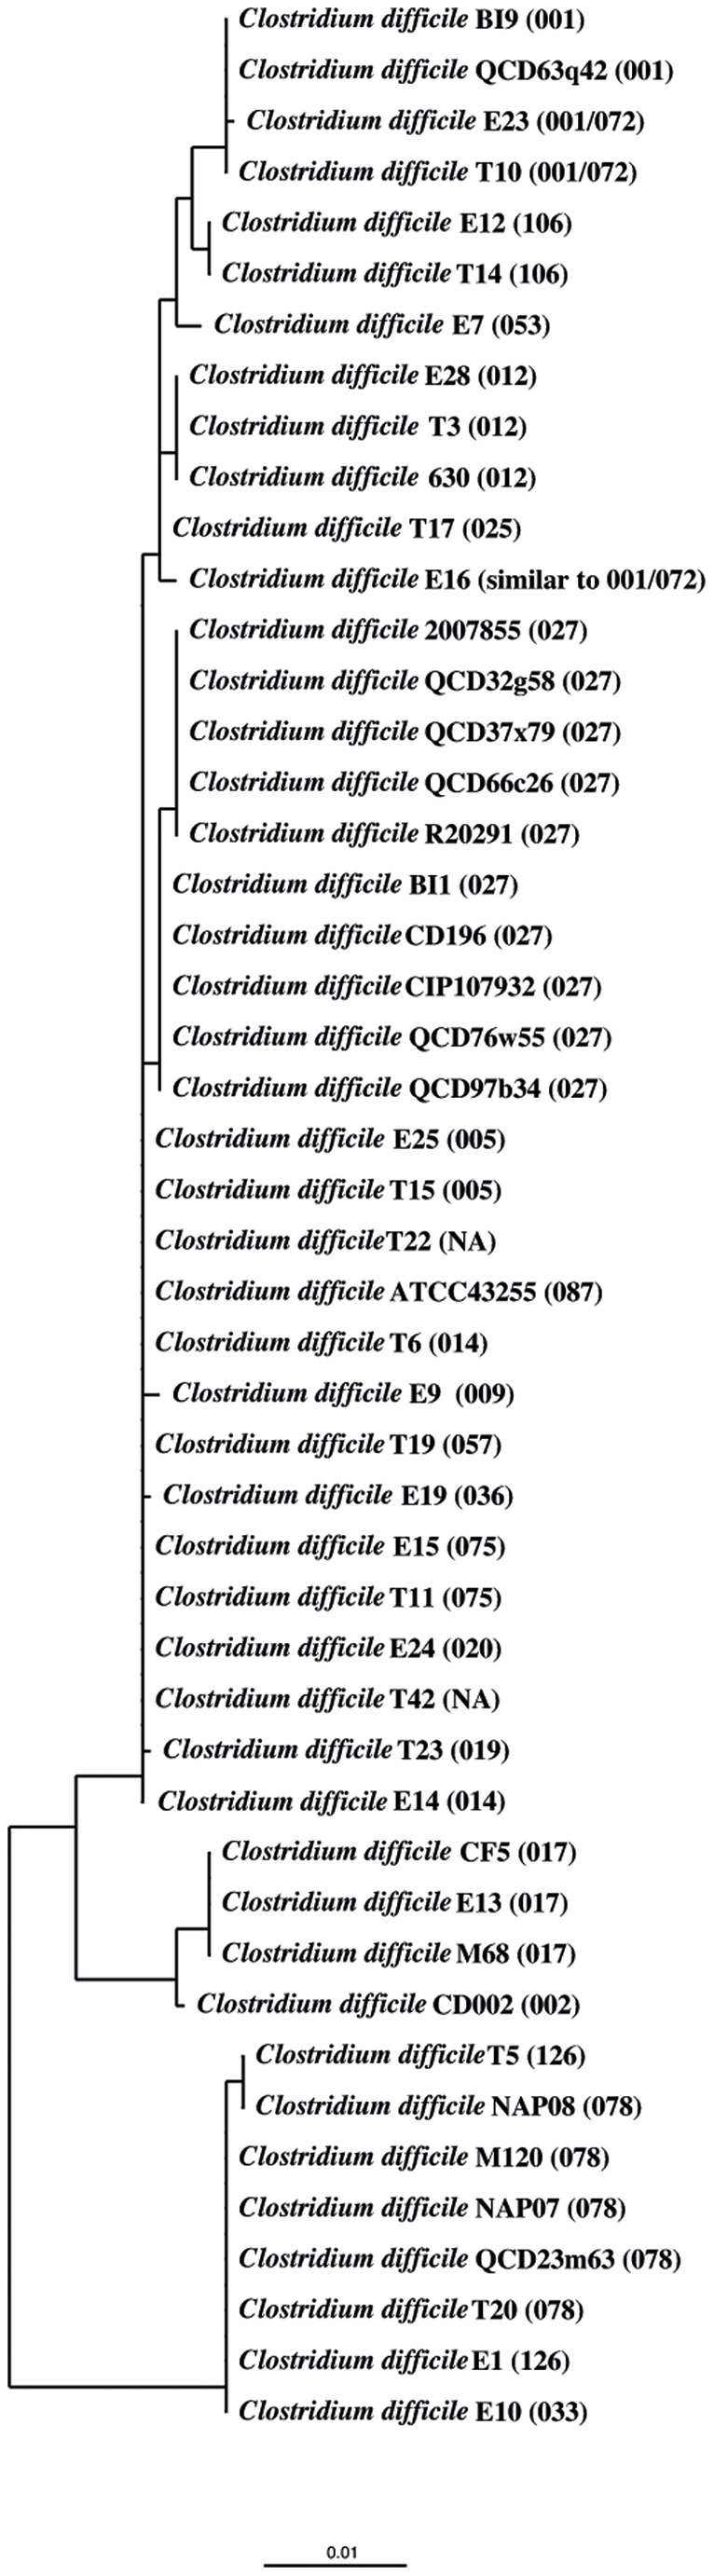
Neighbor joining dendrogram reflecting the similarity for 48 C. difficile strains based on the gene for DNA gyrase A. The distance matrix was computed using the Hamming distance with the DNA gyrase A genes from the 48 C. difficile isolates containing this gene. The strains always cluster together according to their PCR-ribotype. The PCR-ribotype is indicated in brackets. The strains with ribotype 027 sub-cluster into two different groups.
The dendrogram reflecting gyrase A (Fig. 1) shows a sub-clustering of the ten strains with PCR-ribotype 027. Five strains, 2007855, QCD37x79, QCD66c26, R20291 and QCD32g58, are grouped into one cluster whereas the other five ribotype 027 strains, QCD76w55, BI1, ATCC43255, CD196 and CIP107932, formed another cluster. These two sub-clusters only differ by one nucleotide at position 245, the first group showing thymine at that position and the second group cytosine. The amino-acid sequence also differs at the corresponding position on the protein sequence level group 1 having isoleucine and group 2 threonine at that position. It is noteworthy that these clusters correlate with the strains’ fluoroquinolone resistance [11].
The two sub-clusters of the ten strains with PCR-ribotype 027 were also found in a dendrogram calculated from the concatenated sequences of all 14 conserved genes. Additionally, in that dendrogram strains with the same ribotypes also form clusters and the strains with the PCR-ribotypes 033, 078 and 126 formed one cluster, as well as the two PCR ribotypes 002 and 017 (Fig. S14).
Gene Content Analysis with Reciprocal BLAST Reveals that Some Ribotypes are more Similar than others
According to the PCR-ribotype and conserved gene-based clustering of the C. difficile strains, we defined a core genome from all genes for each cluster using reciprocal best hits BLAST. A cluster is defined to contain C. difficile strains with the same PCR-ribotype. Eleven PCR-ribotypes are represented by exactly one genome and each of them builds exactly one cluster. These ribotypes are 002, 009, 019, 020, 025, 033, 036, 053, 057, 087, and 001* (similar but not identical to 001). Ten other PCR-ribotypes (001, 005, 012, 014, 017, 027, 075, 078, 106 and 126) are represented by 2 or more genomes. The cluster called 001 comprises strains with ribotype 001 and 001/072. Each core genome represents the set of all orthologous CDSs shared by all members of the cluster. Core genomes could only be computed of ribotypes, which were represented by two or more strains. For those ribotypes, which were represented by merely one strain, the whole genome instead of a core genome was included in the genome comparisons. Core genome and whole genome comparisons allowed the search for genes which are specific for (i.e. exclusively shared by) all members of a given cluster or cluster group.
The size of each core genome depends on the number and diversity of the considered genomes. The number of genes determined for the 10 different core genomes ranges from 2299 to 3617 genes. The most comprehensive cluster (10 of 48 strains) in our dataset combines the PCR-ribotype 027 strains. This group shares the smallest core genome comprising 2299 genes. The largest core genome with 3617 genes was found for the PCR ribotype 075 with the strains E15 and T11. The remaining groups have two (ribotype 005, 014, 106 and 126), three (ribotype 017, or 012), four (ribotype 001) or five (ribotype 078) representatives and core genome sizes ranging from 2415 to 3589 genes.
The percentage of genes shared between the core genomes or the whole genomes of each possible comparison between two groups of PCR-ribotypes varied from 75.9% (009/033) to 99.7% (078/126). More than 98% of all genes of the core genome or the whole genome of one PCR-ribotype were identified in the comparison of PCR-ribotype 012 with 053, 014 with 001*, 001 with 053, and 014 with 020. Furthermore more than 97% genes were found in 8 other genome comparisons. 2 other comparisons resulted in less than 80% shared genes. The lowest percentage of shared genes, 77.6% und 78%, were identified upon comparison of the whole genomes of PCR-ribotype 087 with 577 and the whole genome of 009 with the core genome 126, respectively.
The core genome of the group with PCR-ribotype 078 revealed 5 specific genes when compared with the core genome of ribotype 126 and 69 specific genes when compared with the whole genome of strain E10 (PCR-ribotype 033). The 5 specific genes for ribotype 078 in comparison to ribotype 126 are 2 hypothetical proteins (locus_tag = CdifQCD-2_020200008002, locus_tag = CdifQCD-2_020200004284), integrase (locus_tag = CdifQCD-2_020200004815), sigma-54 dependent regulatory protein (locus_tag = CdifQCD-2_020200006932) and sigma-54-dependent transcriptional activator (locus_tag = CdifQCD-2_020200016221).
These small numbers of specific genes support the clustering of these three ribotype strains found by the comparative analyses of the 14 conserved genes described above.
The second group that always clustered together in the analysis of conserved genes were ribotypes 017 and 002. In the course of comparison of their core genomes and whole genome, 86 specific genes were identified for PCR-ribotype 017.
Distance Matrix Computation of Toxin Genes
In all 48 analysed C. difficile genome sequences 12 different genes were identified that have been associated with virulence and 21 genes associated with toxin activity. The genes associated with toxin (purely annotation-based selection, knowing that some of these genes are unlikely to be virulence-related) comprise these gene designations: toxin-antitoxin system, antitoxin component Xre family (BN189_1150005); putative toxin-antitoxin system, toxin component, Bro family (BN180_2630008); toxin secretion/phage lysis holin (CdifA_020200008837); toxin-antitoxin system, toxin component, RelE family (BN180_2600020); ADP-ribosyltransferase enzymatic component (cdtA) (CD196_2444); ADP-ribosyltransferase binding protein (cdtB) (CD196_2445), binary toxin regulatory gene, LytTR family (cdtR) (BN175_1830013); toxin A (tcdA) (CDR20291_0584); toxin B (tcdB) (CD196_0600); negative regulator of toxin gene expression (tcdC) (CDR20291_0585); putative cell wall hydrolase protein (tcdE) (CDR20291_0583), epsilon-antitoxin (BN182_1810006); zeta-toxin (BN182_1810005); neurotoxin Cex100 (BN168_390016); enterotoxin, EntD (BN175_600004); iota toxin component Ia (BN166_1780002); iota toxin component Ib (BN166_1780003); C2 toxin component I (CdifQCD-2_020200012999) and C2 toxin component II (CdifQCD-2_020200013004). The gene for binary toxin A is annotated differently in the genomes of our data set. It is annotated as binary toxin A, C2 toxin component I and iota toxin component Ia. In accordance to our specifications these CDSs are orthologous. The same holds true for the CDSs for binary toxin B, C2 toxin component II and iota toxin component Ib.
BLAST comparisons of all genes that are associated with toxin activity were performed against the National Center for Biotechnology Information (NCBI) non-redundant database to see if these genes are similar to genes where toxin activity was described. In addition to toxin A, toxin B and binary toxin no other gene for which association with toxin activity was reported could be detected.
Differences in toxin genes of C. difficile strains as found by comparisons of the pathogenicity loci have been used for differentiation purposes (toxinotypes; [28]). Therefore, analogous to the distance matrices computations described above for 14 conserved genes, dendrograms were also computed for the genes for toxin B (tcdB), negative regulator of toxin gene expression (tcdC), binary toxin A (cdtA), binary toxin B (cdtB) and the binary regulatory protein (cdtR) (Fig. 2, and Fig. S15, S16, S17, S18). For the toxin A gene (tcdA) no dendrogram was computed because the sequences from 20 of the 48 strains due to difficulties in completing sequences containing repeats with Illumina technology had gaps in the toxin A sequence and the result would then be falsified. The dendrograms for these genes show that strains with the same ribotype cluster and support the same groups of PCR-ribotypes as described above for the conserved genes.
Figure 2. Toxin B gene-based dendrogram.

Neighbor joining dendrogram reflecting the similarity for 46 C. difficile strains based on the gene for Toxin B. The distance matrix was computed using the Hamming distance with the Toxin B genes from the 46 C. difficile isolates containing this gene. The strains always cluster together according to their PCR-ribotype. The PCR-ribotype is indicated in brackets.
Furthermore we computed a distance matrix with the gene annotated as putative virulence associated protein E, virE (CD196_1450). This gene was included in the analysis based on this annotation, being well aware that its connection with virulence of C. difficile is uncertain and that it is not present in every analysed strain. The virE-orthologous gene is present in the genomes with PCR-ribotype 009, 017, 025, 027, 075 and 087 (19 strains). The putative virulence-associated protein E belongs to the family VirE, to the Clan P-loop NTPase (CL0023) and its gene is 1417 nucleotides long.
As described above for the toxin-associated genes and the 14 conserved genes we also computed a dendrogram for the virE gene (Fig. 3). Similar to the conserved gyrase A gene we detected a sub-clustering of strains with PCR-ribotype 027 in two groups. Strains CD196 and CIP107932 represented a common group, while strains BI1, QCD-32g58, QCD-37x79, QCD-97b34, QCD-66c26, QCD-76w55, 2007855, R20292, T11, E19 and E15 clustered in the other group. The first group only differs by two nucleotides from the second group. The nucleotide at position 772 is cytosine in the first group but adenine in the second group, resulting in threonine or asparagine residues, respectively, at the corresponding amino acid sequence positions. The other difference is at nucleotide position 992, were either cytosine (group 1) or thymine (group 2) is found, with no consequence for the amino acid sequence.
Figure 3. Virulence associated protein e gene-based dendrogram.
Neighbor joining dendrogram reflecting the similarity for 19 C. difficile strains based on the gene for virulence associated protein E. The distance matrix was computed using the Hamming distance with the virulence associated protein E genes from the 19 C. difficile isolates containing this gene. The strains always cluster together according to their PCR-ribotype. The PCR-ribotype is indicated in brackets. The strains with ribotype 027 sub-cluster into two different groups.
Discussion
PCR-ribotyping is a common method to group C. difficile strains and the standard method in laboratorys Europe-wide. Recently, a module-like structure of PCR-ribotype defining sequences was identified [8], and studies based on strains from a limited number of ribotypes have indicated that the phylogenetic diversity of C. difficile is reflected by the PCR-ribotypes [12], [16], [17], [29]. Another study based on C. difficile strains with different ribotypes reported that the phylogenetic diversity is best reflected by the MLST [30]. Our work complements and corroborates these studies by analysing in depth for the first time the correlations between the PCR-ribotype and the gene content and the relatedness of conserved genes among the fully sequenced genomes of a total of 48 C. difficile strains. Importantly, our study includes the genomes of strains belonging to a broad variety of different ribotypes. To this end, we present for the first time a gene content analysis of C. difficile strains representing 21 different ribotypes. In contrast to existing studies [10]–[14], [16], [17], [29] we do not focus on strains with ribotypes 027 or 078, and in contrast to a recent study on MLST comparison of various C. difficile strains from different ribotypes [30] we compared fully sequenced genomes.
Despite the development of new typing methods for C. difficile like whole-genome SNP typing it becames apparent that especially capillary ribotyping is cheaper and faster. Additionally the discrimatory power of whole-genome SNP and capillary ribotyping is identical [31], [32]. Our results demonstrate that the PCR ribotype is not only reflected by the sequences between the 16S and 23S rRNA but also by 21 different genes. Therefore, whole genome SNP approaches do not automatically represent the ultimate pathogen typing method [31].
By computing distance matrices with neighbor joining for 14 conserved genes we found that the nucleotide sequence differences between the representatives of each conserved gene are small but these small differences are always correlated with the PCR-ribotypes of the C. difficile strains. This observation emphasizes that the assignment of the PCR-ribotype is a very suitable method to group C. difficile strains.
The dendrogram computed with the gene DNA gyrase A showed that the 10 C. difficile strains with ribotype 027 analysed here differ at one nucleotide sequence position where either a thymine or a cytosine is found, resulting in either a threonine or isoleucine residue, respectively, at the corresponding GyrA amino acid sequence position. That gyrA mutation is associated with fluoroquinolone resistance and was identified to be one of the factors that correlate with two distinct epidemic lineages of C. difficile strains with ribotype 027 [11].
We identified two groups of C. difficile that always clustered together in the distance matrix analyses, one group comprising PCR-ribotypes 033, 078, and 126, and a second group comprising PCR-ribotypes 002 and 017. The clustering for strains with PCR-ribotypes 033, 078 and 126 has already been observed before [16], [30], [33]. PCR-ribotype 126 differs only by the loss of one single band on the amplified DNA band pattern of PCR-ribotype 078 [34]. The seven strains with PCR-ribotypes 078 and 126 have the same toxinotype V, while the strain with PCR-ribotype 033 has toxinotype XIa. It has been reported that these strains together with strains from the ribotypes 045, 066 and 193 belong to the same evolutionary lineage [30]. The four strains with PCR-ribotypes 002 and 017 have also different toxinotypes (0 and VIII). The computation of the genes specific for certain groups of PCR-ribotypes confirmed the clustering of all two groups. The PCR-ribotype groups 033/078 and 078/126 had only few specific genes meaning they have few differences in the gene content. In this context it is interesting to note that in practise 078 and 126 strains are not always easily differentiated and therefore are sometimes designated as ribotype 078/126.
The genome database annotation of the gene virE as “putative virulence-associated protein E” is suggestive of a possible role in virulence. Despite the fact that the function of virE has not been determined in C. difficile and hence it is not clear if it is really associated with virulence, we have included the virE sequences in the comparative analysis of this study, yielding an interesting result. VirE and DNA gyrase A were the only analysed CDS showing a sub-clustering of all PCR-ribotype 027 strains into two groups. In the virE-based dendrogram, group 1 contains strains CD196 and CIP107932, both isolated in France. The second group contains strains 2007855, BI1, QCD32g58, QCD37x79, QCD66c76, QCD76w55, QCD97b34, R20291 with PCR-ribotype 027, strains E15 and T11 with PCR-ribotype 075 and E19 with PCR-ribotype 001*. Strains with PCR-ribotype 027 from the second group were isolated, as far as known, in Canada, the United Kingdom and USA. The other three strains from the second group were isolated in France and the United Kingdom. There could be an association between PCR-ribotype 027 and the country of isolation that is reflected by the gene virE.
Regarding all specific genes and all genes of each core genome no gene could be identified that is associated with toxin activity except the familiar genes for toxin A, toxin B, toxin C and the binary toxins. Hence no gene associated with toxin activity could be correlated only with so called hypervirulent C. difficile strains.
It has been reported recently that PCR ribotype 027 is very similar to the ribotypes 016, 036 and 176 [30]. In our analysis the strain with ribotype 036 is always allocated to the same node except in the dendrograms for the genes tcdB and gyrA. Strains with the ribotypes 016 and 176 are not contained in our dataset.
In conclusion, this report demonstrates that the PCR-ribotype is correlated with differences in the sequences of conserved genes. Thus it appears that the PCR-ribotype is indicative not only of a specific pattern of the 16S-23S rRNA intergenic spacer sequences, but also reflects specific differences in the nucleotide sequences of numerous genes such as the genes studied here. Perhaps the sequence deviations of many more C. difficile genes are correlated with the PCR-ribotypes of the corresponding strains.
Supporting Information
ATPase α V-Type gene-based dendrogram. Neighbor joining dendrogram reflecting the ATPase α V-Type-based species similarity for all 48 analyzed C. difficile strains. The distance matrix was computed using the Hamming distance with the ATPase α V-Type genes from the 48 C. difficile isolates. The PCR-ribotype is indicated in brackets. All C. difficile strains cluster together according to their PCR ribotype.
(EPS)
ATPase α F1F10 gene-based dendrogram. Neighbor joining dendrogram reflecting the DNA ATPase α F1F10-based species similarity for all 48 analyzed C. difficile strains. The distance matrix was computed using the Hamming distance with the ATPase α F1F10 genes from the 48 C. difficile isolates. The PCR-ribotype is indicated in brackets. All C. difficile strains cluster together according to their PCR ribotype.
(EPS)
ATPase β V-Type gene-based dendrogram. Neighbor joining dendrogram reflecting the ATPase β V-Type-based species similarity for all 48 analyzed C. difficile strains. The distance matrix was computed using the Hamming distance with the ATPase β V-Type genes from the 48 C. difficile isolates. The PCR-ribotype is indicated in brackets. All C. difficile strains cluster together according to their PCR ribotype.
(EPS)
ATPase β F1F10 gene-based dendrogram. Neighbor joining dendrogram reflecting the DNA ATPase β F1F10-based species similarity for all 48 analyzed C. difficile strains. The distance matrix was computed using the Hamming distance with the ATPase β F1F10 genes from the 48 C. difficile isolates. The PCR-ribotype is indicated in brackets. All C. difficile strains cluster together according to their PCR ribotype.
(EPS)
Elongation factor G gene-based dendrogram. Neighbor joining dendrogram reflecting the Elongation factor G gene-based species similarity for all 48 analyzed C. difficile strains. The distance matrix was computed using the Hamming distance with the Elongation factor G genes from the 48 C. difficile isolates. The PCR-ribotype is indicated in brackets. All C. difficile strains cluster together according to their PCR ribotype.
(EPS)
DNA gyrase B gene-based dendrogram. Neighbor joining dendrogram reflecting the DNA gyrase B gene-based species similarity for all 48 analyzed C. difficile strains. The distance matrix was computed using the Hamming distance with the DNA gyrase B genes from the 48 C. difficile isolates. The PCR-ribotype is indicated in brackets. All C. difficile strains cluster according to their PCR ribotype.
(EPS)
Heatshock protein 60 gene-based dendrogram. Neighbor joining dendrogram reflecting the heat shock protein 60 gene-based species similarity for all 48 analyzed C. difficile strains. The distance matrix was computed using the Hamming distance with the heat shock protein 60 genes from the 48 C. difficile isolates. The PCR-ribotype is indicated in brackets. All C. difficile strains cluster according to their PCR ribotype.
(EPS)
Heatshock protein 70 gene-based dendrogram. Neighbor joining dendrogram reflecting the heat shock protein 70 gene-based species similarity for all 48 analyzed C. difficile strains. The distance matrix was computed using the Hamming distance with the heat shock protein 70 genes from the 48 C. difficile isolates. The PCR-ribotype is indicated in brackets. All C. difficile strains cluster according to their PCR ribotype.
(EPS)
Initiation factor gene-based dendrogram. Neighbor joining dendrogram reflecting the Initiation factor gene-based species similarity for all 48 analyzed C. difficile strains. The distance matrix was computed using the Hamming distance with the Initiation factor genes from the 48 C. difficile isolates. The PCR-ribotype is indicated in brackets. All C. difficile strains cluster according to their PCR ribotype.
(EPS)
Recombinase gene-based dendrogram. Neighbor joining dendrogram reflecting the similarity for all 48 analyzed C. difficile strains based on the gene for recombinase. The distance matrix was computed using the Hamming distance with the recombinase genes from all 48 C. difficile isolates. The strains always cluster according to their PCR ribotype. The PCR-ribotype is indicated in brackets.
(EPS)
RNA polymerase A gene-based dendrogram. Neighbor joining dendrogram reflecting the similarity for all 48 analyzed C. difficile strains based on the gene for RNA polymerase A. The distance matrix was computed using the Hamming distance with the RNA polymerase A genes from all 48 C. difficile isolates. The strains always cluster according to their PCR ribotype. The PCR-ribotype is indicated in brackets.
(EPS)
RNA polymerase B gene-based dendrogram. Neighbor joining dendrogram reflecting the similarity for all 48 analyzed C. difficile strains based on the gene for RNA polymerase B. The distance matrix was computed using the Hamming distance with the RNA polymerase B genes from all 48 C. difficile isolates. The strains always cluster according to their PCR ribotype. The PCR-ribotype is indicated in brackets.
(EPS)
RNA polymerase C gene-based dendrogram. Neighbor joining dendrogram reflecting the similarity for all 48 analyzed C. difficile strains based on the gene for RNA polymerase C. The distance matrix was computed using the Hamming distance with the RNA polymerase C genes from all 48 C. difficile isolates. The strains always cluster together according to their PCR ribotype. The PCR-ribotype is indicated in brackets.
(EPS)
Dendrogram based on the concatenated sequences of the 14 conserved genes. Neighbor joining dendrogram reflecting the similarity for all 48 analyzed C. difficile strains based on the concatenated sequences of the 14 conserved genes. The distance matrix was computed using the Hamming distance with these sequences from all 48 C. difficile isolates. The strains always cluster according to their PCR ribotype. The PCR-ribotype is indicated in brackets. Strains with ribotype 027 build two sub-clusters.
(EPS)
Binary toxin A gene-based dendrogram. Neighbor joining dendrogram reflecting the similarity for all 22 analyzed C. difficile strains based on the gene for binary toxin A. The distance matrix was computed using the Hamming distance with the binary toxin A genes from all 22 C. difficile isolates. The strains always cluster according to their PCR ribotype. The PCR-ribotype is indicated in brackets.
(EPS)
Binary toxin B gene-based dendrogram. Neighbor joining dendrogram reflecting the similarity for all 42 analyzed C. difficile strains based on the gene for binary toxin B. The distance matrix was computed using the Hamming distance with the binary toxin B genes from all 42 C. difficile isolates. The strains always cluster according to their PCR ribotype. The PCR-ribotype is indicated in brackets.
(EPS)
Binary toxin R gene-based dendrogram. Neighbor joining dendrogram reflecting the similarity for all 42 analyzed C. difficile strains based on the gene for binary toxin R. The distance matrix was computed using the Hamming distance with the binary toxin R genes from all 42 C. difficile isolates. The strains always cluster according to their PCR ribotype. The PCR-ribotype is indicated in brackets.
(EPS)
Toxin C gene-based dendrogram. Neighbor joining dendrogram reflecting the similarity for 47 C. difficile strains based on the gene for toxin C. The distance matrix was computed using the Hamming distance with the toxin C genes from the 47 C. difficile isolates containing this gene. The strains always cluster according to their PCR-ribotype. The PCR-ribotype is indicated in brackets.
(EPS)
Distance Matrices of all analysed genes.
(XLSX)
Listing of all identified specific genes in every comparison.
(XLSX)
Listing of the number of all computed core-genomes and specific genes.
(XLSX)
Funding Statement
Financial support of this work (collaborative project CDIFFGEN – Pathogenomics of increased Clostridium difficile virulence) within the framework ERA-NET PathoGenoMics 2 by the German Federal Ministry of Education and Research (BMBF) is gratefully acknowledged. The funders had no role in study design, data collection and analysis, decision to publish, or preparation of the manuscript.
References
- 1. Bartlett JG, Chang WT, Gurwith M, Gorbach SL, Onderdonk AB (1978) Antibiotic-Associated Pseudomembranous Colitis Due to Toxin-Producing Clostridia. The New England Journal of Medicine 298: 531–534. [DOI] [PubMed] [Google Scholar]
- 2. Sherwood L, Gorbach MD (1999) Antibiotics and Clostridium difficile. The New England Journal of Medicine 341: 1690–1691. [DOI] [PubMed] [Google Scholar]
- 3. Loo VG, Poirier L, Miller MA, Oughton MT, Libman MD, et al. (2005) A Predominantly Clonal Multi-Institutional Outbreak of Clostridium difficile-Associated Diarrhea with High Morbidity and Mortality. The New England Journal of Medicine 353: 2442–2449. [DOI] [PubMed] [Google Scholar]
- 4. McDonald LC, George MD, Killgore GE, Thompson A, Owens RC, et al. (2005) An Epidemic, Toxin Gene-Variant Strain of Clostridium difficile. The New England Journal of Medicine 353: 2433–2441. [DOI] [PubMed] [Google Scholar]
- 5. Merrigan M, Venugopal A, Mallozzi M, Roxas B, Viswanathan VK, et al. (2010) Human Hypervirulent Clostridium difficile Strains Exhibit Increased Sporulation as Well as Robust Toxin Production. Journal of Bacteriology 192: 4904–4911. [DOI] [PMC free article] [PubMed] [Google Scholar]
- 6. Bidet P, Barbut F, Lalande V, Burghoffer B, Petit JC (1999) Development of a new PCR-ribotyping method for Clostridium difficile based on ribosomal RNA gene sequencing. FEMS Microbiol Lett 175: 261–266. [DOI] [PubMed] [Google Scholar]
- 7.Janezic S, Rupnik M (2010) Molecular typing methods for Clostridium difficile: pulsed-field gel electrophoresis and PCR ribotyping; Mullany P, Roberts AK, editors. Springer Protocols - Methods in Molecular Biology: Humana Press 2010. [DOI] [PubMed]
- 8. Indra A, Blaschitz M, Kernbichler S, Reischl U, Wewalka G, et al. (2010) Mechanisms behind variation in the Clostridium difficile 16S–23S rRNA intergenic spacer region. J Med Microbiol 59: 1317–1323. [DOI] [PMC free article] [PubMed] [Google Scholar]
- 9. Cheknis AK, Sambol SP, Davidson DM, Nagaro KJ, Mancini MC, et al. (2009) Distributation of Clostridium difficile strains from a North America, European and Australian trial of treatment for C. difficile infections: 2005–2007. Anaerobe 15: 230–233. [DOI] [PubMed] [Google Scholar]
- 10. Forgetta V, Oughton MT, Marquis P, Brukner I, Blanchette R, et al. (2011) Fourteen-genome comparison identifies DNA markers for severe-disease-associated strains of Clostridium difficile. J Clin Microbiol 49: 2230–2238. [DOI] [PMC free article] [PubMed] [Google Scholar]
- 11.He M, Miyajima F, Roberts P, Ellison L, Pickard DJ, et al. (2012) Emergence and global spread of epidemic healthcare-associated Clostridium difficile. Nat Genet. [DOI] [PMC free article] [PubMed]
- 12. He M, Sebaihia M, Lawley TD, Stabler RA, Dawson LF, et al. (2010) Evolutionary dynamics of Clostridium difficile over short and long time scales. Proc Natl Acad Sci U S A 107: 7527–7532. [DOI] [PMC free article] [PubMed] [Google Scholar]
- 13. Knetsch CW, Terveer EM, Lauber C, Gorbalenya AE, Harmanus C, et al. (2012) Comparative analysis of an expanded Clostridium difficile reference strain collection reveals genetic diversity and evolution through six lineages. Infect Genet Evol 12: 1577–1585. [DOI] [PubMed] [Google Scholar]
- 14. Stabler RA, He M, Dawson L, Martin M, Valiente E, et al. (2009) Comparative genome and phenotypic analysis of Clostridium difficile 027 strains provides insight into the evolution of a hypervirulent bacterium. Genome Biol 10: R102. [DOI] [PMC free article] [PubMed] [Google Scholar]
- 15. Bauer MP, Notermans DW, Benthem BH, Brazier J, Wilcox MH, et al. (2010) Clostridium difficile infection in Europe: a hospital-based survey. The Lancet 377: 63–73. [DOI] [PubMed] [Google Scholar]
- 16. Knetsch CW, Hensgens MP, Harmanus C, van der Bijl MW, Savelkoul PH, et al. (2011) Genetic markers for Clostridium difficile lineages linked to hypervirulence. Microbiology 157: 3113–3123. [DOI] [PubMed] [Google Scholar]
- 17. Stabler RA, Dawson LF, Valiente E, Cairns MD, Martin MJ, et al. (2012) Macro and micro diversity of Clostridium difficile isolates from diverse sources and geographical locations. PLoS One 7: e31559. [DOI] [PMC free article] [PubMed] [Google Scholar]
- 18. Barbut F, Rupnik M (2012) Editorial commentary: 027, 078, and others: going beyond the numbers (and away from the hypervirulence). Clin Infect Dis 55: 1669–1672. [DOI] [PubMed] [Google Scholar]
- 19. Dupuy B, Sonenshein AL (1998) Regulated transcription of Clostridium difficile toxin genes. Mol Microbiol 27: 107–120. [DOI] [PubMed] [Google Scholar]
- 20. Zerbino DR, Birney E (2008) Velvet: algorithms for de novo short read assembly using de Bruijn graphs. Genome Res 18: 821–829. [DOI] [PMC free article] [PubMed] [Google Scholar]
- 21. Altschul SA, Gish W, Miller W, Myers EW, Lipman DJ (1990) Basic Local Alignment Search Tool. J Mol Biol 215: 403–410. [DOI] [PubMed] [Google Scholar]
- 22. Salzberg SLD, A. L.; Kasif, S.; White (1998) O (1998) Microbial gene identification using interpolated Markov models. Nucleic Acids Research 26: 544–548. [DOI] [PMC free article] [PubMed] [Google Scholar]
- 23. Delcher ALH, D.; Kasif, S.; White, O.; Salzberg, S L (1999) Improved microbial gene identification with GLIMMER. Nucleic Acids Research 27: 4636–4641. [DOI] [PMC free article] [PubMed] [Google Scholar]
- 24. Delcher AL, Bratke KA, Powers EC, Salzberg SL (2007) Identifying bacterial genes and endosymbiont DNA with Glimmer. Bioinformatics 23: 673–679. [DOI] [PMC free article] [PubMed] [Google Scholar]
- 25.Ludwig W (2010) Molecular Phylogeny of Microorganisms: Is rRNA Still a Useful Marker?; Oren A, Papke RT, editors: Caister Academic Press. [Google Scholar]
- 26. Consortium TU (2012) Reorganizing the protein space at the Universal Protein Resource (UniProt). Nucleic Acids Res 40: D71–75. [DOI] [PMC free article] [PubMed] [Google Scholar]
- 27. Ludwig W, Strunk O, Westram R, Richter L, Meier H, et al. (2004) ARB: a software environment for sequence data. Nucleic Acids Research 32: 1363–1371. [DOI] [PMC free article] [PubMed] [Google Scholar]
- 28. Rupnik M (2008) Heterogeneity of large clostridial toxins: importance of Clostridium difficile toxinotypes. FEMS Microbiol Rev 32: 541–555. [DOI] [PubMed] [Google Scholar]
- 29. Stabler RA, Gerding DN, Songer JG, Drudy D, Brazier JS, et al. (2006) Comparative phylogenomics of Clostridium difficile reveals clade specificity and microevolution of hypervirulent strains. J Bacteriol 188: 7297–7305. [DOI] [PMC free article] [PubMed] [Google Scholar]
- 30. Knetsch CW, Terveer EM, Lauber C, Gorbalenya AE, Harmanus C, et al. (2012) Comparative analysis of an expanded Clostridium difficile reference strain collection reveals genetic diversity and evolution through six lineages. Infect Genet Evol 12: 1577–1585. [DOI] [PubMed] [Google Scholar]
- 31.Knetsch CW, Lawley TD, Hensgens MP, Corver J, Wilcox M, et al. (2013) Current application and future perspectives of molecular typing methods to study Clostridium difficile infections. Eurosurveillance 18. [DOI] [PubMed]
- 32.Kuijper E, van den Berg RJ, Brazier J (2009) Comparison of Molecular Typig Methods Applied to Clostridium difficile; Caugant D, editor: Humana Press. 159–171 p. [DOI] [PubMed] [Google Scholar]
- 33. Rupnik M, Brazier JS, Duerden BI, Grabner M, Stubbs SLJ (2001) Comparison of toxinotyping and PCR ribotyping of Clostridium difficile strains and description of novel toxinotypes. Microbiology 147: 439–447. [DOI] [PubMed] [Google Scholar]
- 34. Spigaglia P, Barbanti F, Dionisi AM, Mastrantonio P (2010) Clostridium difficile isolates resistant to fluoroquinolones in Italy: emergence of PCR ribotype 018. J Clin Microbiol 48: 2892–2896. [DOI] [PMC free article] [PubMed] [Google Scholar]
- 35. Indra A, Huhulescu S, Schneeweis M, Hasenberger P, Kernbichler S, et al. (2008) Characterization of Clostridium difficile isolates using capillary gel electrophoresis-based PCR ribotyping. J Med Microbiol 57: 1377–1382. [DOI] [PMC free article] [PubMed] [Google Scholar]
Associated Data
This section collects any data citations, data availability statements, or supplementary materials included in this article.
Supplementary Materials
ATPase α V-Type gene-based dendrogram. Neighbor joining dendrogram reflecting the ATPase α V-Type-based species similarity for all 48 analyzed C. difficile strains. The distance matrix was computed using the Hamming distance with the ATPase α V-Type genes from the 48 C. difficile isolates. The PCR-ribotype is indicated in brackets. All C. difficile strains cluster together according to their PCR ribotype.
(EPS)
ATPase α F1F10 gene-based dendrogram. Neighbor joining dendrogram reflecting the DNA ATPase α F1F10-based species similarity for all 48 analyzed C. difficile strains. The distance matrix was computed using the Hamming distance with the ATPase α F1F10 genes from the 48 C. difficile isolates. The PCR-ribotype is indicated in brackets. All C. difficile strains cluster together according to their PCR ribotype.
(EPS)
ATPase β V-Type gene-based dendrogram. Neighbor joining dendrogram reflecting the ATPase β V-Type-based species similarity for all 48 analyzed C. difficile strains. The distance matrix was computed using the Hamming distance with the ATPase β V-Type genes from the 48 C. difficile isolates. The PCR-ribotype is indicated in brackets. All C. difficile strains cluster together according to their PCR ribotype.
(EPS)
ATPase β F1F10 gene-based dendrogram. Neighbor joining dendrogram reflecting the DNA ATPase β F1F10-based species similarity for all 48 analyzed C. difficile strains. The distance matrix was computed using the Hamming distance with the ATPase β F1F10 genes from the 48 C. difficile isolates. The PCR-ribotype is indicated in brackets. All C. difficile strains cluster together according to their PCR ribotype.
(EPS)
Elongation factor G gene-based dendrogram. Neighbor joining dendrogram reflecting the Elongation factor G gene-based species similarity for all 48 analyzed C. difficile strains. The distance matrix was computed using the Hamming distance with the Elongation factor G genes from the 48 C. difficile isolates. The PCR-ribotype is indicated in brackets. All C. difficile strains cluster together according to their PCR ribotype.
(EPS)
DNA gyrase B gene-based dendrogram. Neighbor joining dendrogram reflecting the DNA gyrase B gene-based species similarity for all 48 analyzed C. difficile strains. The distance matrix was computed using the Hamming distance with the DNA gyrase B genes from the 48 C. difficile isolates. The PCR-ribotype is indicated in brackets. All C. difficile strains cluster according to their PCR ribotype.
(EPS)
Heatshock protein 60 gene-based dendrogram. Neighbor joining dendrogram reflecting the heat shock protein 60 gene-based species similarity for all 48 analyzed C. difficile strains. The distance matrix was computed using the Hamming distance with the heat shock protein 60 genes from the 48 C. difficile isolates. The PCR-ribotype is indicated in brackets. All C. difficile strains cluster according to their PCR ribotype.
(EPS)
Heatshock protein 70 gene-based dendrogram. Neighbor joining dendrogram reflecting the heat shock protein 70 gene-based species similarity for all 48 analyzed C. difficile strains. The distance matrix was computed using the Hamming distance with the heat shock protein 70 genes from the 48 C. difficile isolates. The PCR-ribotype is indicated in brackets. All C. difficile strains cluster according to their PCR ribotype.
(EPS)
Initiation factor gene-based dendrogram. Neighbor joining dendrogram reflecting the Initiation factor gene-based species similarity for all 48 analyzed C. difficile strains. The distance matrix was computed using the Hamming distance with the Initiation factor genes from the 48 C. difficile isolates. The PCR-ribotype is indicated in brackets. All C. difficile strains cluster according to their PCR ribotype.
(EPS)
Recombinase gene-based dendrogram. Neighbor joining dendrogram reflecting the similarity for all 48 analyzed C. difficile strains based on the gene for recombinase. The distance matrix was computed using the Hamming distance with the recombinase genes from all 48 C. difficile isolates. The strains always cluster according to their PCR ribotype. The PCR-ribotype is indicated in brackets.
(EPS)
RNA polymerase A gene-based dendrogram. Neighbor joining dendrogram reflecting the similarity for all 48 analyzed C. difficile strains based on the gene for RNA polymerase A. The distance matrix was computed using the Hamming distance with the RNA polymerase A genes from all 48 C. difficile isolates. The strains always cluster according to their PCR ribotype. The PCR-ribotype is indicated in brackets.
(EPS)
RNA polymerase B gene-based dendrogram. Neighbor joining dendrogram reflecting the similarity for all 48 analyzed C. difficile strains based on the gene for RNA polymerase B. The distance matrix was computed using the Hamming distance with the RNA polymerase B genes from all 48 C. difficile isolates. The strains always cluster according to their PCR ribotype. The PCR-ribotype is indicated in brackets.
(EPS)
RNA polymerase C gene-based dendrogram. Neighbor joining dendrogram reflecting the similarity for all 48 analyzed C. difficile strains based on the gene for RNA polymerase C. The distance matrix was computed using the Hamming distance with the RNA polymerase C genes from all 48 C. difficile isolates. The strains always cluster together according to their PCR ribotype. The PCR-ribotype is indicated in brackets.
(EPS)
Dendrogram based on the concatenated sequences of the 14 conserved genes. Neighbor joining dendrogram reflecting the similarity for all 48 analyzed C. difficile strains based on the concatenated sequences of the 14 conserved genes. The distance matrix was computed using the Hamming distance with these sequences from all 48 C. difficile isolates. The strains always cluster according to their PCR ribotype. The PCR-ribotype is indicated in brackets. Strains with ribotype 027 build two sub-clusters.
(EPS)
Binary toxin A gene-based dendrogram. Neighbor joining dendrogram reflecting the similarity for all 22 analyzed C. difficile strains based on the gene for binary toxin A. The distance matrix was computed using the Hamming distance with the binary toxin A genes from all 22 C. difficile isolates. The strains always cluster according to their PCR ribotype. The PCR-ribotype is indicated in brackets.
(EPS)
Binary toxin B gene-based dendrogram. Neighbor joining dendrogram reflecting the similarity for all 42 analyzed C. difficile strains based on the gene for binary toxin B. The distance matrix was computed using the Hamming distance with the binary toxin B genes from all 42 C. difficile isolates. The strains always cluster according to their PCR ribotype. The PCR-ribotype is indicated in brackets.
(EPS)
Binary toxin R gene-based dendrogram. Neighbor joining dendrogram reflecting the similarity for all 42 analyzed C. difficile strains based on the gene for binary toxin R. The distance matrix was computed using the Hamming distance with the binary toxin R genes from all 42 C. difficile isolates. The strains always cluster according to their PCR ribotype. The PCR-ribotype is indicated in brackets.
(EPS)
Toxin C gene-based dendrogram. Neighbor joining dendrogram reflecting the similarity for 47 C. difficile strains based on the gene for toxin C. The distance matrix was computed using the Hamming distance with the toxin C genes from the 47 C. difficile isolates containing this gene. The strains always cluster according to their PCR-ribotype. The PCR-ribotype is indicated in brackets.
(EPS)
Distance Matrices of all analysed genes.
(XLSX)
Listing of all identified specific genes in every comparison.
(XLSX)
Listing of the number of all computed core-genomes and specific genes.
(XLSX)