

Abstract
RNA sequencing (RNA-Seq) allows for the identification of novel exon-exon junctions and quantification of gene expression levels. We show that from RNA-Seq data one may also detect utilization of alternative polyadenylation (APA) in 3′ untranslated regions (3′ UTRs) known to play a critical role in the regulation of mRNA stability, cellular localization and translation efficiency. Given the dynamic nature of APA, it is desirable to examine the APA on a sample by sample basis. We used a Poisson hidden Markov model (PHMM) of RNA-Seq data to identify potential APA in human liver and brain cortex tissues leading to shortened 3′ UTRs. Over three hundred transcripts with shortened 3′ UTRs were detected with sensitivity >75% and specificity >60%. tissue-specific 3′ UTR shortening was observed for 32 genes with a q-value ≤ 0.1. When compared to alternative isoforms detected by Cufflinks or MISO, our PHMM method agreed on over 100 transcripts with shortened 3′ UTRs. Given the increasing usage of RNA-Seq for gene expression profiling, using PHMM to investigate sample-specific 3′ UTR shortening could be an added benefit from this emerging technology.
Keywords: Untranslated region, Alternative polyadenylation, Microarray
1. Introduction
For several years there has been plenty of attention paid to the upstream (5′) region of genes in terms of the role of cap sites, alternative promoters and enhancer sequences in the regulation of gene expression. The 3′ untranslated regions (3′ UTRs), although non-coding, is an additional genomic region that is important in gene regulation. Within the 3′ UTR are microRNA (miRNA) binding sites, polyadenylation sites and sequence elements that regulate mRNA stability, alternative polyadenylation (APA), cellular localization and mRNA translation efficiency (Foat et al., 2005; Neilson and Sandberg, 2010; von Roretz and Gallouzi, 2008). Recently, APA has garnered interest as a putative regulatory event (Di Giammartino et al., 2011; Lutz, 2008). For instance, using 3′ rapid amplification of cDNA ends (RACE), it was revealed that APA and alternative cleavage generate shorter isoforms of proto-oncogene mRNAs leading to tumorigenesis (Mayr and Bartel, 2009). Also, APA has been implicated in genomic imprinting, cell development, cell differentiation and tissue specificity mostly using EST databases or microarrays (Ji et al., 2009; MacDonald and McMahon, 2010; MacIsaac et al., 2012; Winter et al., 2007; Zhang et al., 2005). Unfortunately, the under-representation and lack of sequencing depth in expressed sequence tag (EST) databases, ill-defined microarray probes as well as simplistic ways of analyzing the 3′ end of transcripts have limited the ability to definitively identify or accurately predict APA sites (D'Mello et al., 2006), for example, between tissues, due to biological conditions or during cell cycle progression.
The advent of next generation sequencing has revolutionized the manner in which DNA is sequenced and genomic events are monitored (Metzker, 2010). RNA-Seq has the potential to capture the expression of every gene and its isoform(s)genome-wide whether the gene is characterized or not and independent of the underlying, presumed gene model (Wang et al., 2009). Recently, RNA-Seq data and clustering of cleavage sites were used to profile APA switching of genes between breast cancer and normal cells (Fu et al., 2011). Although their approach can detect APA switching and new polyadenylation sites, the clustering strategy is ad-hoc and has the potential to attenuate the specificity of polyadenylation cleavage. This can pose potentially mis-leading interpretations especially when investigating the role of miRNA regulation at the 3′ UTR. The development of polyadenylation site sequencing (PAS-Seq) improves the quantification of the abundance of polyadenylated RNA but still relies on the clustering of the cleavage sites for determining 3′ UTR shortening (Shepard et al., 2011; Smibert et al., 2012). Modeling alternative tandem 3′ UTRs in a dynamic fashion is an important problem in posttranscriptional regulation of mRNA and the progression of disease processes (Conne et al., 2000). This motivated us to develop an RNA-Seq analysis method that specifically targets the 3′ UTR and dynamically models gene expression termination at polyadenylation sites.
Here we used RNA-Seq data and a dynamic approach to identify shortening of 3′ UTRs. Our approach uses a Poisson hidden Markov model (PHMM) to 1) estimate (hidden) states of gene expression levels in terminal exon 3′ UTRs, 2) infer shortening of the region in human liver and brain cortex tissues and 3) demonstrate tissue-specific APA. Others have used hidden Markov models (HMMs) in a similar fashion to dynamically map chromatin states (Ernst et al., 2011), to integrate genomic data (Day et al., 2007) and for determination of gene copy number variations (Mahmud and Schliep, 2011) just to name a few. We compare our results to those obtained by MISO, a probabilistic approach to quantification of transcripts at the 3′ UTR (Katz et al., 2010) and Cufflinks, based on de novo transcript assembly (Trapnell et al., 2010). Given the increasing usage of RNA-Seq for gene expression profiling, investigating APA in 3′ UTR could be an added benefit from the technology. Also, we raise a cautionary note of using static gene models and/or some alternative definitions of chip design files (CDFs) for gene expression arrays to infer transcription regulation at the 3′ end.
2. Materials and methods
2.1. Data
RNA-Seq dataset: two samples from two distinct tissues, both available publicly, were chosen in this study; one is from human prefrontal cortex, (data accessible at NCBI GEO database (Edgar et al., 2002), GEO ID: GSM752694) and the other from liver (GEO ID: GSM752706) (Brawand et al., 2011). The reads of 76 bases were collected from samples run on the Illumina Genome Analyzer IIx. Raw sequence reads were downloaded from the Sequence Read Archive (SRA) (Sayers et al., 2012) with the sequence run SRA ID: SRR306841 and SRA ID: SRR306856.
Affymetrix 3′ in vitro transcription (IVT) gene expression dataset: the raw cel files for the cortex (GEO ID: GSM341524) and liver (GEO ID: GSM341524) were downloaded from GEO. These samples were run on the Human Genome U133 Plus 2.0 Array platform (Harris et al., 2009).
2.2. Mapping reads to the human genome
For each sample, we first aligned the RNA-Seq reads to the human genome sequences (version hg 19), using the Bowtie aligner (Langmead et al., 2009). Reads mapped to less than or equal to 10 locations were reported, and a maximum of 2 mismatches were allowed in the first 28 bases (the default parameters in Bowtie).
2.3. Detection of shortened 3′ UTRs by Poisson hidden Markov models
We first collected all the terminal exons located within the 3′ UTR region of the RefSeq (Pruitt et al., 2007) transcripts. The Bioconductor (Gentleman et al., 2004) package “GenomicFeatures” provides handy tools for this purpose. Only exons with unique genomic coordinates and with length (l) greater than 600 bps were retained. Next, we examined the distribution of mapping positions in the terminal exons of 3′ UTRs. A sliding window of k base-pairs (bp) was applied o each terminal exon, where the number of reads mapped to each sliding window was recorded and where
In order to identify the potential shortened 3′ UTR of a gene transcript, we applied the Poisson-based hidden Markov models (PHMMs) to the sequences of read counts obtained above. If the total read counts (from all windows) is less than 10, we do not perform the model fitting due to low coverage. Briefly, in PHMMs one considers a sequence of discrete observations {Yt}t ∈ N, which are assumed to be generated from a sequence of unobservable finite state Markov chains {Xt}t ∈ N with a finite state space Sx = 1, 2 … m, and the random variable Yt conditioned on Xt has a Poisson distribution for every t. Specifically, if Xt = i(i ∈ Sx), the emission probabilities Πy,i are given by a Poisson distribution with parameter λi, i.e.,
| (1) |
Next, let γi,j be the transition probability from state i at time t − 1 to state j at time t, and we assume
| (2) |
for any i, j ∈ Sx. By defining the emission and transition probabilities, along with the initial state probabilities, one can estimate all the unknown parameters for a given observed sequence Yt, using the maximum likelihood approach. In our case, Yt is a sequence of read counts with t = 1,2,…,n, where n is the number of k-bp sliding windows in a 3′ terminal exon. We fit the sequence with a two-state PHMM, i.e. Sx = 1, 2, with parameters estimated by the Expectation and Maximization (EM) method using the depmixS4 R package. Transcripts with potential shortened 3′ UTRs (i.e. having 2 or more states) were selected based on the Bayesian information criterion (BIC) of the model fits as follows:
where BIC1 is the Bayesian information criterion from the 1-state model and BIC2 is the Bayesian information criterion from the 2-state model. If a 2-state model is preferred, we only select transcripts with transitions from high-expression state to the low-expression state (as here we only focus on 3′ UTR shortening). R statistical software code for PHMM is publicly available at: http://www.niehs.nih.gov/research/resources/software/biostatistics/phmm.
2.4. Data processing and analysis
We used the R statistical computing environment (R Development core team, 2012) to perform most of the data analyses. The Bioconductor repository (Gentleman et al., 2004) packages Rsamtools (Morgan and Pagès) was used for summarization of the read counts from the bam files and the affy package (Gautier et al., 2004) for extracting Affymetrix probe-level gene expression data from the raw cel files.
2.5. Detection of 3′ UTR shortening and tissue-specificity analysis
For each tissue (liver and cortex), transcripts with a high level of expression at the 3′ UTR (Mu1) ≥ 10 were considered reliable. Of those, transcripts with a low level of expression at the 3′ UTR Mu2) were excluded. For each remaining ith transcript, the ratio of Mu1/Mu2 was log2 transformed. To estimate variance, we use the median absolute deviation (MAD) from the ratios values since it is more resilient to outliers in data than the standard deviation.
where x̃ is the median value from the distribution of the data. We use 1.4826*MAD as a robust estimate of the standard deviation σ since E(MAD) = 0.6745 * σ. Using x̃ and MAD, we transform the ratio values to modified Z-scores defined as follows:
and detect transcripts with a shorten 3′ UTR within a given tissue using a ratio of Mu1/Mu2 ≥ 5 (approximately Mi ≥ −1.5). To determine sensitivity and specificity of detecting 3′ UTR shortening, we used the human brain PolyA-Seq data from Merck Research Laboratories available as BigWig tracks in the UCSC Genome Browser (Dreszer et al., 2012; Karolchik et al., 2003; Kuhn et al., 2009) and deposited in the NCBI GEO database (GEO ID: GSE30198). Of the 392 transcripts in the cortex with PHMM modeled fitted parameters, the 331 transcripts matching the ones from the PolyA-Seq track with a transcript having a terminal exon 3′ UTR > 600 and a polyA site signal ≥ 1.02 in the 3′ UTR were reserved for measuring performance of PHMM detection of 3′ UTR shortening. Those with an alternative polyA site ≥ 10 bps upstream from the end of the 3′ UTR were deemed as having a shortened 3′ UTR (true positives). The remaining ones were considered having a full-length 3′ UTR (true negatives). We define
and
Sensitivity is the probability of a positive detection given that the 3′ UTR is shortened. Specificity is the probability of a negative detection given that the 3′ UTR is full length. Statistical significance of a shorten 3′ UTR for a transcript between tissues is determined using a Fisher's exact test. The mean of the read counts as integers for the high expression state and the low expression state (padded by 5 to account for zero counts) are used for comparing the proportions between the two tissues. For the 783 genes with PHMM modeled fitted parameters, the corresponding p-values of the Fisher's exact test are computed from the hypergeometric distribution. A false discovery rate (Storey, 2002, 2003) q-value ≤ 0.1 is used as a threshold for the significance of the difference of 3′ UTR shortening between the two tissues.
2.6. Transcript assembly and 3′ UTR comparisons between tissues using Cufflinks
Using the Bowtie (Langmead et al., 2009) aligned RNA-Seq reads to the human genomic sequences (hg 19), exon boundaries were located using TopHat (Langmead et al., 2009; Trapnell et al., 2009). Aligned reads were then assembled de novo into transcripts using Cufflinks (Trapnell et al., 2010) to generate accepted_hits files. Finally, we used Cufflinks' Cuffdiff option followed by CuffCompare to compare the 3′ UTR of each RefSeq transcript between the two tissues (liver and cortex).
2.7. Probabilistic (MISO) approach to quantification of transcripts at the 3′ UTR
Based on the TopHat/Cufflinks assembled transcripts (accepted_hits files), the quantification of the reads for each tissue (liver and cortex) at the 3′ UTR of each RefSeq transcript was determined using the mixture of isoforms (MISO) approach (Katz et al., 2010) with default settings. MISO uses a Bayesian inference to compute the probability that a read originated from a particular isoform. Given a transcript's 3′ UTR, two kinds of isoforms are expected: a shorter form based on more proximal (core region) polyA site and a long form based on the most distal (extension region) polyA site. The full length 3′ UTR is comprised of the core and extension regions. The polyA sites were obtained from the PolyA_DB2 database (Lee et al., 2007). Transcripts with full length 3′ UTR > 600 bps and > 5 reads counts at the core and extension regions were considered to have shortened 3′ UTRs.
3. Results
3.1. Identification of genes with shortened 3′ UTRs from RNA-Seq data
We aimed to detect genes with potential shortened 3′ UTRs. A previous study showed that, during the mouse stem cell differential into neuron cells, more than 90% of APA events occur in the terminal exons, which suggests that a vast majority of APA events are splicing-independent (Shepard et al., 2011). Here, the main focus is placed on the 3′ UTR. Our analysis process includes the following steps (Fig. 1). First, a total of 33,442 terminal exons were collected based on human transcript annotations (version hg19) from the refGene table in the UCSC Genome Browser (Dreszer et al., 2012; Karolchik et al., 2003; Kuhn et al., 2009). The duplicated exons were removed, and short exons (with length ≤600 base pairs (bp)) were excluded from further analysis. After the filtering, about 12,500 terminal exons were retained. Next, we mapped the RNA sequencing reads to the human genome (version hg19). The sequencing reads were prepared from two tissues (cortex and liver) and about 17–18 million mapped reads were obtained for each sample.
Fig. 1.
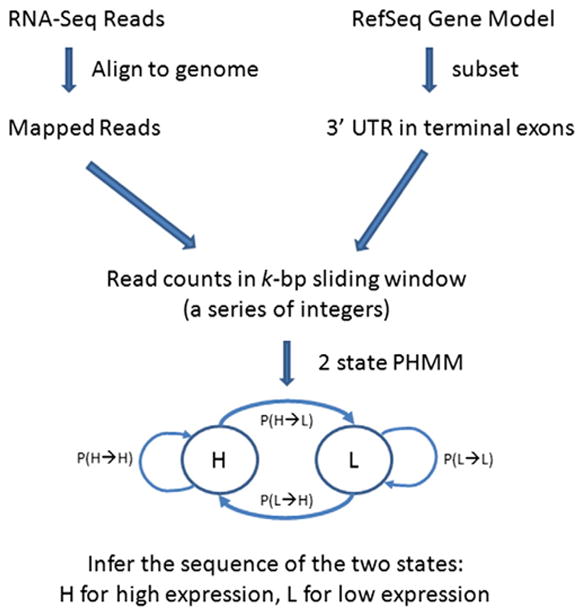
Workflow to model shortened polyA sites. A Poisson hidden Markov model (PHMM) is constructed to infer the sequence of two states using a series of integers obtained from RNA-Seq reads mapped to the 3′ untranslated region (UTR) of RefSeq transcripts. The two states are H for high expression and L for low expression. The lines with the arrows represent transitions from state to state. P (X→Y) is the probability of transitioning from state X to state Y. Note that we only selected transcripts with transitions from H→L in detecting APA.
Our next step was to compute the read coverage in the terminal exons in a k-bp sliding window (depending on the exon length), using alignments from the mapping to the genome. For each terminal exon and in each sample, we obtained – in the direction of 5′ to 3′ ends – a sequence of read counts from sliding windows. Next, to identify a shortened 3′ UTR, we fitted a two-state PHMM using the sequence of read counts as input. The boundary between the state 1(high expression) and 2 (low expression) presumably is where the short version of transcript ends. For example, given a sequence of observed counts (23,30,20,19,2,3,4,3), the inferred states from PHMM could be (1,1,1,1,2,2,2,2). This shows that the predominant version of transcripts ends at the window 4. Our initial attention was applied to genes expressed in both tissues.
As shown in the cluster heat map of the mean expression for the state with high-level (Mu1) or low-level (Mu2) expression (Fig. 2), several transcripts had high expression at one polyadenylation site, but several have two polyadenylation sites. With an arbitrary ratio cutoff of 5 between the two means and a minimal mean tag count of 10 in the state 1 (i.e. the state with a higher Poisson mean), 391 transcripts are identified to show potential shortened 3′ UTRs in liver and 392 in cortex (Supplementary Table 1). There were 280 transcripts with a shortened 3′ UTR in common between the two tissues and 783 from the union of the two tissues.
Fig. 2.
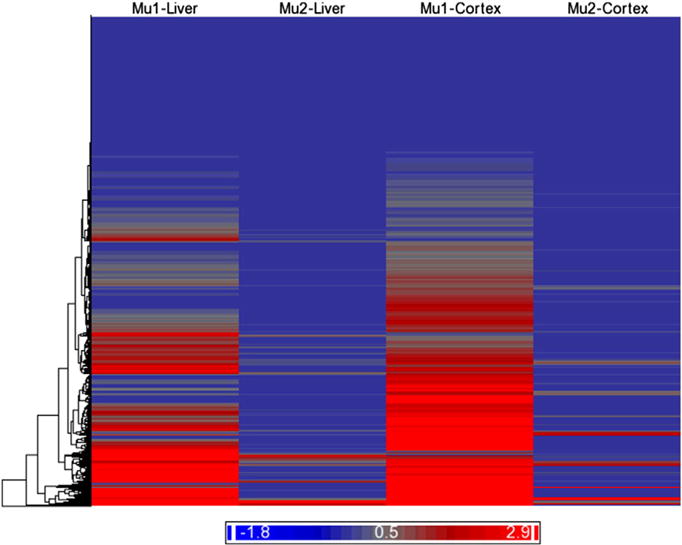
Clustering and heat map of transcripts by expression state. The columns represent the mean expression for the state with high-level (Mu1) or low-level (Mu2) transcripts within the 3′ UTR of the liver or cortex samples. The rows represent the 12,189 RefSeq transcripts group by Euclidean distance and average linkage. The color spectrum indicates the degree of expression as represented as the log2(x + 1) where x is the ratio of the mean of the expression state within a given tissue (liver or cortex) divided by the mean of the expression for all the states across both tissues.
Table 1 lists the expression state characteristics for the 3′ UTR of selected transcripts. As can be seen, several transcripts in the liver and the cortex exhibited a high fold change between the mean expression for the state with high-level expression and that for the state with low expression. Fig. 3 illustrates one example. The transcript NM_001731 (Gene symbol, BTG1) has a long 3′ UTR (∼4 kb) from the RefSeq annotation. Based on the read coverage from the RNA-Seq data, however, in both the liver and cortex tissues the actual length of this 3′ UTR region is only around 1 kb. The observed 3′ UTR end matches one of the polyadenylation sites (Hs.255935.1.3) in PolyA_DB (Tian et al., 2005) and predicted polyA site (NM_001731.polyA-1) using a support vector machine (SVM) listed in the UCSC Genome Browser track. In addition, we observed 32 transcripts showing tissue-specific 3′ UTR shortening with a false discovery rate q-value ≤ 0.1 (Table 2). The HDLBP gene transcript NM_005336 has sequence read coverage across the RefSeq annotated 3′ UTR region (∼2.0 kb) in cortex. In contrast, in liver the reads are mapped to the transcript to ∼500 bp from the start of the 3′ UTR (Fig. 4A). The difference between this coverage is significant at q-value = 0.062. Again the observed shortened and full length 3′ UTRs seem to match the APA sites from the annotation in PolyA_DB and some annotated transcript ends from AceView (Thierry-Mieg and Thierry-Mieg, 2006). This clearly suggests that at least two versions of the transcript exist in the data, with the longer version predominantly expressed in the cortex and the short version in the liver. Note that this gene could be a potential target of a couple of miRNAs from the TargetScan database (Lewis et al., 2003) (Fig. 4B).
Table 1.
Expression state characteristics for 3′ UTR of selected transcripts.
| Transcript | Liver | Cortex | ||||||||
|---|---|---|---|---|---|---|---|---|---|---|
|
|
|
|||||||||
| mu.1 | mu.2 | ns | total.length | n1.length | mu.1 | mu.2 | ns | total.length | n1.length | |
| NM_183078 | 9.50 | 6.69E–13 | 2 | 19 | 2 | 52.50 | 1.29 | 2 | 19 | 2 |
| NM_002489 | 67.50 | 5.17E–12 | 2 | 16 | 2 | 246.00 | 1.86 | 2 | 16 | 2 |
| NM_001731 | 36.00 | 3.11E–12 | 2 | 19 | 5 | 35.20 | 0.07 | 2 | 19 | 5 |
| NM_014178 | 11.00 | 3.65E–12 | 2 | 6 | 2 | 27.00 | 13.40 | 2 | 6 | 1 |
| NM_181671 | 7.67 | 1.67E–01 | 2 | 9 | 3 | 32.02 | 13.46 | 2 | 9 | 2 |
| NM_005474 | 17.00 | 4.67E–01 | 2 | 16 | 1 | 32.00 | 15.93 | 2 | 16 | 1 |
Fig. 3.
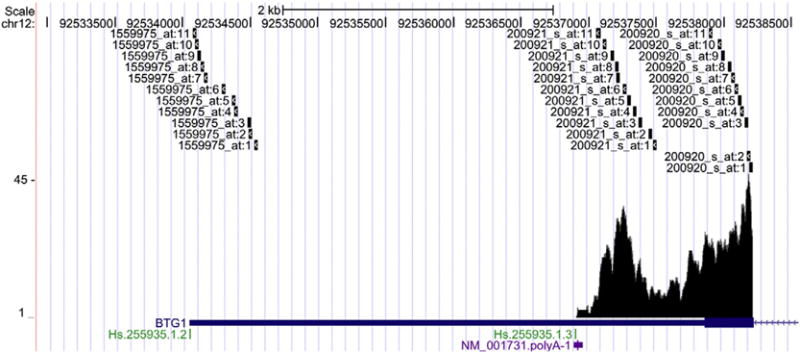
Affymetrix probes spanning the 3′ UTR of BTG1. The BTG1 gene, shown on the antisense strand of chromosome (chr) 12, is represented by RefSeq accession# NM_001731 and UniGene cluster IDs Hs.255935.1.2 and Hs.255935.1, and contains the 3 probe-pair probesets and mapping of RNA-Seq reads at the 3′ UTR. The predicted polyA site (NM_001731.polyA-1) from the UCSC Genome Browser is shown. One of the three probe-pairs does not target RNA-seq reads beyond the predicted polyA site. The x-axis denotes the chr position and the y-axis reflects the coverage of the mapped reads.
Table 2.
Transcripts with tissue specific alternative polyadenylation.
| Transcript | mu.1 – Liver | mu.2 – Liver | mu.1 – Cortex | mu.2 – Cortex | p-value | q-value |
|---|---|---|---|---|---|---|
| NM_001130012 | 604.20 | 22.80 | 34.83 | 13.44 | 6.7E–10 | 0.062 |
| NM_005336 | 380.00 | 31.67 | 193.00 | 61.44 | 9.2E–09 | 0.062 |
| NM_054027 | 320.67 | 9.58 | 347.00 | 64.67 | 3.4E–08 | 0.062 |
| NM_004500 | 423.00 | 21.00 | 150.33 | 32.00 | 7.0E–07 | 0.062 |
| NM_004905 | 282.00 | 33.63 | 75.50 | 32.14 | 2.8E–06 | 0.062 |
| NM_000990 | 283.00 | 4.78 | 129.00 | 16.67 | 4.2E–05 | 0.062 |
| NM_004544 | 195.00 | 2.69 | 184.50 | 27.81 | 7.1E–05 | 0.062 |
| NM_002490 | 119.00 | 18.80 | 90.00 | 48.20 | 9.9E–05 | 0.062 |
| NM_001009880 | 181.00 | 11.33 | 286.03 | 68.13 | 1.0E–04 | 0.062 |
| NM_015703 | 199.00 | 10.30 | 68.25 | 16.00 | 1.8E–04 | 0.062 |
| NM_002137 | 565.00 | 27.55 | 433.50 | 52.30 | 2.2E–04 | 0.062 |
| NM_174929 | 131.96 | 36.56 | 198.20 | 16.83 | 2.5E–04 | 0.062 |
| NM_001752 | 631.50 | 50.50 | 20.08 | 5.06 | 5.0E–04 | 0.062 |
| NM_015989 | 469.00 | 21.43 | 15.00 | 2.43 | 7.1E–04 | 0.062 |
| NM_006830 | 324.50 | 6.88 | 162.50 | 15.00 | 8.1E–04 | 0.062 |
| NM_032827 | 246.67 | 4.50 | 8.33 | 0.38 | 8.9E–04 | 0.062 |
| NM_001177306 | 5.81 | 0.12 | 119.00 | 0.86 | 1.2E–03 | 0.062 |
| NM_001035513 | 127.67 | 15.50 | 82.00 | 31.38 | 1.4E–03 | 0.062 |
| NM_001130970 | 87.11 | 15.56 | 196.33 | 8.83 | 1.6E–03 | 0.062 |
| NM_005440 | 229.00 | 8.85 | 70.67 | 10.77 | 1.6E–03 | 0.062 |
| NM_001035511 | 123.67 | 13.75 | 93.00 | 32.89 | 1.6E–03 | 0.062 |
| NM_013399 | 53.31 | 12.60 | 217.08 | 15.80 | 1.6E–03 | 0.062 |
| NM_001168254 | 39.66 | 5.43 | 137.00 | 1.60 | 1.9E–03 | 0.062 |
| NM_005742 | 145.00 | 28.80 | 58.49 | 29.60 | 2.0E–03 | 0.062 |
| NM_005801 | 303.50 | 90.17 | 515.00 | 241.00 | 2.3E–03 | 0.065 |
| NM_178819 | 204.50 | 14.57 | 122.00 | 25.71 | 2.8E–03 | 0.069 |
| NM_006476 | 84.00 | 4.00 | 114.00 | 31.67 | 4.1E–03 | 0.085 |
| NM_017811 | 120.00 | 22.08 | 91.00 | 41.64 | 4.5E–03 | 0.088 |
| NM_005563 | 4.48 | 0.50 | 697.80 | 59.00 | 5.0E–03 | 0.091 |
| NM_001165417 | 114.00 | 31.75 | 75.80 | 3.00 | 5.6E–03 | 0.096 |
| NM_052845 | 270.00 | 20.21 | 37.00 | 7.86 | 5.9E–03 | 0.098 |
| NM_000019 | 246.00 | 1.20 | 27.50 | 0.60 | 6.4E-03 | 0.100 |
Fig. 4.
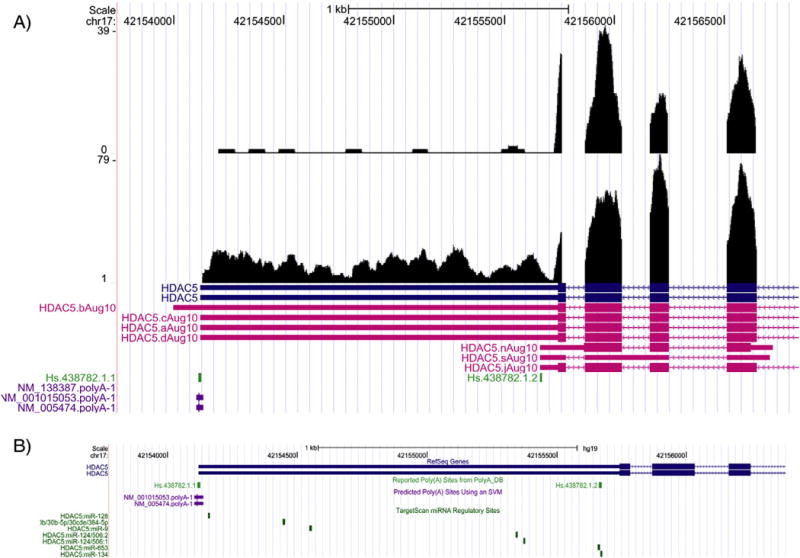
Differential alternative polyadenylation of the HDAC5 gene. A) The HDAC5 gene, shown on the antisense strand of chromosome (chr) 17, is represented by RefSeq accession# NM_005474 and UniGene cluster IDs Hs.438782.1.1 and Hs.438782.1.2 and contains the mapping of RNA-Seq reads at the 3′ UTR in liver (top track) and cortex (bottom track) tissues. The predicted polyA sites (NM_138387.polyA-1, NM_001015053.polyA-1, and NM_005474.polyA-1) are shown. The x-axis denotes the chr position and the y-axis reflects the coverage of the mapped reads. B) Shown are the potential targets of 7 miRNAs (from the TargetScan database) to the 3′ UTR of the HDAC5 gene. The x-axis denotes the chr position.
3.2. Performance of detecting shortened 3′ UTRs
Strand-specific polyA sequencing (PolyA-Seq) has been found to be as accurate for digital gene expression as existing RNA sequencing approaches and also superior to microarrays for gene expression analysis (Derti et al., 2012). The mapping of polyA sites in normal tissues are publicly available as Merck Research Laboratories BigWig tracks in the UCSC Genome Browser (Dreszer et al., 2012; Karolchik et al., 2003; Kuhn et al., 2009) and deposited in the NCBI GEO database (GEO ID: GSE30198). We used the PolyA-Seq data from the forward and reverse strands of the brain tissue for “ground truth” as to where the polyA site is located. Of the 392 transcripts with PHMM modeled fitted parameters, 331 transcripts were the equivalent in either the brain forward or reverse PolyA-Seq track having a terminal exon 3′ UTR > 600 and a polyA site signal ≥ 1.02 in the 3′ UTR. These were used for measuring performance of PHMM detection of 3′ UTR hortening (Supplementary Table 2). The transcripts with an alternative polyA site ≥ 10 bps upstream from the end of the 3′ UTR were deemed as having a shortened 3′ UTR (true positives). The remaining ones were considered having a full-length 3′ UTR (true negatives). As determined from the proportions of true positives and true negatives (Table 3), PHMM detected shortening of 3′ UTRs with sensitivity = 79.1% and specificity = 60.4%. Taking the strands separately, PHMM predicted the shortening of 3′ UTRs in transcripts in the forward orientation with a sensitivity = 82.1% and specificity = 60%. 3′ UTR shortening of transcripts in the reverse orientation was detected with sensitivity = 75.7% and specificity = 60.7%.
Table 3.
Performance of PHMM prediction of 3′ UTR shortening in brain tissue.
| Ground truth | |||
|---|---|---|---|
|
| |||
| Shortened 3′ UTR | Full length 3′ UTR | ||
| PHMM test | Predicted shortened | 174 | 44 |
| Predicted not shortened | 46 | 67 | |
3.3. Comparison of shorten 3′ UTR detection to other methods
We compared PHMM's detection of shortened 3′ UTRs in the liver and the cortex to MISO, a probabilistic approach to quantification of transcripts at the 3′ UTR (Katz et al., 2010) and Cufflinks, based on de novo transcript assembly (Trapnell et al., 2010). Of the 783 transcripts detected by PHMM, and 539 detected by MISO using the - -compare- samples option, 125 were in common (Supplementary Table 3). These transcripts, containing full length 3′ UTR > 600 bps and > 5 reads counts at the core and extension regions, were considered to have shortened 3′ UTRs. Using the Cuffdiff option followed by CuffCompare in Cufflinks, 2,795 transcripts were detected as having a shortened 3′ UTR, of which 114 overlapped with the 783 detected by PHMM (Supplementary Table 4).
3.4. Implication of 3′ UTR shortening for Affymetrix GeneChip arrays
Some of the popular Affymetrix GeneChip arrays (e.g. hgu133Av2, hgu133plus2) have most probes targeting transcript region near the 3′ region. The variability of the 3′ UTR region can potentially complicate the analysis and interpretation of the results. Again we take the transcript NM_001731 as an example. On the hgu133plus2 array, three probesets are designed to target this transcript: 1559975_at, 200920_s_at and 200921_s_at. The exact mapping locations of the probes within each probeset are shown in Fig. 3. Obviously the probeset 1559975_at targets a region where no read coverage is observed. In contrast to the RNA-Seq data, we observe lower mean signal intensity values on the Affymetrix GeneChips for this probeset as compared to the other two probesets (Fig. 5). This result further supports that in liver, NM_001731 has a shortened 3′ UTR than the one annotated in RefSeq. Our observation also cautions against averaging gene expression values from different probesets of the same gene.
Fig. 5.
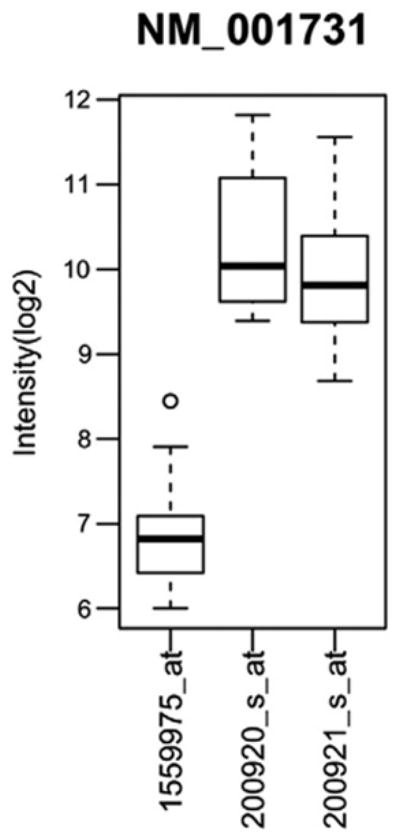
Microarray (Affymetrix) gene expression of 3′ UTR probes targeting the BTG1 gene. The BTG1 gene, represented by RefSeq accession# NM_001731, gene expression in terms of log2 intensity, is shown for 3 probesets designed to target this transcript: 1559975_at, 200920_s_at and 200921_s_at. The spread of the data is represented by box plots where the dark black horizontal line indicates the median, the bottom of the box indicates the lower quartile, the top of the box indicates the upper quartile and a circle to denote an outlier.
Given the variability of 3′ UTR regions, we also notice that some alternative chip design files (CDF) designed for Affymetrix arrays can be problematic. In building the RefSeq based CDF, probes were combined from the 3 probesets together to represent the transcript NM_001731 (Dai et al., 2005) (Supplementary Table 5). From our observation, this strategy is clearly unadvisable as one probeset is off-target due to the 3′ UTR shortening of this transcript.
4. Discussion
The advent of next generation sequencing of RNA (RNA-Seq) has revolutionized functional genomic analysis. At this juncture, the technology not only permits a genome-wide assessment of the transcriptome landscape and mRNA abundance, but also brings forth a clearer picture of the complexity of a gene model in terms of splicing events, gene fusions and allele-specific expression just to name a few. Over the years, an enormous amount of attention has been paid to canonical gene regulatory mechanisms. For instance, much is known about the upstream (5′) region of genes in terms of the role of cap sites, alternative promoters and enhancer sequences in the regulation of gene expression. Recently, more focus has been drawn to the role of 3′ untranslated regions (3′ UTRs) in gene regulation (Mercer et al., 2012). It is known that within the 3′ UTR, there are microRNA (miRNA) binding sites, polyadenylation sites and sequence elements that regulate mRNA stability, alternative polyadenylation (APA), cellular localization and mRNA translation efficiency (Foat et al., 2005; Neilson and Sandberg, 2010; Ramskold et al., 2009; von Roretz and Gallouzi, 2008). The lack of fidelity in conventional expressed sequence tag (EST) databases, the limitations of microarray gene expression technologies, reliance on a static gene model and naive RNA-Seq data modeling of the 3′ end of transcripts have restricted the ability to definitively identify or accurately predict APA.
We developed an approach to dynamically analyze RNA-Seq at 3′ UTRs using a Poisson hidden Markov model (PHMM) and show that our detection of shortened 3′ UTRs is a more advantageous strategy than solely relying on static gene models when comparing transcripts between tissues (Ramskold et al., 2009). Our model is constructed to infer the sequence of two hidden states using a series of read coverage obtained from RNA-Seq reads mapped to the 3′ UTR of transcripts (Fig. 1). The two states are for high expression and for low expression at the 3′ UTR. We identified several transcripts that have shortened 3′ UTRs (Fig. 2, Table 1 and Supplementary Table 1). Although we obtained good sensitivity (>75%) of predicting 3′ UTR shortening (few false negatives), the specificity of prediction was ∼60% (Table 3). The false positive detections could be related to the conservative thresholds we used to identify transcripts with shortened 3′ UTRs. Also, the false positive rate could be due to low polyA signals in the PolyA-Seq data which could lead to a misclassification of a transcript having a full length 3′ UTR. Despite these shortcomings, transcripts with shortened 3′ UTRs detected by our PHMM method had some overlap with transcripts detected by MISO or Cufflinks (Supplementary Tables 3 and 4). The former detecting about the same number of transcripts with shortened 3′ UTRs as PHMM while the latter detecting more transcripts overall due to its de novo transcript assembly capability. Furthermore, although one can potentially search for step changes from a smoothed coverage profile, the heterogeneous nature of the read coverage may lead to several local minima and/or high variability. In addition, selecting a threshold for APA fully relying on the step change is also challenging.
Microarray gene expression data cannot capture the dynamics between these hidden states and also suffers from variability in the expression detected by probes within a probe set (Figs. 3 and 5). Clearly, the reliance on microarray gene expression, predicted polyadenylation sites and/or a particular static gene model will lead to misinterpretations of gene regulation between tissues especially when miRNAs binding might be a contributing factor (Sandberg et al., 2008). The tissue-specific expression of transcript NM_005474 at the 3′ UTR end of the gene is anecdotal evidence that differential APA has the potential to be highly influential in the regulation of gene expression by miRNA binding and our PHMM lends support to ascertain putative polyadenylation switching (Fig. 4).
Modeling the data as a Poisson distributed random variable, heterogeneity in tissue sample cell types and other aspects of the analysis can limit the utility of our PHMM approach. For instance, we used RNA-Seq reads from the Illumina platform but it is still not clear how reproducible RNA-Seq data are between the various technologies. The Food and Drug Administration is leading a MicroArray Quality Control consortium to investigate the technical performance of next-generation sequencing platformsby generating benchmark datasets with reference samples and will presumably provide an evaluation of the advantages of one technology over the other as well as guidance on the limitations of various bioinformatics strategies in RNA and DNA analyses (Asmann et al., 2009; Bullard et al., 2010). Although the Poisson distribution is a reasonable choice for modeling RNA-Seq data with the HMM, it is an approximation, it carries with it assumptions about homogeneity in the data and independence of the samples, but also a property that the variance is equal to the mean. In addition, our current approach detects shortening of 3′ UTRs as previously observed in cancer cells (Mayr and Bartel, 2009), involved in the reprogramming of differentiated pluripotent stem cells (Ji and Tian, 2009) and in different tissues (Zhang et al., 2005), but it does not make inferences for 3′ UTR lengthening as previously reported in mouse embryonic development (Ji et al., 2009). More sophisticated models can presumably be applied to the data; however, they require a lot more samples and complicated ways to estimate model parameters. In addition, RNA-Seq data from heterogeneous samples such as cancer cells can potentially skew or squelch the read counts which are representative of the RNA abundance and hence, lead to unintended interpretations of polyadenylation switching.
Despite the aforementioned caveats, modeling RNA-Seq data with our PHMM can bring about better interpretation of APA in 3′ UTRs than using a specific static gene model and/or predictions when profiling gene expression for comparison between tissues. PHMM 1) affords the comparison of the RNA-Seq read coverage at the 3′ end of genes between samples as we know that gene expression can be tissue-specific at the 3′ UTR and 2) dynamically models the RNA-Seq read counts at the 3′ end of genes rather than relying on a prediction of polyadenylation based on degenerate recognition signals acquired from a heterogeneous expressed sequence tag (EST) database. Further work with the PHMM is ongoing to provide a publicly available database of shortened 3′ UTRs in commonly used biological samples and also to extend the approach for identifying polyadenylation shortening according to transcriptomes constructed using de novo assembly.
Supplementary Material
Acknowledgments
We thank Mercedes Arana and Weichun Huang for their critical review of the manuscript. We also thank Ingmar Visser for helping with model fitting using the depmixS4 R package. This research was supported, in part by, the Intramural Research Program of the National Institutes of Health (NIH) and National Institute of Environmental Health Sciences (NIEHS) [Z01 ES102345-04]
Abbreviations
- RNA-Seq
RNA-sequencing
- APA
alternative polyadenylation
- 3′ UTRs
3′ untranslated regions
- PHMM
Poisson hidden Markov model
- CDFs
chip design files
- miRNA
MicroRNA
- RACE
rapid amplification of cDNA ends
- EST
expressed sequence tag
- PAS-Seq
polyadenylation site sequencing
- GEO
Gene Expression Omnibus
- SRA
Sequence Read Archive
- IVT
in vitro transcription
- bp
base-pairs
- EM
Expectation and Maximization
- BIC
Bayesian information criterion
- SVM
support vector machine
Footnotes
Conflict of interest: The authors declare no competing interests.
Contributor Information
Jun Lu, Email: jason.lu@omicsoft.com.
Pierre R. Bushel, Email: bushel@niehs.nih.gov.
References
- Asmann YW, et al. 3′ tag digital gene expression profiling of human brain and universal reference RNA using Illumina Genome Analyzer. BMC Genomics. 2009;10:531. doi: 10.1186/1471-2164-10-531. [DOI] [PMC free article] [PubMed] [Google Scholar]
- Brawand D, et al. The evolution of gene expression levels in mammalian organs. Nature. 2011;478:343–348. doi: 10.1038/nature10532. [DOI] [PubMed] [Google Scholar]
- Bullard JH, Purdom E, Hansen KD, Dudoit S. Evaluation of statistical methods for normalization and differential expression in mRNA-Seq experiments. BMC Bioinformatics. 2010;11:94. doi: 10.1186/1471-2105-11-94. [DOI] [PMC free article] [PubMed] [Google Scholar]
- Conne B, Stutz A, Vassalli JD. The 3′ untranslated region of messenger RNA: A molecular ‘hotspot’ for pathology? Nat Med. 2000;6:637–641. doi: 10.1038/76211. [DOI] [PubMed] [Google Scholar]
- Dai M, et al. Evolving gene/transcript definitions significantly alter the interpretation of GeneChip data. Nucleic Acids Res. 2005;33:e175. doi: 10.1093/nar/gni179. [DOI] [PMC free article] [PubMed] [Google Scholar]
- Day N, Hemmaplardh A, Thurman RE, Stamatoyannopoulos JA, Noble WS. Unsupervised segmentation of continuous genomic data. Bioinformatics. 2007;23:1424–1426. doi: 10.1093/bioinformatics/btm096. [DOI] [PubMed] [Google Scholar]
- Derti A, et al. A quantitative atlas of polyadenylation in five mammals. Genome Res. 2012;22:1173–1183. doi: 10.1101/gr.132563.111. [DOI] [PMC free article] [PubMed] [Google Scholar]
- Di Giammartino DC, Nishida K, Manley JL. Mechanisms and consequences of alternative polyadenylation. Mol Cell. 2011;43:853–866. doi: 10.1016/j.molcel.2011.08.017. [DOI] [PMC free article] [PubMed] [Google Scholar]
- D'Mello V, Lee JY, MacDonald CC, Tian B. Alternative mRNA polyadenylation can potentially affect detection of gene expression by affymetrix genechip arrays. Appl Bioinformatics. 2006;5:249–253. doi: 10.2165/00822942-200605040-00007. [DOI] [PubMed] [Google Scholar]
- Dreszer TR, et al. The UCSC Genome Browser database: extensions and updates 2011. Nucleic Acids Res. 2012;40:D918–D923. doi: 10.1093/nar/gkr1055. [DOI] [PMC free article] [PubMed] [Google Scholar]
- Edgar R, Domrachev M, Lash AE. Gene Expression Omnibus: NCBI gene expression and hybridization array data repository. Nucleic Acids Res. 2002;30:207–210. doi: 10.1093/nar/30.1.207. [DOI] [PMC free article] [PubMed] [Google Scholar]
- Ernst J, et al. Mapping and analysis of chromatin state dynamics in nine human cell types. Nature. 2011;473:43–49. doi: 10.1038/nature09906. [DOI] [PMC free article] [PubMed] [Google Scholar]
- Foat BC, Houshmandi SS, Olivas WM, Bussemaker HJ. Profiling condition-specific, genome-wide regulation of mRNA stability in yeast. Proc Natl Acad Sci U S A. 2005;102:17675–17680. doi: 10.1073/pnas.0503803102. [DOI] [PMC free article] [PubMed] [Google Scholar]
- Fu Y, et al. Differential genome-wide profiling of tandem 3′ UTRs among human breast cancer and normal cells by high-throughput sequencing. Genome Res. 2011;21:741–747. doi: 10.1101/gr.115295.110. [DOI] [PMC free article] [PubMed] [Google Scholar]
- Gautier L, Cope L, Bolstad BM, Irizarry RA. affy–analysis of Affymetrix GeneChip data at the probe level. Bioinformatics. 2004;20:307–315. doi: 10.1093/bioinformatics/btg405. [DOI] [PubMed] [Google Scholar]
- Gentleman RC, et al. Bioconductor: open software development for computational biology and bioinformatics. Genome Biol. 2004;5:R80. doi: 10.1186/gb-2004-5-10-r80. [DOI] [PMC free article] [PubMed] [Google Scholar]
- Harris LW, Lockstone HE, Khaitovich P, Weickert CS, Webster MJ, Bahn S. Gene expression in the prefrontal cortex during adolescence: implications for the onset of schizophrenia. BMC Med Genomics. 2009;2:28. doi: 10.1186/1755-8794-2-28. [DOI] [PMC free article] [PubMed] [Google Scholar]
- Ji Z, Tian B. Reprogramming of 3′ untranslated regions of mRNAs by alternative polyadenylation in generation of pluripotent stem cells from different cell types. PLoS One. 2009;4:e8419. doi: 10.1371/journal.pone.0008419. [DOI] [PMC free article] [PubMed] [Google Scholar]
- Ji Z, Lee JY, Pan Z, Jiang B, Tian B. Progressive lengthening of 3′ untranslated regions of mRNAs by alternative polyadenylation during mouse embryonic development Proc. Natl Acad Sci U S A. 2009;106:7028–7033. doi: 10.1073/pnas.0900028106. [DOI] [PMC free article] [PubMed] [Google Scholar]
- Karolchik D, et al. The UCSC Genome Browser Database. Nucleic Acids Res. 2003;31:51–54. doi: 10.1093/nar/gkg129. [DOI] [PMC free article] [PubMed] [Google Scholar]
- Katz Y, Wang ET, Airoldi EM, Burge CB. Analysis and design of RNA sequencing experiments for identifying isoform regulation. Nat Methods. 2010;7:1009–1015. doi: 10.1038/nmeth.1528. [DOI] [PMC free article] [PubMed] [Google Scholar]
- Kuhn RM, et al. The UCSC Genome Browser Database: update 2009. Nucleic Acids Res. 2009;37:D755–D761. doi: 10.1093/nar/gkn875. [DOI] [PMC free article] [PubMed] [Google Scholar]
- Langmead B, Trapnell C, Pop M, Salzberg SL. Ultrafast and memory-efficient alignment of short DNA sequences to the human genome. Genome Biol. 2009;10:R25. doi: 10.1186/gb-2009-10-3-r25. [DOI] [PMC free article] [PubMed] [Google Scholar]
- Lee JY, Yeh I, Park JY, Tian B. PolyA_DB 2: mRNA polyadenylation sites in vertebrate genes. Nucleic Acids Res. 2007;35:D165–D168. doi: 10.1093/nar/gkl870. [DOI] [PMC free article] [PubMed] [Google Scholar]
- Lewis BP, Shih IH, Jones-Rhoades MW, Bartel DP, Burge CB. Prediction of mammalian microRNA targets. Cell. 2003;115:787–798. doi: 10.1016/s0092-8674(03)01018-3. [DOI] [PubMed] [Google Scholar]
- Lutz CS. Alternative polyadenylation: a twist on mRNA 3′ end formation. ACS Chem Biol. 2008;3:609–617. doi: 10.1021/cb800138w. [DOI] [PubMed] [Google Scholar]
- MacDonald CC, McMahon KW. Tissue-specific mechanisms of alternative polyadenylation: testis, brain, and beyond. Wiley Interdiscip Rev RNA. 2010;1:494–501. doi: 10.1002/wrna.29. [DOI] [PMC free article] [PubMed] [Google Scholar]
- MacIsaac JL, Bogutz AB, Morrissy AS, Lefebvre L. Tissue-specific alternative polyadenylation at the imprinted gene Mest regulates allelic usage at Copg2. Nucleic Acids Res. 2012;40:1523–1535. doi: 10.1093/nar/gkr871. [DOI] [PMC free article] [PubMed] [Google Scholar]
- Mahmud MP, Schliep A. Fast MCMC sampling for hidden Markov Models to determine copy number variations. BMC Bioinformatics. 2011;12:428. doi: 10.1186/1471-2105-12-428. [DOI] [PMC free article] [PubMed] [Google Scholar]
- Mayr C, Bartel DP. Widespread shortening of 3′ UTRs by alternative cleavage and polyadenylation activates oncogenes in cancer cells. Cell. 2009;138:673–684. doi: 10.1016/j.cell.2009.06.016. [DOI] [PMC free article] [PubMed] [Google Scholar]
- Mercer TR, et al. Expression of distinct RNAs from 3′ untranslated regions. Nucleic Acids Res. 2012;39:2393–2403. doi: 10.1093/nar/gkq1158. [DOI] [PMC free article] [PubMed] [Google Scholar]
- Metzker ML. Sequencing technologies – the next generation. Nat Rev Genet. 2010;11:31–46. doi: 10.1038/nrg2626. [DOI] [PubMed] [Google Scholar]
- Morgan M, Pagès H. Rsamtools: Import aligned BAM file format sequences into R/Bioconductor. http://bioconductor.org/packages/release/bioc/html/Rsamtools.html.
- Neilson JR, Sandberg R. Heterogeneity in mammalian RNA 3′ end formation. Exp Cell Res. 2010;316:1357–1364. doi: 10.1016/j.yexcr.2010.02.040. [DOI] [PMC free article] [PubMed] [Google Scholar]
- Pruitt KD, Tatusova T, Maglott DR. NCBI reference sequences (RefSeq): acurated non-redundant sequence database of genomes, transcripts and proteins. Nucleic Acids Res. 2007;35:D61–D65. doi: 10.1093/nar/gkl842. [DOI] [PMC free article] [PubMed] [Google Scholar]
- R Development core team. R: A Language and Environment for Statistical Computing. R Foundation for Statistical Computing. 2012 http://www.R-project.org.
- Ramskold D, Wang ET, Burge CB, Sandberg R. An abundance of ubiquitously expressed genes revealed by tissue transcriptome sequence data. PLoS Comput Biol. 2009;5:e1000598. doi: 10.1371/journal.pcbi.1000598. [DOI] [PMC free article] [PubMed] [Google Scholar]
- Sandberg R, Neilson JR, Sarma A, Sharp PA, Burge CB. Proliferating cells express mRNAs with shortened 3′ untranslated regions and fewer microRNA target sites. Science. 2008;320:1643–1647. doi: 10.1126/science.1155390. [DOI] [PMC free article] [PubMed] [Google Scholar]
- Sayers EW, et al. Database resources of the National Center for Biotechnology information. Nucleic Acids Res. 2012;40:D13–D25. doi: 10.1093/nar/gkr1184. [DOI] [PMC free article] [PubMed] [Google Scholar]
- Shepard PJ, Choi EA, Lu J, Flanagan LA, Hertel KJ, Shi Y. Complex and dynamic landscape of RNA polyadenylation revealed by PAS-Seq. RNA. 2011;17:761–772. doi: 10.1261/rna.2581711. [DOI] [PMC free article] [PubMed] [Google Scholar]
- Smibert P, et al. Global patterns of tissue-specific alternative polyadenylation in Drosophila. Cell Rep. 2012;1:277–289. doi: 10.1016/j.celrep.2012.01.001. [DOI] [PMC free article] [PubMed] [Google Scholar]
- Storey JD. A direct approach to false discovery rates. J R Stat Soc B Stat Methodol. 2002;64:479–498. [Google Scholar]
- Storey JD. The positive false discovery rate: A Bayesian interpretation and the q-value. Ann Stat. 2003;31:2013–2035. [Google Scholar]
- Thierry-Mieg D, Thierry-Mieg J. AceView: a comprehensive cDNA-supported gene and transcripts annotation. Genome Biol. 2006;7(Suppl 1):S12.1–S12.14. doi: 10.1186/gb-2006-7-s1-s12. [DOI] [PMC free article] [PubMed] [Google Scholar]
- Tian B, Hu J, Zhang H, Lutz CS. A large-scale analysis of mRNA polyadenylation of human and mouse genes. Nucleic Acids Res. 2005;33:201–212. doi: 10.1093/nar/gki158. [DOI] [PMC free article] [PubMed] [Google Scholar]
- Trapnell C, Pachter L, Salzberg SL. TopHat: discovering splice junctions with RNA-Seq. Bioinformatics. 2009;25:1105–1111. doi: 10.1093/bioinformatics/btp120. [DOI] [PMC free article] [PubMed] [Google Scholar]
- Trapnell C, et al. Transcript assembly and quantification by RNA-Seq reveals unannotated transcripts and isoform switching during cell differentiation. Nat Biotechnol. 2010;28:511–515. doi: 10.1038/nbt.1621. [DOI] [PMC free article] [PubMed] [Google Scholar]
- von Roretz C, Gallouzi IE. Decoding ARE-mediated decay: is microRNA part of the equation? J Cell Biol. 2008;181:189–194. doi: 10.1083/jcb.200712054. [DOI] [PMC free article] [PubMed] [Google Scholar]
- Wang Z, Gerstein M, Snyder M. RNA-Seq: a revolutionary tool for transcriptomics. Nat Rev Genet. 2009;10:57–63. doi: 10.1038/nrg2484. [DOI] [PMC free article] [PubMed] [Google Scholar]
- Winter J, Kunath M, Roepcke S, Krause S, Schneider R, Schweiger S. Alternative polyadenylation signals and promoters act in concert to control tissue-specific expression of the Opitz Syndrome gene MID1. BMC Mol Biol. 2007;8:105. doi: 10.1186/1471-2199-8-105. [DOI] [PMC free article] [PubMed] [Google Scholar]
- Zhang H, Lee JY, Tian B. Biased alternative polyadenylation in human tissues. Genome Biol. 2005;6:R100. doi: 10.1186/gb-2005-6-12-r100. [DOI] [PMC free article] [PubMed] [Google Scholar]
Associated Data
This section collects any data citations, data availability statements, or supplementary materials included in this article.