

Summary
Fusarium head blight, caused by Fusarium graminearum, is a devastating disease of wheat. We developed near‐isogenic lines (NILs) differing in the two strongest known F. graminearum resistance quantitative trait loci (QTLs), Qfhs.ndsu‐3BS (also known as resistance gene Fhb1) and Qfhs.ifa‐5A, which are located on the short arm of chromosome 3B and on chromosome 5A, respectively. These NILs showing different levels of resistance were used to identify transcripts that are changed significantly in a QTL‐specific manner in response to the pathogen and between mock‐inoculated samples. After inoculation with F. graminearum spores, 16 transcripts showed a significantly different response for Fhb1 and 352 for Qfhs.ifa‐5A. Notably, we identified a lipid transfer protein which is constitutively at least 50‐fold more abundant in plants carrying the resistant allele of Qfhs.ifa‐5A. In addition to this candidate gene associated with Qfhs.ifa‐5A, we identified a uridine diphosphate (UDP)‐glycosyltransferase gene, designated TaUGT12887, exhibiting a positive difference in response to the pathogen in lines harbouring both QTLs relative to lines carrying only the Qfhs.ifa‐5A resistance allele, suggesting Fhb1 dependence of this transcript. Yet, this dependence was observed only in the NIL with already higher basal resistance. The complete cDNA of TaUGT12887 was reconstituted from available wheat genomic sequences, and a synthetic recoded gene was expressed in a toxin‐sensitive strain of Saccharomyces cerevisiae. This gene conferred deoxynivalenol resistance, albeit much weaker than that observed with the previously characterized barley HvUGT13248.
Introduction
The plant‐pathogenic fungus Fusarium graminearum frequently infects small grain cereals, particularly wheat (Leonard and Bushnell, 2003). Fusarium head blight (FHB) is one of the most important field crop diseases in temperate regions, resulting in severe yield losses and reduced grain quality by contamination with the trichothecene deoxynivalenol (DON; Desjardins, 2006). This mycotoxin is a serious threat to human and animal health (Pestka, 2010). Maximum tolerated levels in food have been enacted in the European Union (The European Commission, 2006), and advisory levels have been issued by the Food and Drug Administration in the USA. As the control of FHB by crop rotation, tillage regimes or the use of fungicides is only partially successful, an understanding of the genetic control of FHB resistance and the deployment of resistance genes in wheat varieties are likely to be the most promising strategies.
Genetic mapping of FHB resistance in wheat has led to the identification of several quantitative trait loci (QTLs) that confer partial resistance (Buerstmayr et al., 2009). The two most effective QTLs exhibiting FHB resistance were identified in the Chinese Spring wheat cultivar Sumai3 and derivatives, and are positioned on the short arm of chromosome 3B (Fhb1) and on chromosome 5A (Qfhs.ifa‐5A) (Anderson et al., 2001; Buerstmayr et al., 2002, 2003). Molecular markers have been developed for the accurate screening of Fhb1 (Liu et al., 2008) and Qfhs.ifa‐5A (Buerstmayr et al., 2002) resistance alleles. Fhb1 and Qfhs.ifa‐5A employ different mechanisms. Fhb1 confers so‐called type II resistance by slowing down or inhibiting the spread of the pathogen from the initial infection site, whereas Qfhs.ifa‐5A contributes to type I resistance by lowering the rate of initial infection and also confers type II resistance – albeit to a lesser extent.
The genetic determinants underlying Fhb1 and Qfhs.ifa‐5A are still unknown. Despite significant efforts, the Fhb1 gene has not yet been isolated (Liu et al., 2006, 2008). In addition, the release of parts of the wheat chromosome 3BS sequence of the FHB‐susceptible cultivar Chinese Spring, which should cover the Fhb1 locus, has not led to new insights into the genetic determinants of Fhb1 (Choulet et al., 2010).
Previous work has indicated that Fhb1 plays a role in resistance against DON, a major virulence factor for F. graminearum. Lemmens et al. (2005) have shown that lines carrying the Fhb1 resistant allele exhibit increased ability to conjugate DON into DON‐3‐glucoside (D3G). A highly DON‐inducible barley uridine diphosphate‐glycosyltransferase (UGT), capable of inactivating DON by transforming it to D3G, has been identified (Gardiner et al., 2010; Schweiger et al., 2010), and transgenic Arabidopsis carrying the barley UGT exhibits high DON resistance (Shin et al., 2012).
In contrast, a recent report has suggested that high levels of phenylpropanoids observed in F. graminearum‐inoculated spikelets are responsible for the resistance conferred by Fhb1, which may be related to the also observed higher abundance of the biotic stress hormone jasmonic acid (JA; Gunnaiah et al., 2012). In addition, Xiao et al. (2013) have identified JA signalling, but not biosynthesis, as specific for Fhb1‐related resistance. Yet, this is difficult to reconcile with the results of studies using pure toxin (Horevaj et al., 2012; Lemmens et al., 2005). Possibly, in heavily inoculated spikelets, resistance is quickly overcome before the induction and function of UGT. Thus, induced UGT activity may be required for the inactivation of DON diffusion ahead of hyphae into the surrounding tissue. Alternatively, Zhuang et al. (2013) have associated the downregulation of a pectin methyl esterase inhibitor gene in strains lacking Fhb1 with the QTL. Overexpression in durum wheat of such a gene from Actinidia chinensis led to a reduction in FHB symptoms (Volpi et al., 2011). In addition, pathogenesis‐related proteins and an ABC transporter have been found to be more abundant for the QTL (Gunnaiah et al., 2012), and an Rpg1 kinase homologue was mapped to the locus (Shen et al., 2006).
This report investigates transcriptional differences of near‐isogenic lines (NILs) segregating for Fhb1, and is the first to investigate Qfhs.ifa‐5A. We report a candidate gene – a lipid transfer protein (LTP) constitutively more abundant for the resistant Qfhs.ifa‐5A allele. A UGT gene more responsive in the Fhb1 background – if Qfhs.ifa‐5A is also present – was identified and functionally tested by heterologous expression in yeast.
Results
Resistance QTLs in a near‐isogenic background confer different resistance levels
In an effort to identify genetic determinants underlying two validated FHB resistance QTLs in wheat, Fhb1 and Qfhs.ifa‐5A, we generated NILs from a cross of the susceptible spring wheat cv. Remus and the FHB resistant line CM‐82036, carrying the Fhb1 and Qfhs.ifa‐5A QTLs. Four NILs from a BC5F2 population were selected for the presence of the resistant alleles at both QTLs (NIL1), harbouring only the Fhb1 (NIL2) or only the Qfhs.ifa.5A (NIL3) resistance allele, or carrying the susceptible alleles at both QTLs (NIL4) (Fig. 1A). Diversity Arrays Technology (DArT) marker analysis showed that the percentage of Remus alleles varied between 96.3% (NIL1) and 99.8% (NIL4).
Figure 1.
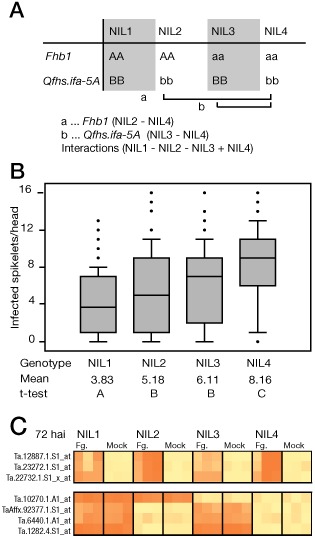
Characterization of near‐isogenic lines (NILs) generated in this study. (A) Each NIL harbours a different composition of resistant (AA, BB) or susceptible (aa, bb) alleles of Fhb1 and Qfhs.ifa‐5A. The Fusarium graminearum‐specific responses for Fhb1 and Qfhs.ifa‐5A were calculated by comparing the F. graminearum/mock contrasts of the indicated lines. Differences in constitutive gene expression were calculated by comparing mock‐inoculated samples of the same lines. The ‘interaction’ contrast indicates nonadditive effects between Fhb1 and Qfhs.ifa‐5A in NIL1 harbouring both resistance alleles. (B) Comparison of disease progression observed 18 days after inoculation in each of the NILs. (C) Heat map showing differential accumulation of exemplary transcripts between NILs at 72 h after inoculation (hai). The top panel represents Fusarium‐responsive transcripts: Ta.12887.1.S1_at, Ta.23272.1.S1_at and Ta.22732.1.S1_at (all significantly changed for Qfhs.ifa‐5A). The bottom panel represents transcripts with constitutive differences in abundance: TaAffx.92377.1.S1_at, Ta.6440.1.A1_at, Ta.1282.4.S1_at (all Qfhs.ifa‐5A) and Ta.10270.1.A1_at (Fhb1).
To phenotypically assess the resistance levels, 150 heads per genotype were used to estimate disease progression, 12, 18 and 24 days after point inoculation of single spikelets with F. graminearum spores. NIL4 developed a similar phenotype to the susceptible cv. Remus, and NIL1 exhibited the highest level of resistance among NILs, but did not perform as well as the parent CM‐82036, which developed, on average, only one diseased spikelet (not shown). Intermediate resistance levels were observed in NIL2 (Fhb1) and NIL3 (Qfhs.ifa‐5A) (t‐test, P ≤ 0.05; Fig. 1B). At maturity, kernels of whole wheat ears were investigated for DON and D3G content, which confirmed the phenotyping results. The more resistant line NIL1 exhibited the lowest DON content (on average 9.45 mg/kg) and the highest D3G/DON ratio (17%); NIL2 and NIL3 contained, on average, 20.25 mg/kg and 18.52 mg/kg DON, respectively, and ratios of 12% and 14% D3G/DON. The susceptible NIL4 showed the highest DON content (41.35 mg/kg) and the lowest D3G/DON ratio (8%).
However, inoculated samples from the time points used for the transcriptome analysis [72 h after inoculation (hai) and earlier] contained only trace amounts of DON.
Transcriptional characterization of the wheat response to F. graminearum
We assessed QTL‐specific differential transcript abundance between the four NILs related to treatment (F. graminearum vs. mock) and time point (8, 24 and 72 hai) in three individual replicates using the Affymetrix 61 K wheat GeneChip. Several examples are shown in Fig. 1C. In total, we identified 806 transcripts responding to F. graminearum infection in at least one time point when calculating the average (i.e. genotype‐independent) differences in transcript abundance between F. graminearum‐ and mock‐inoculated samples (adjusted P ≤ 0.05). The vast majority of these transcripts (792) were detected at 72 hai, less at 24 hai (62) and a few at 8 hai (29). The Fhb1‐ and Qfhs.ifa‐5A‐specific responses were generated by subtracting the F. graminearum/mock contrast of NIL4 (susceptible QTL alleles) from either NIL2 (resistant Fhb1 allele) or NIL3 (resistant Qfhs.ifa‐5A allele) (Fig. 1A). The majority of transcripts identified with these contrasts showed a negative difference in response to F. graminearum, indicating a higher transcript accumulation in the presence of the susceptible QTL alleles (Table S1, see Supporting Information). We confirmed the observed differences by reverse transcription‐quantitative polymerase chain reaction (RT‐qPCR) for a representative group of probe sets showing the highest relative changes. The investigated transcripts comprise F. graminearum‐induced and QTL‐specific genes (Fig. S1A, see Supporting Information), and genes which are constitutively changed between mock‐treated lines for one of the QTLs (Fig. S1B). Potentially, observed transcript levels can be confounded by single‐feature polymorphisms (SFPs) that lead to different binding affinities to the probe sets. However, such SFPs were detected for only a few transcripts. Transcripts were functionally annotated and compared against available databases, and with annotations reported previously by Jia et al. (2009). For ease of comparison with Jia et al. (2009), we classified the annotated genes by their putative roles as related to defence. In total, we identified 207 genes with a proposed role in defence and 264 involved in other categories (Table S2, see Supporting Information).
Broad and late defence mechanisms are mounted in the absence of the Qfhs.ifa‐5A QTL
The contrast to detect Qfhs.ifa‐5A gene‐specific expression was calculated by subtracting the F. graminearum/mock contrast of NIL4 from the F. graminearum/mock contrast of NIL3 with the resistant Qfhs.ifa‐5A allele, and detected 352 transcripts as differently regulated. Of these, 339 were detected at 72 hai and, with one exception (Ta.9975.2.S1_at, unknown), all showed a negative difference in response, indicating a higher induction or more sustained expression in the more susceptible genotype lacking Qfhs‐ifa.5A resistance. These 338 genes (Table S3, see Supporting Information) encode a variety of defence‐related proteins.
Twenty‐one probe sets correspond to genes involved in the phenylpropanoid pathway, including multiple transcripts encoding phenylalanine ammonia lyases (PALs), the first dedicated step in the pathway. Only two more genes in this pathway that were not Qfhs.ifa‐5A specific were identified when calculating the average differences in transcript abundance between F. graminearum‐ and mock‐inoculated samples across all lines. Most of the identified transcripts involved in the production of ethylene (ET) and JA showed higher accumulation for the susceptible Qfhs.ifa‐5A allele (one and nine transcripts, respectively). Similarly, F. graminearum‐responsive transcripts potentially involved in DON detoxification were found to be predominantly more abundant in lines harbouring the susceptible Qfhs.ifa‐5A allele. These transcripts correspond to 12 UGTs (from a total of 14 UGTs detected), three MATE‐type transporter genes (three) and nine pleiotropic drug resistance transporter genes (18).
In contrast, transcripts corresponding to pathogenesis‐related proteins were, in most cases, detected as a general response to the pathogen and not by the Qfhs.ifa‐5A‐specific contrast. These included the subclasses of chitinases, glucanases, thaumatin and thaumatin‐like proteins, as well as LTPs, which are involved in the early interaction with the pathogen (Walter et al., 2010). However, the expression of germin‐like proteins and protease inhibitors was almost exclusively detected in the more vulnerable line carrying the susceptible Qfhs.ifa‐5A allele (see also Table S2).
At time points other than 72 hai, five probe sets with a positive difference in response to F. graminearum were identified for Qfhs.ifa‐5A (8 hai), indicating higher accumulation for the resistant allele. These encoded a stress‐responsive A/B barrel domain‐containing protein, a calmodulin‐related calcium sensor protein, a glutathione‐S‐transferase (GST), a nonsymbiotic haemoglobin and one unknown protein. Notably, two of these genes also exhibited a negative difference at 72 hai, with higher accumulation in the genotype with the susceptible Qfhs.ifa‐5A allele (Ta.5610.1.S1_at, nonsymbiotic haemoglobin 2 and TaAffx.112045.1.S1_x_at, GST). Fusarium graminearum‐responsive transcripts exhibiting a significant difference in response for Qfhs.ifa‐5A are summarized in Table 1.
Table 1.
Transcripts exhibiting a differential response for Qfhs.ifa‐5A a (adjusted P ≤ 0.05, ≥2 fold change, FC) after inoculation with Fusarium graminearum spores
| Affymetrix ID | Annotationb | Classification | FC, 8 haic | FC, 24 hai | FC, 72 hai | Significant in other contrastsd | Mapped toe |
|---|---|---|---|---|---|---|---|
| Ta.9975.2.S1_at | Unknown | Unknown | 1.51 | 0.95 | 6.28 | ||
| Ta.14573.1.S1_at | Hsp20/α‐crystallin family protein (Oryza sativa) | Defence | 0.23 | 0.80 | 1.68 | ||
| Ta.13859.1.A1_at | OsCML16; calmodulin‐related calcium sensor protein (Oryza sativa) | Regulatory | 2.94 | 0.64 | 1.30 | −Fhb1 (24 hai) | |
| Ta.16827.1.S1_s_at | Unknown | Unknown | 0.75 | 0.35 | 1.25 | ||
| Ta.10311.1.S1_at | Stress‐responsive A/B barrel domain‐containing protein (Oryza sativa) | Unknown | 2.65 | 1.01 | 1.16 | ||
| Ta.13426.1.S1_s_at | Os04g0119500 protein (Oryza sativa) (UniRef90_Q7XTJ2) | Unknown | 3.14 | 0.89 | 1.09 | ||
| TaAffx.64985.1.S1_at | Putative uncharacterized protein (Zea mays) (UniRef90_B4FQP2) | Regulatory | 0.17 | 2.02 | 1.00 | ||
| Ta.9389.1.S1_at | Seed maturation protein PM41 (Oryza sativa) | Development | 2.20 | 0.31 | 0.98 | ||
| Ta.20205.1.A1_s_at | VER2 (Triticum aestivum) (UniRef90_O80370) | Development | 1.14 | 0.48 | 0.95 | ||
| Ta.24801.1.S1_at | Hsp20/α‐crystallin family protein (Oryza sativa) | Defence | 0.25 | 0.95 | 0.90 | ||
| Ta.5004.1.S1_at | Thiol protease SEN102 precursor (Oryza sativa) | Metabolism | 0.26 | 1.70 | 0.89 | −Fhb1 (8 hai) | |
| Ta.5004.3.S1_a_at | Thiol protease SEN102 precursor (Oryza sativa) | Metabolism | 0.47 | 1.19 | 0.88 | −Fhb1 (8 hai) | |
| TaAffx.112045.1.S1_x_at | Glutathione‐S‐transferase (Oryza sativa) | Defence | 3.20 | 1.23 | 0.03 | +Fhb1 (8 hai) | |
| Ta.5610.1.S1_at | Nonsymbiotic haemoglobin 2 (Oryza sativa) | Miscellaneous | 7.01 | 0.40 | 0.02 | 4BL, 4DL |
The expression ratio was calculated from the F. graminearum/mock response observed in NIL3 (resistant Qfhs.ifa‐5A allele) and the response provided by NIL4 (susceptible allele). Genes more abundant in the absence of Qfhs.ifa‐5A at 72 hai are excluded here and provided in Table S3 (see Supporting Information).
Annotations were assigned if the E value from the BlastX results was ≤10−10; otherwise the transcripts were denominated as ‘unknown’.
Differences in response are the means of three biological replicates. Statistically significant values are given in bold type.
−/+ indicates significant positive/negative differences in response for the indicated contrast.
Map locations were identified by searching the mapped expressed sequence tag (EST) database of Graingenes for the probe set sequences using BlastN and an E cut‐off of ≤10−10.
An LTP is constitutively more abundant in the presence of Qfhs.ifa‐5A
Twenty‐eight genes were constitutively more and 63 less abundant in the presence of the resistant allele when comparing mock‐inoculated samples of NIL3 and NIL4 differing in Qfhs.ifa‐5A (Table S4, see Supporting Information, and Table 2, which summarizes the group of more abundant transcripts). Of these, 16 probe sets corresponded to defence‐related genes, including three heat shock proteins more abundant only at 8 hai (two isogenes) or 72 hai (one isogene). The largest difference in transcript abundance was observed for Ta.1282.4.S1_at, which corresponds to an LTP. The probe set derives from an expressed sequence tag (EST) (GenBank accession CA635994), which is identical to the gene model of TaLTP9.4a (GenBank accession AJ852541, cv. Apache; Boutrot et al., 2007). We used specific primers for the 5′ untranslated region (UTR) published for TaLTP9.4a to map Ta.1282.4.S1_at to the long arm of chromosome 5A using a collection of Chinese Spring nulli‐tetra lines. Deletion bin mapping of this gene using four Chinese Spring deletion lines for 5AS and five deletion lines for 5AL produced the specific PCR fragment for all lines investigated, suggesting that this gene is located on the pericentromeric region of 5AL. The gene model of this LTP contains one 440‐bp intron, which separates the 369‐bp coding sequence (CDS) into two exons of 360 and 9 bp. Resequencing of cloned PCR products from both the resistant CM‐82036 and the susceptible Remus identified two highly similar LTP genes, which exist in both genotypes. These genes, potentially paralogues positioned on the same locus, differ in two and six single‐nucleotide polymorphisms (SNPs), respectively, from the EST template (Fig. S2, see Supporting Information).
Table 2.
Transcripts constitutively more abundant (adjusted P ≤ 0.05, ≥2 fold change, FC) in the presence of the resistance alleles of either Fhb1 or Qfhs.ifa‐5A a
| Affymetrix ID | Annotationb | Classification | FC, 8 haic | FC, 24 hai | FC, 72 hai | SFPd | Mapped toe |
|---|---|---|---|---|---|---|---|
| Constitutively changed for Fhb1 | |||||||
| Ta.28411.1.A1_at | OsCML16; calmodulin‐related calcium sensor protein (Oryza sativa) | Regulatory | 33.53 | 95.9 | 53.74 | 11 | |
| Ta.22694.1.A1_at | Unknown | Unknown | 30.91 | 21.96 | 36.91 | 5 | |
| Ta.13161.1.S1_at | Putative extensin‐like cell wall protein (Jia et al., 2009) | Cell wall | 21.24 | 23.13 | 36.24 | 8, 9 | |
| Ta.10270.2.A1_a_at | Wax synthase (Oryza sativa) | Metabolism | 5.62 | 6.42 | 6.1 | ||
| Ta.10270.1.A1_at | Putative uncharacterized protein Sb02g001860 (Sorghum bicolor) (UniRef90_C5X8N1) | Unknown | 5.15 | 5.18 | 4.94 | ||
| TaAffx.654.1.S1_at | Unknown | Unknown | 2.89 | 2.65 | 2.99 | 5DL | |
| TaAffx.12498.2.S1_at | Unknown | Unknown | 2.54 | 2.41 | 2.84 | ||
| Ta.5633.1.S1_a_at | Unknown | Unknown | 1.02 | 3.76 | 2.7 | ||
| Ta.25791.1.A1_at | Unknown | Unknown | 3.15 | 4.83 | 2.55 | 10 | |
| TaAffx.130179.1.A1_at | Putative uncharacterized protein (Oryza sativa Indica Group) (UniRef90_A2YVE1) | Unknown | 1.86 | 2.29 | 2.55 | ||
| TaAffx.86734.1.S1_at | Unknown | Unknown | 2.14 | 2.11 | 2.06 | ||
| TaAffx.12498.1.S1_s_at | Unknown | Unknown | 2.13 | 1.99 | 1.89 | ||
| Ta.13263.2.A1_a_at | Unknown | Unknown | 1.39 | 2.25 | 1.39 | ||
| Ta.9389.1.S1_x_at | Seed maturation protein PM41 (Oryza sativa) | Development | 0.33 | 2.67 | 1.2 | ||
| TaAffx.616.2.S1_s_at | Hypothetical protein (Jia et al., 2009) | Unknown | 0.58 | 2.83 | 1.12 | ||
| Ta.28659.3.S1_x_at | Subtilisin–chymotrypsin inhibitor 2 (Jia et al., 2009) | Defence | 0.44 | 3.54 | 1.05 | ||
| Ta.9389.1.S1_at | Seed maturation protein PM41 (Oryza sativa) | Development | 0.3 | 2.44 | 1.04 | ||
| Constitutively changed for Qfhs.ifa‐5A | |||||||
| Ta.1282.4.S1_at | Nonspecific lipid transfer protein (Triticeae) (UniRef90_Q42848) | Defence | 51.75 | 70.04 | 65.85 | 4, 6 | |
| Ta.6440.1.A1_at | Os09g0436400 protein (Oryza sativa Japonica Group) (UniRef90_Q0J1J3) | Unknown | 34.52 | 29.3 | 41.21 | 8 | |
| Ta.27806.1.A1_at | Unknown | Unknown | 5 | 13 | 21 | ||
| TaAffx.68700.1.S1_at | Expressed protein (Oryza sativa) | Unknown | 9.92 | 19.24 | 17.4 | ||
| TaAffx.36760.1.S1_at | RCN1 Centroradialis‐like1 homologous to TFL1 gene; contains Pfam profile PF01161: phosphatidylethanolamine‐binding (Oryza sativa) | Regulatory | 3.2 | 6.31 | 7.26 | 2AL, 2DL, 4AL | |
| Ta.11043.1.A1_at | Unknown | Unknown | 5.28 | 6.67 | 5.8 | ||
| TaAffx.70660.1.S1_at | Hsp20/α‐crystallin family protein (Oryza sativa) | Defence | 1.5 | 1.03 | 4.77 | ||
| TaAffx.92377.1.S1_at | Predicted protein (Populus trichocarpa) (UniRef90_B9GJ95) | Regulatory | 3.74 | 4.23 | 4.41 | ||
| TaAffx.9181.1.S1_at | Unknown | Unknown | 3.61 | 3.13 | 4.19 | 7 | |
| Ta.5776.1.S1_at | Unknown | Unknown | 0.96 | 1.03 | 3.81 | ||
| Ta.25955.1.A1_at | Unknown | Unknown | 2.7 | 1.93 | 2.82 | ||
| Ta.23102.1.S1_at | HEAT repeat family protein (Oryza sativa) | Miscellaneous | 5.4 | 2.37 | 2.64 | 2DS, 5AS, 5BS, 5DS | |
| TaAffx.23477.1.S1_at | Unknown | Unknown | 2.53 | 2.62 | 2.53 | ||
| Ta.6352.3.A1_a_at | XH domain‐containing protein (Oryza sativa) | Regulatory | 2.42 | 2.7 | 2.51 | ||
| TaAffx.86453.1.S1_s_at | Unknown | Unknown | 1.92 | 2.89 | 2.24 | ||
| Ta.5597.1.S1_at | Auxin‐repressed protein (Oryza sativa) | Unknown | 1.62 | 1.72 | 2.15 | 7 | 4DL, 6BS |
| Ta.12038.1.A1_at | MDR‐like ABC transporter (Oryza sativa) | Putative trichothecene detoxification and transport | 1.86 | 2.13 | 2.06 | ||
| Ta.5281.1.S1_at | Hydrolase, α/β fold family domain‐containing protein (Oryza sativa) | Metabolism | 3.42 | 3.91 | 1.85 | ||
| Ta.4381.2.S1_a_at | Unknown | Unknown | 2.5 | 2.13 | 1.74 | 7AS | |
| Ta.29578.2.S1_at | Nonsymbiotic haemoglobin 2 (Oryza sativa) | Miscellaneous | 0.84 | 2.06 | 1.7 | ||
| Ta.867.1.A1_at | Nucleotide pyrophosphatase/phosphodiesterase (Andropogoneae) (UniRef90_B6U857) | Metabolism | 2.39 | 2.41 | 1.68 | ||
| Ta.13156.1.S1_at | Unknown | Unknown | 2.13 | 1.96 | 1.64 | ||
| Ta.8274.1.A1_at | Unknown | Unknown | 2.37 | 2.26 | 1.56 | ||
| Ta.540.1.S1_at | Unknown | Unknown | 2.02 | 1.34 | 1.53 | 1AL, 3AS | |
| Ta.19896.1.A1_at | Os09g0425200 protein (Oryza sativa) (UniRef90_Q69PC6) | Unknown | 2.24 | 1.48 | 1.36 | ||
| Ta.24801.1.S1_at | Hsp20/α‐crystallin family protein (Oryza sativa) | Defence | 4.55 | 1.03 | 1.36 | ||
| Ta.11111.1.A1_at | RCN4 Centroradialis‐like1 homologous to TFL1 gene (Oryza sativa) | Development | 2.92 | 1.81 | 1 | ||
| Ta.14573.1.S1_at | Hsp20/α‐crystallin family protein (Oryza sativa) | Defence | 4.77 | 1.29 | 0.86 | ||
The expression ratios were calculated by comparing mock‐treated samples of NIL2 (resistant Fhb1 allele) or NIL3 (resistant Qfhs.ifa‐5A allele) with NIL4 (susceptible alleles).
Annotations were assigned if E from the BlastX results was ≤10−10; otherwise, the transcripts were denominated as ‘unknown’.
Differences in transcript abundance are the means of three biological replicates. Statistically significant values are given in bold type.
Numbers in the single‐feature polymorphism (SFP) column indicate for which probes SFPs were detected.
Map locations were identified by searching the mapped expressed sequence tag (EST) database of Graingenes for the probe set sequences using BlastN and a E ≤ 10−10.
Fusarium graminearum‐responsive Fhb1‐specific transcripts
The F. graminearum‐specific and Fhb1‐dependent response was generated by subtracting the F. graminearum/mock contrast of NIL4 (both susceptible QTL alleles) from the F. graminearum/mock contrast derived from NIL2 (resistant Fhb1 allele). We identified 16 transcripts exhibiting a differential response for Fhb1 (Table 3). At 8 hai, only one transcript exhibited a positive difference in response (TaAffx.112045.1.S1_x_at; GST), and two probe sets had a negative difference in response (Ta.5004.1.S1_at; Ta.5004.1.S1_x_at; thiol protease precursors). With one exception (Ta.14071.1.S1_x_at; integral membrane protein), all of the transcripts identified at 72 hai (12) and 24 hai (two) showed a negative difference in response, indicating less accumulation in the line carrying the resistant Fhb1 allele compared with the line carrying the susceptible allele.
Table 3.
Transcripts exhibiting a differential response for Fhb1 a (adjusted P ≤ 0.05, ≥2 fold change, FC) after inoculation with Fusarium graminearum spores
| Affymetrix ID | Annotationb | Classification | FC, 8 haic | FC, 24 hai | FC, 72 hai | Significant in other contrastsd | Mapped toe |
|---|---|---|---|---|---|---|---|
| Ta.14071.1.S1_x_at | Integral membrane protein DUF6‐containing protein, expressed (Oryza sativa) | Metabolism | 1.37 | 1.24 | 3.17 | ||
| Ta.13859.1.A1_at | OsCML16; calmodulin‐related calcium sensor protein (Oryza sativa) | Regulatory | 1.12 | 0.20 | 1.28 | −Qfhs.ifa‐5A (8 hai) | |
| TaAffx.616.2.S1_s_at | Hypothetical protein (Jia et al., 2009) | Unknown | 1.49 | 0.27 | 1.16 | ||
| TaAffx.112045.1.S1_x_at | Glutathione‐S‐transferase (Oryza sativa) | Defence | 3.26 | 1.58 | 1.11 | + Qfhs.ifa‐5A (8 hai) −Qfhs.ifa‐5A (72 hai) | |
| Ta.5004.1.S1_at | Thiol protease SEN102 precursor (Oryza sativa) | Metabolism | 0.29 | 1.52 | 0.83 | −Qfhs.ifa‐5A (8 hai) | |
| Ta.5004.3.S1_a_at | Thiol protease SEN102 precursor (Oryza sativa) | Metabolism | 0.41 | 1.24 | 0.79 | −Qfhs.ifa‐5A (8 hai) | |
| TaAffx.106424.1.S1_at | Acid phosphatase‐like (Jia et al., 2009) | Metabolism | 0.94 | 1.13 | 0.49 | −Qfhs.ifa‐5A (8 hai) | |
| Ta.8866.1.S1_at | Protease inhibitor‐like protein (Jia et al., 2009) | Defence | 1.03 | 0.95 | 0.44 | −Qfhs.ifa‐5A (8 hai) | |
| Ta.25754.1.A1_at | Glutathione‐S‐transferase (Oryza sativa) | Defence | 0.99 | 0.96 | 0.39 | −Qfhs.ifa‐5A (8 hai) | |
| Ta.1811.1.S1_at | cis‐Zeatin O‐glucosyltransferase (Oryza sativa) | Putative trichothecene detoxification and transport | 0.94 | 0.89 | 0.39 | −Qfhs.ifa‐5A (8 hai) | |
| Ta.10583.1.A1_at | tRNA synthetases class II domain‐containing protein (Oryza sativa) | Metabolism | 0.90 | 1.02 | 0.38 | −Qfhs.ifa‐5A (8 hai) | 1AS, 1BS, 1 DS |
| TaAffx.113333.2.S1_at | Putative uncharacterized protein Sb04g011090 (Sorghum bicolor) (UniRef90_C5Y052) | Metabolism | 0.93 | 1.15 | 0.36 | −Qfhs.ifa‐5A (8 hai) | 1AL, 1BL, 1DL, 5DL |
| Ta.30866.1.S1_at | Expressed protein‐RZ53 family‐2 (Oryza brachyantha) (UniRef90_B9V0I1) | Unknown | 0.94 | 1.04 | 0.36 | −Qfhs.ifa‐5A (8 hai) | |
| Ta.3545.1.S1_at | Unknown | 0.98 | 1.04 | 0.30 | −Qfhs.ifa‐5A (72 hai) | 3AL, 3BL, 3DL | |
| Ta.24732.1.S1_at | Unknown | 1.20 | 1.21 | 0.16 | −Qfhs.ifa‐5A (8 hai) | 1BL, 3BL, 6DL, 7BL | |
| Ta.23324.1.S1_at | Unknown | 0.94 | 1.13 | 0.02 |
The expression ratio was calculated from the F. graminearum/mock response observed in NIL2 (resistant Fhb1 allele) and the response provided by NIL4 (susceptible alleles at Fhb1).
Annotations were assigned if E from the BlastX results was ≤10−10; otherwise, the transcripts were denominated as ‘unknown’.
Differences in response are the means of three biological replicates. Statistically significant values are given in bold type.
‐/+ indicates significant positive/negative differences in response for the indicated contrast.
Map locations were identified by searching the mapped expressed sequence tag (EST) database of Graingenes for the probe set sequences using BlastN and E ≤ 10−10.
Fifty‐four transcripts exhibited constitutive Fhb1‐dependent differences in abundance, when comparing mock‐inoculated samples of NIL2 and NIL4. Most transcripts showed a consistent expression pattern throughout all time points (Table S5, see Supporting Information). Of these 54 transcripts, 17 were constitutively more abundant in the presence of the resistant Fhb1 allele (Table 2). These transcripts encode, for instance, an extensin‐like cell wall protein, a wax synthase, a calmodulin‐related calcium sensor protein, a subtilisin–chymotrypsin inhibitor (only detected for 24 hai), two seed maturation proteins and 11 proteins of unknown function.
To identify Affymetrix probe sets mapping in close vicinity to the physical positions of markers linked to Fhb1, we employed the available partial genomic sequence of chromosome 3B of cv. Chinese Spring (Choulet et al., 2010), which included the region harbouring Fhb1. We located markers sts32, sts66, sts194, sts142, sts80, sts189 and umn10 (Liu et al., 2006, 2008) on ctg0954b of 3BS (GenBank accession FN564434, Fig. 2). The markers span a distance of 2.94 megabases (sts66 to sts189) and the region comprising the putative Fhb1 region spans about 274 kb (sts32 to umn10). From the genes represented on the 61 K wheat GeneChip, we mapped 35 with at least 98% identity to ctg0954b. Four of the 35 mapped transcripts were changed significantly for Fhb1 in our experiments, including TaAffx.12498.2.S1_at and Ta.22694.1.A1_at (constitutively more abundant for the resistant Fhb1 allele, both unknown) and Ta.28185.1.S1_at and Ta.6066.2.S1_a_at (constitutively more abundant for the susceptible allele, splicing factor and unknown, respectively; Fig. 2). The majority of transcripts changed for Fhb1 could not be mapped to the interval. Only eight GeneChip probe sets correspond to the 54 annotated genes on the contig.
Figure 2.
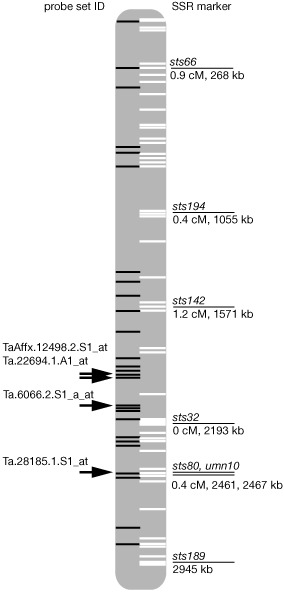
Comparison of transcripts with the physical map of the Fhb1 locus. Simple sequence repeat (SSR) markers mapped to the sequence of the Chinese Spring BAC library contig ctg0954b of chromosome 3BS are given with genetic distances to each other and their physical position. White bars represent positions of annotated genes. Black bars represent mapped expressed sequence tag (EST) sequences corresponding to the Affymetrix wheat GeneChip. Probe set IDs of transcripts differentially changed for Fhb1 are indicated.
Interaction effects between both QTLs identify additional Fhb1‐associated candidates
We also investigated whether the combined QTLs in NIL1 exhibited interaction effects between Fhb1 and Qfhs.ifa‐5A when compared with the transcript accumulation observed for single QTL contrasts. These were calculated by subtracting the F. graminearum/mock contrasts observed in NIL2 (Fhb1) and NIL3 (Qfhs.ifa‐5A) from the contrast observed in NIL1 (both resistant alleles; interactions = NIL1 – NIL2 – NIL3 + NIL4; adjusted P ≤ 0.05). The pathogen‐responsive and constitutively changed transcripts are given in Tables S6 and S7, respectively (see Supporting Information).
Twenty‐three of the F. graminearum‐responsive transcripts that showed interaction effects at 72 hai were similarly abundant at high levels in both lines lacking the 5A resistance (NIL2 and NIL4). Hence, the interaction contrast is generated by the difference between NIL1 and NIL3, indicating potential Fhb1 dependence (for instance, Ta.12887.1.S1_at; Fig. 1C). We tested whether these genes were also changed significantly for Fhb1 in the genetic background with the resistant Qfhs.ifa‐5A allele by calculating the difference in response to F. graminearum between NIL1 and NIL3 (which also includes potential interaction effects; Table S8, see Supporting Information). This contrast identified the same three UGTs, two GSTs, two P450 monooxygenases and a laccase protein, as well as three metabolism‐related proteins and four unknown. The annotated gene with the highest difference in response was TaAffx.111585.1.S1. A similar contrast was also generated for Qfhs.ifa‐5A in the background of Fhb1 (NIL1 – NIL2; Table S9, see Supporting Information), which, however, did not yield additional candidates.
The Fhb1‐associated TaUGT12887 confers weak resistance to DON
BlastN analysis identified TaAffx.111585.1.S1_at as well as Ta.12887.1.S1_at as close homologues to HvUGT13248, a barley gene encoding a UGT with a proven ability to inactivate DON (Schweiger et al., 2010). As resistance conferred by Fhb1 has been shown previously to be correlated with greater ability to glucosylate DON (Lemmens et al., 2005), both probe sets were attractive starting points for further investigations. Reconstruction of the gene models using the publically available genomic 454 sequences (http://www.cerealsdb.uk.net) of cv. Chinese Spring showed that the ESTs corresponding to both probe sets originated from the same gene. The assembled gene model contained two introns, which separated a large first exon (705 bp) and two smaller exons of 385 and 338 bp in length. The encoded open reading frame (ORF) (1428 bp) was designated TaUGT12887 (GenBank accession JX624788). We used a collection of nulli‐tetra and ditelosomic lines to map TaUGT12887 to chromosome 5BL. Resequencing of PCR products from both parental genotypes of the mapping population showed that the coding sequence was identical in Chinese Spring and the two parental lines used in this study, CM‐82036 and Remus.
To test whether TaUGT12887 encodes a protein with the ability to inactivate DON, we recoded the sequence for optimal expression in yeast. The toxin‐sensitive Saccharomyces cerevisiae strain YZGA515 was transformed with a plasmid containing the custom synthesized ORF under the control of the strong constitutive ADH1 promoter. Spotting assays showed that TaUGT12887 conferred only weak resistance against DON compared with the barley DON‐inactivating HvUGT13248 (Fig. 3), although the proteins were highly expressed in cell extracts, as confirmed by immunodetection of the N‐terminal c‐Myc tag (Fig. S3, see Supporting Information).
Figure 3.
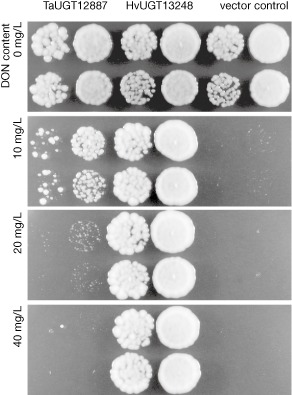
Functional evaluation of the Fhb1‐responsive uridine diphosphate‐glycosyltransferase (UGT) TaUGT12887. Spottings of toxin‐sensitive yeast strains expressing TaUGT12887, HvUGT13248 as a positive control or the empty plasmid as negative control. Two individual transformants of each strain were spotted in different dilutions on medium containing increasing amounts of toxin. DON, deoxynivalenol.
Discussion
We investigated the effect of the Qfhs.ifa‐5A QTL on gene expression and reinvestigated the host response conferred by Fhb1 using NILs harbouring either, both or none of the resistance alleles of Fhb1 and Qfhs.ifa‐5A. The NILs have the European spring wheat cultivar Remus as the recurrent parent. Previous reports have shown that the impact of both QTLs is highly dependent on the genetic background of the recurrent parent (von der Ohe et al., 2010; Salameh et al., 2011). In the present study, we observed that Qfhs.ifa‐5A (type I resistance) reduces disease severity at a similar level to lines with Fhb1 (type II resistance) after point inoculation—a method more sensitive to the assessment of type II resistance. The high level of resistance conferred by Qfhs.ifa‐5A may have been more evident with the cautious single floret inoculation method used. Most of the F. graminearum‐responsive genes found represent a general response to the pathogen, regardless of resistance level and QTL.
Previous transcriptomic studies on the F. graminearum–wheat interaction have led to the characterization of multiple defence‐associated gene classes that describe a general or genotype‐specific response of wheat to F. graminearum or DON (Ansari et al., 2007; Bernardo et al., 2007; Diethelm et al., 2012; Ding et al., 2011; Foroud et al., 2011; Golkari et al., 2009; Gottwald et al., 2012; Steiner et al., 2009; Walter et al., 2008). Walter et al. (2008) examined the gene expression of DON‐treated doubled haploid (DH) lines segregating for Fhb1, and reported the Fhb1‐dependent upregulation of several genes. Jia et al. (2009) investigated a NIL pair differential for the resistant/susceptible allele of Fhb1. They found 14 transcripts exhibiting a differential expression after comparing F. graminearum‐inoculated lines directly. Of these 14 transcripts, we identified five in our study: Ta.23324.1.S1_at (unknown), Ta.22694.1.A1_at (unknown), Ta.28185.1.S1_at (splicing factor), Ta.438.3.S1_at (nuclease) and Ta.9489.1.S1_at (regulatory gene). In addition, only a few genes identified here as QTL specific were identified in other comparable studies also using the Affymetrix GeneChip. The F. graminearum‐responsive Ta.24715.1.S1_at, encoding a peroxidase, was more abundant for Fhb1 at the earliest observed time point of 8 hai and was also found to be upregulated in response to DON, but only for the susceptible genotype Superb (24 hai; Foroud et al., 2011). This peroxidase might play a role in the generation of reactive oxygen species (ROS). Ding et al. (2011) also observed earlier abundance of peroxidases in the resistant Wangshuibai compared with a susceptible mutant, and speculated that the production of ROS induces JA and ET biosynthesis (which was not observed for Fhb1 in this work). In addition, Xiao et al. (2013) reported JA signalling to be upregulated for the QTL.
The complex data resulting from transcriptomic studies may become clearer if potential biochemical mechanisms are also considered. A reasonable basis for resistance to initial infection could be a result of a preformed barrier or antifungal protein or plant metabolite. From the candidates listed in Table 2, the 50–70‐fold more highly expressed LTP is the obvious candidate gene. With regard to Fhb1, a strong case has been made that the spread of resistance is caused by resistance to the toxin DON, which is necessary for the spread of Fusarium.
Potential links to Fhb1‐regulated DON detoxification
Although, in the highly resistant CM‐82036, the spread of the fungus is impeded in the initially inoculated spikelet, in the NILs, the fungus manages to overwhelm resistance responses and infect the rachis, where cell wall appositions create a barrier against spread to the next spikelet. The synthesis of phenylpropanoids seems to play an important role (Gunnaiah et al., 2012), but the fungus seems able to inhibit its formation by the production of the protein biosynthesis inhibitor DON (Jansen et al., 2005). DON detoxification is not necessarily constitutive, as multiple UGTs have been shown to be inducible by DON (Gardiner et al., 2010; Poppenberger et al., 2003; Schweiger et al., 2013). Thus, rapid and high inducibility of such UGTs, before the toxin can block protein synthesis, may be required for resistance. Even NIL1 had, on average, four infected spikelets, indicating that the fungus can overwhelm resistance mechanisms in the inoculated spikelet. Presumably, in the more susceptible lines NIL2 and NIL4, the resistance mechanisms in the sampled inoculated spikelets have already been overwhelmed and QTL‐specific differences are no longer evident. We found one candidate UGT, designated TaUGT12887, in the Fhb1 background, but only if basal resistance, caused by the presence of Qfhs.ifa‐5A, is already high (Fig. 1C). Potentially, interaction effects between both QTLs could also play a role in the greater abundance of this gene. Yet, when expressed in toxin‐sensitive yeast, TaUGT12887 only exhibits weak activity against DON compared with HvUGT13248 from barley (Schweiger et al., 2010).
In Brachypodium distachyon, all members of the orthologous gene cluster to TaUGT12887 were found to be induced by DON, but only two of six of these genes coded for the ability to inactivate the toxin (Schweiger et al., 2013). A similar situation can be expected for the orthologous gene families on the three genomes of wheat, wherein TaUGT12887 might be a DON‐responsive, but weakly active UGT, whereas yet uncharacterized paralogues, potentially not represented on the GeneChip, perform the primary detoxification function.
The formation of glutathione adducts may also contribute to DON detoxification. One GST in our data exhibited a positive difference in response to F. graminearum inoculation for Fhb1 (8 hai, TaAffx.112045.1.S1_x_at): This probe set corresponds to a putative tau‐class GST, which was also identified by other contrasts. Two further GSTs (TaAffx.128514.1.S1_at and Ta.886.2.S1_at, 72 hai) were identified in the additional Fhb1 contrast, in the background of Qfhs.ifa‐5A. Transcriptomic studies in DON‐infected barley indicate that the F. graminearum virulence factor DON most probably depletes the glutathione pool. The involvement of GSTs in the detoxification of DON is still unproven, but the nonenzymatic formation of DON–glutathione adducts has been shown (Gardiner et al., 2010). Recently, evidence for the occurrence in planta of a DON–glutathione conjugate and derived processing products in wheat has been demonstrated (Kluger et al., 2012).
Lemmens et al. (2005) have proposed that the Fhb1 locus either encodes a UGT or a regulatory gene affecting detoxification capability, but neither the UGT nor the GST found to be differentially expressed in this study is located in the Fhb1 interval. With regard to a potential regulator, a gene of unknown function, Ta.22694.1.A1_at, is interesting. It is constitutively more abundant (about 30‐fold) at all observed time points in the line harbouring the resistant Fhb1 allele. This gene is located close to the predicted location of Fhb1 between sts142 and sts32 (see Fig. 2). No homologous DNA is present in Sorghum bicolor, rice or B. distachyon. Only three ESTs corresponding to this sequence, two sense transcripts (cv. Chinese Spring and cv. Stephens)—for which the probe sets have been designed—and one antisense transcript (cv. Chinese Spring), are present in the database. It is unclear whether there is a meaningful (short) ORF or whether the transcript has a regulatory role.
A constitutively more highly expressed LTP associated with Qfhs.ifa‐5A
We identified 338 genes exhibiting a negative difference in response for F. graminearum at 72 hai for Qfhs.ifa‐5A, indicating higher accumulation in the presence of the susceptible Qfhs.ifa‐5A allele. One hypothesis that explains the first counterintuitive observation of a higher upregulation of multiple defence‐related genes in the susceptible cultivar is that the fungal biomass is higher in the lines lacking the Qfhs.ifa‐5A resistance allele. Consequently, more plant tissue is undergoing a defence response at a given time.
Of the few candidate genes for Qfhs.ifa‐5A proposed in the literature, none has been identified in this study. Steiner et al. (2009), using a cDNA‐amplified fragment length polymorphism (AFLP) approach, investigated the QTLs in lines harbouring both Fhb1 and Qfhs.ifa‐5A, and identified transcripts encoding a UGT and a PAL upregulated at 6 hai. Neither of these genes has been identified as specific for either QTL in our study.
A promising Qfhs.ifa‐5A candidate gene is Ta.1282.4.S1_at, a type 1 nonspecific LTP. This gene is constitutively more abundant in lines with the Qfhs.ifa‐5A resistant allele, exhibiting one of the largest differences in abundance in the microarray data. The position of Ta.1282.4.S1_at at 5AL, in close proximity to the centromere, is in the current confidence interval for Qfhs.ifa‐5A (Buerstmayr et al., 2003). Foroud et al. (2011) also reported Ta.1282.4.S1_at to be constitutively more abundant in a DH line with CYMMIT11, a FHB resistance donor with an unknown resistance QTL in its pedigree. However, screening for Qfhs.ifa‐5A using the flanking markers Gwm293 and Gwm156 did not identify Qfhs.ifa‐5A in their studied genotypes. The same LTP gene identified in this study was found to be associated with Qfhs.ifa‐5A in a microarray study comparing lines from a cross of Wuhan1 and NuyBay (T. Ouellet, Agriculture and Agri‐Food Canada, Ottawa, personal communication).
Multiple roles in defence against pathogens are ascribed to LTPs (Yeats and Rose, 2008). Sun et al. (2008) demonstrated that a different recombinant LTP protein from wheat can inhibit the in vitro growth of multiple fungal wheat pathogens, including F. graminearum. The Arabidopsis thaliana DIR1 gene encodes an LTP that binds to lipids and elicits long‐distance signalling, and thus contributes to systemic acquired resistance (Maldonado et al., 2002). Another member of the large wheat LTP family has also been shown to compete for plasma membrane receptors with elicitins, proteins secreted by fungal pathogens from the Phytophthora or Pythium genera that elicit hypersensitive responses (Buhot et al., 2001). The early interaction of F. graminearum and the host is characterized by the release of lytic enzymes which penetrate directly the outer epidermal layers (Kang and Buchenauer, 2002). The constitutively higher abundance of LTP, also reported to act in cutin deposition (Yeats et al., 2010), might coincide with the type I resistance against initial fungal penetration attributed to Qfhs.ifa‐5A. LTPs might also contribute to toxin resistance, as the overexpression of an A. thaliana LTP leads to higher resistance to the trichothecene toxin trichothecin (McLaughlin et al., 2011). Further work to functionally characterize this LTP by stable overexpression in wheat is planned. If the role of the LTP as an F. graminearum resistance determinant can indeed be confirmed, new questions related to food safety must be addressed. Many PR‐14 class LTPs do not only have a role in plant defence, but are also relevant food allergens (Palacin et al., 2007).
Taken together, this study presents candidate genes associated with the F. graminearum resistance QTLs Fhb1 and Qfhs.ifa‐5A and functionally validates an Fhb1‐related UGT, which improves resistance to DON in toxin‐sensitive yeast to a limited extent. With the release of the wheat genomic sequence in the foreseeable future, these candidates and available transcriptional data can be mapped and compared with the draft sequence of the (susceptible) cultivar Chinese Spring. Positional cloning efforts in resistant germplasm, combined with functional validation of candidates in wheat using TILLING (targeting induced local lesions in genomes) populations or virus‐induced gene silencing, will provide further insights into the resistance mediated by both QTLs. For Qfhs.ifa‐5A, additional efforts are required to resolve the locus in the centromeric region of chromosome 5A.
Experimental Procedures
Development of NILs
NILs were generated via five backcrosses to cv. Remus (FHB susceptible, Sappo/Mex//Famos) of a DH line identified from a CM‐82036 (FHB resistant, Sumai3/Thornbird) by Remus population. Selfed F2 progeny of BC5 plants were screened for the presence of the homozygous resistance QTL. NIL1 possessing the resistance alleles of Fhb1 and Qfhs.ifa‐5A, NIL2 possessing Fhb1, NIL3 carrying the Qfhs.ifa‐5A resistance allele and NIL4 carrying the susceptible alleles at Fhb1 and Qfhs.ifa‐5A were selected (Fig. 1A). The presence of the resistance QTL allele on 3BS was verified by the diagnostic co‐segregating marker umn10. The genotype of Qfhs.ifa‐5A was verified with flanking simple sequence repeat (SSR) markers barc186, gwm1057, barc56, gwm293, barc117 and gwm129 on the short arm of chromosome 5A, and barc1, barc180, barc40 and gmw156 on the long arm of 5A. The four NILs, CM‐82036 and Remus were also genotyped with DArT markers by Triticarte Pty. Ltd. (Canberra, Australia; Akbari et al., 2006; Wenzl et al., 2004).
Glasshouse experiments and tissue sampling
The glasshouse experiment and inoculum production were conducted as described in Steiner et al. (2009) with modifications. The experiment was performed in three replications and the lines were challenged by inoculation with 10 μL of a 20 000 spores/mL F. graminearum suspension or water (about 200 conidia). Five heads per genotype, treatment and replication were harvested at 8, 24 and 72 hai. Treated spikelets were separated into lemma, palea and the subtending section of the rachis and the reproductive tissues, immediately frozen in liquid nitrogen and stored at −80 °C. For phenotype scoring, one central spikelet (two florets) of 50 wheat heads per genotype was inoculated on the field with 100 conidia per floret, and diseased spikelets were counted after 12, 18 and 24 days. The inoculum concentration used for phenotyping allowed better differentiation of phenotypes between NILs. Statistically significant differences between all lines were calculated using pairwise t‐tests (adjusted P ≤ 0.05). The experiment was repeated twice.
RNA preparation and microarray hybridization
Sampled lemma, palea and rachis from five heads per experimental condition were pooled and ground to a fine powder using a mixer mill (type MM 301, Retsch, Düsseldorf, Germany). RNA was extracted according to Steiner et al. (2009). We employed the Affymetrix wheat Genome Array (Affymetrix, Santa Clara, CA, USA) for the identification of differential transcript abundances in our samples. The generation of labelled cRNA, hybridization and data acquisition were performed at the Microarray Facility of the University of Minnesota following the standard protocol described by Boddu et al. (2006).
Array and SFP analysis
Statistical analysis was performed using the R statistical analysis environment (http://www.r‐project.org) and packages of the Bioconductor suite (http://www.bioconductor.org). We used the ‘gcrma’ package (Wu et al., 2004), ‘vsn’ (Huber et al., 2002), the fitPLM function (‘affyPLM’; Bolstad, 2004) and the lmFIT function of ‘limma’ (Smyth, 2004). To identify significant differentially expressed probe sets, we calculated P values after correction for multiple testing, controlling the false discovery rate (Holm, 1979). Differentially expressed transcripts were detected on the basis of an empirical Bayes moderated t‐statistic. For the tables shown, values have arbitrarily been limited at a nominal two‐fold difference in order to present the strongest effects only. The Affymetrix CEL, DAT and EXP files have been deposited in the Plant Expression database (PLEXdb, accession TA41). SFPs were detected between the lines by applying an algorithm described by Xu et al. (2009).
QTL‐specific, constitutive and F. graminearum‐responsive transcripts (adjusted P ≤ 0.05) at 8, 24 and 72 hai were calculated by subtracting the genetic background provided by NIL4 (susceptible alleles at Fhb1 and Qfhs.ifa‐5A) from NIL2 (Fhb1) and NIL3 (Qfhs‐ifa.5A). In addition, we generated contrasts from NIL1 and NIL2/NIL3 to yield QTL‐specific contrasts in the background of the respective other QTL resistance allele. For the identification of transcripts exhibiting constitutive expression changes, mock‐inoculated samples were compared, whereas, for the F. graminearum response, transcript abundances of mock samples were subtracted from those of F. graminearum‐inoculated samples.
Interactions of the two QTLs were assessed by subtracting abundance differences of F. graminearum‐responsive transcripts identified in the single QTL contrasts (Fhb1, NIL2 – NIL4; Qfhs.ifa‐5A, NIL3 – NIL4) from the abundance differences observed in the contrast between the double QTL line NIL1 relative to NIL4. Similarly, we calculated the interaction effects comparing mock‐inoculated samples. The average F. graminearum response was calculated as the mean F. graminearum response of all four investigated genotypes.
Annotations, mapping and resequencing of Ta.1282.4.S1_at and TaUGT12887
Annotations were obtained from the wheat HarvEST‐database (http://harvest.ucr.edu, Version 1.57). Ontologies, UniProt annotations and EC numbers were acquired with the Blast2GO web tool (http://www.blast2go.org). Genes were considered to be ‘unknown’ if none of the search results exhibited E ≤ 10−10. Mapping positions to the identified gene transcripts were assigned on the basis of BlastN search results against the mapped EST database hosted on the Graingenes website (http://wheat.pw.usda.gov/GG2). Moreover, we mapped transcripts (>98% identity) to the wheat contig ctg0954b, which harbours Fhb1 (FN564434.1; Choulet et al., 2010) using GMAP (http://research‐pub.gene.com/gmap; Wu and Watanabe, 2005).
Selected candidates were mapped using a collection of Chinese Spring nulli‐tetra and ditelosomic lines and deletion lines of chromosome 5A (Wheat Genetics Resource Center, Kansas State University, Manhattan, KS, USA). Ta.1282.4.S1_at and TaUGT12887 were sequenced from cDNA samples, and genomic DNA from parental cultivars CM‐82036 and Remus. All primers are given in Table S10 (see Supporting Information).
Heterologous expression and functional testing of TaUGT12887 in S. cerevisiae
The coding sequence of TaUGT12887 was optimized for expression in S. cerevisiae by reverse translating the amino acid sequence (according to S. cerevisiae codon tables provided by the Kazusa DNA Research Institute, Chiba, Japan). The gene was custom synthesized (Eurofins MWG Operon, Ebersberg, Germany) including flanking 5′ HindIII and 3′ NotI restriction sites, which were used to clone the ORF into the HindIII/NotI cloning sites of yeast expression vector pYAK7 in frame behind the N‐terminal c‐Myc epitope tag (2μ‐PADH1‐c‐Myc‐MCS‐TADH1, LEU2; Poppenberger et al., 2003). Yeast strain YZGA515 (MATa leu2‐Δ1 trp1‐Δ63 ura3‐52 his3‐Δ200 lys2‐801 ade2‐101 pdr5::TRP1 pdr10::hisG pdr15:loxP‐KANR‐loxP ayt1::URA) was transformed with the resulting construct, pWS60, and also with pWS1921, harbouring the previously reported DON‐UGT HvUGT13248 (Schweiger et al., 2010) and the empty vector (pBP910, Poppenberger et al., 2003), as positive and negative controls, respectively.
Crystallized DON was dissolved in water to a stock concentration of 10 g/L. Yeast transformants were selected on synthetic complete medium lacking leucine, and grown in liquid selective medium to the exponential growth phase [optical density at 600 nm (OD600) = 0.7]. Three microlitres of liquid culture dilutions (OD600 = 0.05 and 0.005) were spotted on plates with yeast extract–peptone–dextrose (YPD) medium containing increasing amounts of DON, and incubated for 3 days at 30 °C. Immunodetection was performed with a primary mouse anti‐c‐Myc antibody (1:5000, clone 9E10; Invitrogen, Carlsbad, CA, USA) and a horseradish peroxidase (HRP)‐conjugated secondary anti‐mouse antibody (Jackson, West Grove, PA, USA). For signal detection, we used the SuperSignal West Pico chemiluminescent substrate (Pierce, Rockford, IL, USA).
RT‐qPCR validation
A compiled list of all primers and corresponding transcripts is given in Table S11 (see Supporting Information). One microgram of total RNA was subjected to reverse transcription (QuantiTect Reverse Transcription Kit; Qiagen, Hilden, Germany). RT‐qPCRs were performed for 45 cycles in triplicate using 1 μL of cDNA and primers (300 nm in assay) in combination with the MESA GREEN qPCR Mastermix Plus (Eurogentec, Seraing, Belgium). The reference genes glyceraldehyde‐3‐phosphate dehydrogenase (GAPDH), transcription enhancer factor‐1 (TEF1) and ubiquitin were used for normalization. Calculations of the relative fold changes were conducted as described in Pfaffl (2001). Transcripts with Ct values >40 cycles were considered as not present; the corresponding expression ratios were displayed as >100‐fold expressed.
Metabolite extraction and high‐performance liquid chromatography‐tandem mass spectrometry (HPLC‐MS/MS) analysis
Five‐hundred milligrams of ground plant material were extracted by the addition of 4 mL of solvent consisting of 79% acetonitrile, 1% acetic acid and 20% water. Samples were vigorously shaken at room temperature for 2 h, spun down and the clear supernatant was subjected to HPLC‐MS/MS analysis. Fusarium graminearum‐treated samples of NILs at 72 hai were analysed for DON and D3G (Berthiller et al., 2005).
Supporting information
Fig. S1 Reverse transcription‐quantitative polymerase chain reaction (RT‐qPCR) confirmation of selected transcripts.
Fig. S2 Multiple alignment of the resequenced wheat lipid transfer proteins (LTPs) corresponding to Ta.1282.4.S1_at in cv. CM‐82036 and Remus.
Fig. S3 Immunoblotting of the N‐terminal c‐Myc antibody used to detect uridine diphosphate‐glycosyltransferase (UGT) expression levels (A) and the corresponding Coomassie‐stained acryl amide gel as loading control (B).
Table S1 Number of transcripts exhibiting a significant difference in response to Fusarium graminearum for either Fhb1 or Qfhs.ifa‐5A at the given time point.
Table S2 Functional classification of Fusarium graminearum‐responsive transcripts and transcripts showing constitutive quantitative trait locus (QTL)‐specific differences in transcript abundance (adjusted P ≤ 0.05, ≥2 fold change).
Table S3 Transcripts exhibiting a negative difference in response for the resistant allele of Qfhs.ifa‐5A (adjusted P ≤ 0.05, ≥2 fold change, FC) after inoculation with Fusarium graminearum spores at 72 h after inoculation.
Table S4 Transcripts exhibiting constitutive differences in transcript abundance for Qfhs.ifa‐5A (adjusted P ≤ 0.05, ≥2 fold change, FC).
Table S5 Transcripts exhibiting constitutive differences in transcript abundance for Fhb1 (adjusted P ≤ 0.05, ≥2 fold change, FC).
Table S6 Fusarium graminearum‐responsive transcripts exhibiting nonadditive effects between Fhb1 and Qfhs.ifa‐5A (adjusted P ≤ 0.05, ≥2 fold change, FC).
Table S7 Transcripts exhibiting nonadditive effects between Fhb1 and Qfhs.ifa‐5A (adjusted P ≤ 0.05, ≥2 fold change, FC) in mock‐inoculated samples.
Table S8 Transcripts exhibiting a significant difference in response between NIL1 and NIL3 yielding Fhb1‐related transcripts in the presence of the Qfhs.ifa‐5A resistance allele (adjusted P ≤ 0.05, ≥2 fold change, FC) after inoculation with Fusarium graminearum spores.
Table S9 Transcripts exhibiting a significant difference in response between NIL1 and NIL2 yielding Qfhs.ifa‐5A‐related transcripts in the presence of the Fhb1 resistance allele (adjusted P ≤ 0.05, ≥2 fold change, FC) after inoculation with Fusarium graminearum spores.
Table S10 Sequences of primers used for sequencing and mapping of Ta.1282.4.S1_at and TaUGT12887.
Table S11 Sequences of primers used for the validation of transcript abundances by reverse transcription‐quantitative polymerase chain reaction (RT‐qPCR).
Acknowledgements
We thank Erik Sam for excellent technical assistance, Harald Kurz and Maria Buerstmayr for assisting in the glasshouse experiments and Andrea Koutnik for the preparation of the F. graminearum inoculum. Alexandra Posekany is acknowledged for support with the R computer language. This work was supported by the Austrian Science Fund projects #P16724‐B05, #F3711‐B11 and #F3708‐B11, the Federal State of Lower Austria, the US Wheat and Barley Scab Initiative (USDA‐ARS) and the Minnesota Small Grains Initiative.
References
- Akbari, M. , Wenzl, P. , Caig, V. , Carling, J. , Xia, L. , Yang, S. , Uszynski, G. , Mohler, V. , Lehmensiek, A. , Kuchel, H. , Hayden, M.J. , Howes, N. , Sharp, P. , Vaughan, P. , Rathmell, B. , Huttner, E. and Kilian, A. (2006) Diversity arrays technology (DArT) for high‐throughput profiling of the hexaploid wheat genome. Theor. Appl. Genet. 113, 1409–1420. [DOI] [PubMed] [Google Scholar]
- Anderson, J. , Stack, R. , Liu, S. and Waldron, B. (2001) DNA markers for Fusarium head blight resistance QTLs in two wheat populations. Theor. Appl. Genet. 102, 1164–1168. [Google Scholar]
- Ansari, K.I. , Walter, S. , Brennan, J.M. , Lemmens, M. , Kessans, S. , McGahern, A. , Egan, D. and Doohan, F.M. (2007) Retrotransposon and gene activation in wheat in response to mycotoxigenic and non‐mycotoxigenic‐associated Fusarium stress. Theor. Appl. Genet. 114, 927–937. [DOI] [PubMed] [Google Scholar]
- Bernardo, A. , Bai, G. , Guo, P. , Xiao, K. , Guenzi, A.C. and Ayoubi, P. (2007) Fusarium graminearum‐induced changes in gene expression between Fusarium head blight‐resistant and susceptible wheat cultivars. Funct. Integr. Genomics, 7, 69–77. [DOI] [PubMed] [Google Scholar]
- Berthiller, F. , Dall'Asta, C. , Schuhmacher, R. , Lemmens, M. , Adam, G. and Krska, R. (2005) Masked mycotoxins: determination of a deoxynivalenol glucoside in artificially and naturally contaminated wheat by liquid chromatography‐tandem mass spectrometry. J. Agric. Food Chem. 53, 3421–3425. [DOI] [PubMed] [Google Scholar]
- Boddu, J. , Cho, S. , Kruger, W.M. and Muehlbauer, G.J. (2006) Transcriptome analysis of the barley–Fusarium graminearum interaction. Mol. Plant–Microbe Interact. 19, 407–417. [DOI] [PubMed] [Google Scholar]
- Bolstad, B.M. (2004) Low‐level analysis of high‐density oligonucleotide array data: background, normalization and summarization. PhD Dissertation. Berkeley, CA: University of California.
- Boutrot, F. , Meynard, D. , Guiderdoni, E. , Joudrier, P. and Gautier, M.‐F. (2007) The Triticum aestivum non‐specific lipid‐transfer protein (TaLtp) gene family: comparative promoter activity of six TaLtp genes in transgenic rice. Planta, 225, 843–862. [DOI] [PubMed] [Google Scholar]
- Buerstmayr, H. , Lemmens, M. , Hartl, L. , Doldi, L. , Steiner, B. , Stierschneider, M. and Ruckenbauer, P. (2002) Molecular mapping of QTLs for Fusarium head blight resistance in spring wheat. I. Resistance to fungal spread (type II resistance). Theor. Appl. Genet. 104, 84–91. [DOI] [PubMed] [Google Scholar]
- Buerstmayr, H. , Steiner, B. , Hartl, L. , Griesser, M. , Angerer, N. , Lengauer, D. , Miedaner, T. , Schneider, B. and Lemmens, M. (2003) Molecular mapping of QTLs for Fusarium head blight resistance in spring wheat. II. Resistance to fungal penetration and spread. Theor. Appl. Genet. 107, 503–508. [DOI] [PubMed] [Google Scholar]
- Buerstmayr, H. , Ban, T. and Anderson, J.A. (2009) QTL mapping and marker‐assisted selection for Fusarium head blight resistance in wheat: a review. Plant Breed. 128, 1–26. [Google Scholar]
- Buhot, N. , Douliez, J.P. , Jacquemard, A. , Marion, D. , Tran, V. , Maume, B.F. , Milat, M.L. , Ponchet, M. , Mikès, V. , Kader, J.C. and Blein, J.P. (2001) A lipid‐transfer protein binds to a receptor involved in the control of plant defence responses. FEBS Lett. 509, 27–30. [DOI] [PubMed] [Google Scholar]
- Choulet, F. , Wicker, T. , Rustenholz, C. , Paux, E. , Salse, J. , Leroy, P. , Schlub, S. , Le Paslier, M.‐C. , Magdelenat, G. , Gonthier, C. , Couloux, A. , Budak, H. , Breen, J. , Pumphrey, M. , Liu, S. , Kong, X. , Jia, J. , Gut, M. , Brunel, D. , Anderson, J.A. , Gill, B.S. , Appels, R. , Keller, B. and Feuillet, C. (2010) Megabase level sequencing reveals contrasted organization and evolution patterns of the wheat gene and transposable element spaces. Plant Cell, 22, 1686–1701. [DOI] [PMC free article] [PubMed] [Google Scholar]
- Desjardins, A.E. (2006) Fusarium Mycotoxins: Chemistry, Genetics, and Biology. St. Paul, MN: APS Press. [Google Scholar]
- Diethelm, M. , Rhiel, M. , Wagner, C. , Mikolajewski, S. , Groth, J. , Hartl, L. , Friedt, W. and Schweizer, G. (2012) Gene expression analysis of four WIR1‐like genes in floret tissues of European winter wheat after challenge with G. zeae . Euphytica, 186, 103–114. [Google Scholar]
- Ding, L. , Xu, H. , Yi, H. , Yang, L. , Kong, Z. , Zhang, L. , Xue, S. , Jia, H. and Ma, Z. (2011) Resistance to hemi‐biotrophic F. graminearum infection is associated with coordinated and ordered expression of diverse defense signaling pathways. PloS ONE, 6, e19008. [DOI] [PMC free article] [PubMed] [Google Scholar]
- Foroud, N.A. , Ouellet, T. , Laroche, A. , Oosterveen, B. , Jordan, M.C. , Ellis, B.E. and Eudes, F. (2011) Differential transcriptome analyses of three wheat genotypes reveal different host response pathways associated with Fusarium head blight and trichothecene resistance. Plant Pathol. 61, 296–314. [Google Scholar]
- Gardiner, S. , Boddu, J. , Berthiller, F. , Hametner, C. , Stupar, R.M. , Adam, G. and Muehlbauer, G.J. (2010) Transcriptome analysis of the barley–deoxynivalenol interaction: evidence for a role of glutathione in deoxynivalenol detoxification. Mol. Plant–Microbe Interact. 23, 962–976. [DOI] [PubMed] [Google Scholar]
- Golkari, S. , Gilbert, J. , Ban, T. and Procunier, J.D. (2009) QTL‐specific microarray gene expression analysis of wheat resistance to Fusarium head blight in Sumai‐3 and two susceptible NILs. Genome, 52, 409–418. [DOI] [PubMed] [Google Scholar]
- Gottwald, S. , Samans, B. , Lück, S. and Friedt, W. (2012) Jasmonate and ethylene dependent defence gene expression and suppression of fungal virulence factors: two essential mechanisms of Fusarium head blight resistance in wheat? BMC Genomics, 13, 369. [DOI] [PMC free article] [PubMed] [Google Scholar]
- Gunnaiah, R. , Kushalappa, A.C. , Duggavathi, R. , Fox, S. and Somers, D.J. (2012) Integrated metabolo‐proteomic approach to decipher the mechanisms by which wheat QTL (Fhb1) contributes to resistance against F. graminearum . PLoS ONE, 7, e40695. [DOI] [PMC free article] [PubMed] [Google Scholar]
- Holm, S. (1979) A simple sequentially rejective multiple test procedure. Scand. J. Stat. 6, 65–70. [Google Scholar]
- Horevaj, P. , Brown‐Guedira, G. and Milus, E.A. (2012) Resistance in winter wheat lines to deoxynivalenol applied into florets at flowering stage and tolerance to phytotoxic effects on yield. Plant Pathol. 61, 925–933. [Google Scholar]
- Huber, W. , von Heydebreck, A. , Sültmann, H. , Poustka, A. and Vingron, M. (2002) Variance stabilization applied to microarray data calibration and to the quantification of differential expression. Bioinformatics, 18, 96–104. [DOI] [PubMed] [Google Scholar]
- Jansen, C. , von Wettstein, D. , Schäfer, W. , Kogel, K.H. , Felk, A. and Maier, F.J. (2005) Infection patterns in barley and wheat spikes inoculated with wild‐type and trichodiene synthase gene disrupted Fusarium graminearum . Proc. Natl. Acad. Sci. USA, 102, 16 892–16 897. [DOI] [PMC free article] [PubMed] [Google Scholar]
- Jia, H. , Cho, S. and Muehlbauer, G.J. (2009) Transcriptome analysis of a wheat near‐isogenic line pair carrying Fusarium head blight‐resistant and ‐susceptible alleles. Mol. Plant–Microbe Interact. 22, 1366–1378. [DOI] [PubMed] [Google Scholar]
- Kang, Z. and Buchenauer, H. (2002) Immunocytochemical localization of β‐1,3‐glucanase and chitinase in Fusarium culmorum‐infected wheat spikes. Physiol. Mol. Plant Pathol. 60, 141–153. [Google Scholar]
- Kluger, B. , Büschl, C. , Lemmens, M. , Häubl, G. , Labuda, R. , Adam, G. , Krska, R. and Schuhmacher, R. (2012) Stable isotopic labelling‐assisted untargeted screening reveals novel conjugates of the mycotoxin deoxynivalenol in wheat. Anal. Bioanal. Chem. 405, 5031–5036. [DOI] [PMC free article] [PubMed] [Google Scholar]
- Lemmens, M. , Scholz, U. , Berthiller, F. , Dall'Asta, C. , Koutnik, A. , Schuhmacher, R. , Adam, G. , Buerstmayr, H. , Mesterházy, A. , Krska, R. and Ruckenbauer, P. (2005) The ability to detoxify the mycotoxin deoxynivalenol colocalizes with a major quantitative trait locus for Fusarium head blight resistance in wheat. Mol. Plant–Microbe Interact. 18, 1318–1324. [DOI] [PubMed] [Google Scholar]
- Leonard, K.J. and Bushnell, W.R. (2003) Fusarium Head Blight of Wheat and Barley. St. Paul, MN: APS Press. [Google Scholar]
- Liu, S. , Zhang, X. , Pumphrey, M.O. , Stack, R.W. , Gill, B.S. and Anderson, J. (2006) Complex microcolinearity among wheat, rice, and barley revealed by fine mapping of the genomic region harboring a major QTL for resistance to Fusarium head blight in wheat. Funct. Integr. Genomics, 6, 83–89. [DOI] [PubMed] [Google Scholar]
- Liu, S. , Pumphrey, M.O. , Gill, B.S. , Trick, H.N. , Zhang, J.X. , Dolezel, J. , Chalhoub, B. and Anderson, J. (2008) Toward positional cloning of Fhb1, a major QTL for Fusarium head blight resistance in wheat. Cereal Res. Commun. 36, 195–201. [Google Scholar]
- Maldonado, A.M. , Doerner, P. , Dixon, R.A. , Lamb, C.J. and Cameron, R.K. (2002) A putative lipid‐transfer protein involved in systemic resistance signalling in Arabidopsis. Nature, 419, 399–403. [DOI] [PubMed] [Google Scholar]
- McLaughlin, J. , Bin Umer, A. , Basu, D. , McCormick, S. and Tumer, N.E. (2011) An activation tagging screen to identify novel genes for Fusarium head blight (FHB) resistance. Proceedings of the National Fusarium Head Blight Forum. St. Louis, MO, USA, p. 90 East Lansing: US Wheat and Barley Scab Initiative. [Google Scholar]
- von der Ohe, C. , Ebmeyer, E. , Korzun, V. and Miedaner, T. (2010) Agronomic and quality performance of winter wheat backcross populations carrying non‐adapted Fusarium head blight resistance QTL. Crop Sci. 50, 2283–2290. [Google Scholar]
- Palacin, A. , Quirce, S. , Armentia, A. , Fernández‐Nieto, M. , Pacios, L.F. , Asensio, T. , Sastre, J. , Diaz‐Perales, A. and Salcedo, G. (2007) Wheat lipid transfer protein is a major allergen associated with baker's asthma. J. Allergy Clin. Immunol. 120, 1132–1138. [DOI] [PubMed] [Google Scholar]
- Pestka, J.J. (2010) Deoxynivalenol: mechanisms of action, human exposure, and toxicological relevance. Arch. Toxicol. 84, 663–679. [DOI] [PubMed] [Google Scholar]
- Pfaffl, M.W. (2001) A new mathematical model for relative quantification in real‐time RT‐PCR. Nucleic Acids Res. 29, e45. [DOI] [PMC free article] [PubMed] [Google Scholar]
- Poppenberger, B. , Berthiller, F. , Lucyshyn, D. , Sieberer, T. , Schuhmacher, R. , Krska, R. , Kuchler, K. , Glössl, J. , Luschnig, C. and Adam, G. (2003) Detoxification of the Fusarium mycotoxin deoxynivalenol by a UDP‐glucosyltransferase from Arabidopsis thaliana . J. Biol. Chem. 278, 47 905–47 914. [DOI] [PubMed] [Google Scholar]
- Salameh, A. , Buerstmayr, M. , Steiner, B. , Neumayer, A. , Lemmens, M. and Buerstmayr, H. (2011) Effects of introgression of two QTL for Fusarium head blight resistance from Asian spring wheat by marker‐assisted backcrossing into European winter wheat on Fusarium head blight resistance, yield and quality traits. Mol. Breed. 28, 485–494. [Google Scholar]
- Schweiger, W. , Boddu, J. , Shin, S. , Poppenberger, B. , Berthiller, F. , Lemmens, M. , Muehlbauer, G.J. and Adam, G. (2010) Validation of a candidate deoxynivalenol‐inactivating UDP‐glucosyltransferase from barley by heterologous expression in yeast. Mol. Plant–Microbe Interact. 23, 977–986. [DOI] [PubMed] [Google Scholar]
- Schweiger, W. , Pasquet, J.‐C. , Nussbaumer, T. , Kovalsky Paris, M.P. , Wiesenberger, G. , Macadré, C. , Ametz, C. , Berthiller, F. , Lemmens, M. , Saindrenan, P. , Mewes, H.‐W. , Mayer, K.F.X. , Dufresne, M. and Adam, G. (2013) Functional characterization of two clusters of Brachypodium distachyon UDP‐glycosyltransferases encoding putative deoxynivalenol detoxification genes. Mol. Plant–Microbe Interact. 26, 781–792. [DOI] [PubMed] [Google Scholar]
- Shen, X. , Francki, M.G. and Ohm, H.W. (2006) A resistance‐like gene identified by EST mapping and its association with a QTL controlling Fusarium head blight infection on wheat chromosome 3BS. Genome, 49, 631–635. [DOI] [PubMed] [Google Scholar]
- Shin, S. , Torres‐Acosta, J.A. , Heinen, S.J. , McCormick, S. , Lemmens, M. , Paris, M.P. , Berthiller, F. , Adam, G. and Muehlbauer, G.J. (2012) Transgenic Arabidopsis thaliana expressing a barley UDP‐glucosyltransferase exhibit resistance to the mycotoxin deoxynivalenol. J. Exp. Bot. 63, 4731–4740. [DOI] [PMC free article] [PubMed] [Google Scholar]
- Smyth, G.K. (2004) Linear models and empirical Bayes methods for assessing differential expression in microarray experiments. Stat. Appl. Genet. Mol. Biol. 3, 3. [DOI] [PubMed] [Google Scholar]
- Steiner, B. , Kurz, H. , Lemmens, M. and Buerstmayr, H. (2009) Differential gene expression of related wheat lines with contrasting levels of head blight resistance after Fusarium graminearum inoculation. Theor. Appl. Genet. 118, 753–764. [DOI] [PMC free article] [PubMed] [Google Scholar]
- Sun, J.‐Y. , Gaudet, D. , Lu, Z.‐X. , Frick, M. , Puchalski, B. and Laroche, A. (2008) Characterization and antifungal properties of wheat nonspecific lipid‐transfer proteins. Mol. Plant–Microbe Interact. 21, 346–360. [DOI] [PubMed] [Google Scholar]
- The European Commission (2006) Commission recommendation (EC) no. 1881/2006 of 19 December 2006 setting maximum levels for certain contaminants in foodstuffs. OJ L, 364, 5–24. [Google Scholar]
- Volpi, C. , Janni, M. , Lionetti, V. , Bellincampi, D. , Favaron, F. and D'Ovidio, R. (2011) The ectopic expression of a pectin methyl esterase inhibitor increases pectin methyl esterification and limits fungal diseases in wheat. Mol. Plant–Microbe Interact. 24, 1012–1019. [DOI] [PubMed] [Google Scholar]
- Walter, S. , Brennan, J.M. , Arunachalam, C. , Ansari, K.I. , Hu, X. , Khan, M.R. , Trognitz, F. , Trognitz, B. , Leonard, G. , Egan, D. and Doohan, F.M. (2008) Components of the gene network associated with genotype‐dependent response of wheat to the Fusarium mycotoxin deoxynivalenol. Funct. Integr. Genomics, 8, 421–427. [DOI] [PubMed] [Google Scholar]
- Walter, S. , Nicholson, P. and Doohan, F.M. (2010) Action and reaction of host and pathogen during Fusarium head blight disease. New Phytol. 185, 54–66. [DOI] [PubMed] [Google Scholar]
- Wenzl, P. , Carling, J. , Kudrna, D. , Jaccoud, D. , Huttner, E. , Kleinhofs, A. and Kilian, A. (2004) Diversity Arrays Technology (DArT) for whole‐genome profiling of barley. Proc. Natl. Acad. Sci. USA, 101, 9915–9920. [DOI] [PMC free article] [PubMed] [Google Scholar]
- Wu, T.D. and Watanabe, C.K. (2005) GMAP: a genomic mapping and alignment program for mRNA and EST sequences. Bioinformatics, 21, 1859–1875. [DOI] [PubMed] [Google Scholar]
- Wu, Z. , Irizarry, R.A. , Gentleman, R. , Martinez‐Murillo, F. and Spencer, F. (2004) A model‐based background adjustment for oligonucleotide expression arrays. J. Am. Stat. Assoc. 99, 909–917. [Google Scholar]
- Xiao, J. , Jin, X. , Wang, H. , Cao, A. , Zhao, W. , Pei, H. , Xue, Z. , He, L. , Chen, Q. and Wang, X. (2013) Transcriptome‐based discovery of pathways and genes related to resistance against Fusarium head blight in wheat landrace Wangshuibai. BMC Genomics, 14, 197. [DOI] [PMC free article] [PubMed] [Google Scholar]
- Xu, W.W. , Cho, S. , Yang, S.S. , Bolon, Y.‐T. , Bilgic, H. , Jia, H. , Xiong, Y. and Muehlbauer, G.J. (2009) Single‐feature polymorphism discovery by computing probe affinity shape powers. BMC Genet. 10, 48. [DOI] [PMC free article] [PubMed] [Google Scholar]
- Yeats, T.H. and Rose, J.K.C. (2008) The biochemistry and biology of extracellular plant lipid‐transfer proteins (LTPs). Protein Sci. 17, 191–198. [DOI] [PMC free article] [PubMed] [Google Scholar]
- Yeats, T.H. , Howe, K.J. , Matas, A.J. , Buda, G.J. , Thannhauser, T.W. and Rose, J.K. (2010) Mining the surface proteome of tomato (Solanum lycopersicum) fruit for proteins associated with cuticle biogenesis. J. Exp. Bot. 61, 3759–3771. [DOI] [PMC free article] [PubMed] [Google Scholar]
- Zhuang, Y. , Gala, A. and Yen, Y. (2013) Identification of functional genic components of major Fusarium head blight resistance quantitative trait loci in wheat cultivar Sumai3. Mol. Plant–Microbe Interact. 26, 442–450. [DOI] [PubMed] [Google Scholar]
Associated Data
This section collects any data citations, data availability statements, or supplementary materials included in this article.
Supplementary Materials
Fig. S1 Reverse transcription‐quantitative polymerase chain reaction (RT‐qPCR) confirmation of selected transcripts.
Fig. S2 Multiple alignment of the resequenced wheat lipid transfer proteins (LTPs) corresponding to Ta.1282.4.S1_at in cv. CM‐82036 and Remus.
Fig. S3 Immunoblotting of the N‐terminal c‐Myc antibody used to detect uridine diphosphate‐glycosyltransferase (UGT) expression levels (A) and the corresponding Coomassie‐stained acryl amide gel as loading control (B).
Table S1 Number of transcripts exhibiting a significant difference in response to Fusarium graminearum for either Fhb1 or Qfhs.ifa‐5A at the given time point.
Table S2 Functional classification of Fusarium graminearum‐responsive transcripts and transcripts showing constitutive quantitative trait locus (QTL)‐specific differences in transcript abundance (adjusted P ≤ 0.05, ≥2 fold change).
Table S3 Transcripts exhibiting a negative difference in response for the resistant allele of Qfhs.ifa‐5A (adjusted P ≤ 0.05, ≥2 fold change, FC) after inoculation with Fusarium graminearum spores at 72 h after inoculation.
Table S4 Transcripts exhibiting constitutive differences in transcript abundance for Qfhs.ifa‐5A (adjusted P ≤ 0.05, ≥2 fold change, FC).
Table S5 Transcripts exhibiting constitutive differences in transcript abundance for Fhb1 (adjusted P ≤ 0.05, ≥2 fold change, FC).
Table S6 Fusarium graminearum‐responsive transcripts exhibiting nonadditive effects between Fhb1 and Qfhs.ifa‐5A (adjusted P ≤ 0.05, ≥2 fold change, FC).
Table S7 Transcripts exhibiting nonadditive effects between Fhb1 and Qfhs.ifa‐5A (adjusted P ≤ 0.05, ≥2 fold change, FC) in mock‐inoculated samples.
Table S8 Transcripts exhibiting a significant difference in response between NIL1 and NIL3 yielding Fhb1‐related transcripts in the presence of the Qfhs.ifa‐5A resistance allele (adjusted P ≤ 0.05, ≥2 fold change, FC) after inoculation with Fusarium graminearum spores.
Table S9 Transcripts exhibiting a significant difference in response between NIL1 and NIL2 yielding Qfhs.ifa‐5A‐related transcripts in the presence of the Fhb1 resistance allele (adjusted P ≤ 0.05, ≥2 fold change, FC) after inoculation with Fusarium graminearum spores.
Table S10 Sequences of primers used for sequencing and mapping of Ta.1282.4.S1_at and TaUGT12887.
Table S11 Sequences of primers used for the validation of transcript abundances by reverse transcription‐quantitative polymerase chain reaction (RT‐qPCR).