Abstract
Advances in imaging technologies such as magnetic resonance elastography (MRE) have allowed researchers to gain insights into muscle function in vivo. MRE has been used to examine healthy and diseased muscle by calculating shear modulus. However, additional information can be measured from visualizing a mechanical wave as it passes through a tissue. One such measurable quantity is wave attenuation. The purpose of this study was to determine if a simple measure of wave attenuation could be used to distinguish between healthy and diseased muscle. Twenty seven subjects (14 healthy controls, 7 hyperthyroid myopathy patients, 6 myositis patients) participated in this study. Wave amplitude was determined along a linear profile through the center of the muscle, and an exponential decay curve was fit to the data. This measure was able to find significant differences in attenuation between healthy and diseased muscle. Furthermore, four hyperthyroid myopathy subjects who were tested following treatment all showed improvement by this measure. A likely reason for patients with hyperthyroid myopathy and myositis behaving similarly is that this measurement may reflect similar changes in the muscle extracellular matrix. In addition to modulus, attenuation seems to be an important parameter to measure in skeletal muscle. Further research is needed to investigate other potential measures of attenuation as well as examining other potential measures that can be found from visualizing wave propagation. Future studies should also include muscle biopsies to confirm that the changes seen are as a result of changes in extracellular matrix structure.
Keywords: Biomechanics, MRE, Collagen, Extracellular matrix, Myositis, Hyperthyroid myopathy
1. Introduction
Advances in imaging technologies have allowed researchers to gain insights into muscle function in vivo. Examples include using T2 weighted MR imaging to examine muscle activity (Fisher et al., 1990) and using velocity-encoded (Finni et al., 2006) or displacement-encoded (Zhong et al., 2008) cine phase-contrast MR to measure strain distribution within an active muscle. Elastography is another technique that has shown promise for examining muscle in vivo. Early elastography studies used ultrasound imaging (Levinson et al., 1995). However, magnetic resonance elastography (MRE) has several advantages over ultrasound, including the ability to examine deeper tissue (Heers et al., 2003) and has been shown to be able to measure muscle tissue shear stiffness (Kruse et al., 2000). For a review of applications of MRE to skeletal muscle see Ringleb et al. (2007).
MRE is based upon the idea of applying a small amplitude vibration to the tissue of interest and generating shear waves that propagate through the tissue, while at the same time applying a motion-sensitizing gradient that is synchronized to the tissue vibration. Phase-contrast MRI is then used to visualize the waves as they pass through the tissue (Muthupillai et al., 1995). Typically an inversion technique is applied to calculate shear modulus throughout the tissue based on the wave motion (Manduca et al., 2001).
Several studies have used MRE to measure the shear modulus of healthy muscle in vivo (e.g. Dresner et al., 2001; Uffmann et al., 2004; Papazoglou et al., 2005; Bensamoun et al., 2006). MRE has also been shown to be able to measure changes in muscle associated with treatment for hyperthyroidism (Bensamoun et al., 2007) and to be able to detect myofascial taut bands (Chen et al., 2007). These studies have focused on the calculation of shear modulus. However, additional information can be obtained from visualizing a mechanical wave as it passes through a tissue. Viscosity seems a likely candidate parameter to calculate, as MRE has been used to calculate viscosity in other soft tissues (e.g. Sinkus et al., 2005; Klatt et al., 2007). Assuming for example the viscoelastic Voigt model and an isotropic media, a viscoelastic characterizing parameter can be calculated by exciting the muscle at multiple frequencies, measuring the wave lengths and attenuation at each frequency, and curve fitting wavelength–frequency and attenuation–frequency equations (Manduca et al., 2001). However, attenuation is related to viscosity and can be calculated simply, therefore seems to be a good measure for initial testing.
The purpose of this study was to determine if a simple measure of wave attenuation could be used to distinguish between healthy and diseased muscle.
2. Methods
Twenty seven subjects participated in this study. Fourteen study subjects were healthy controls (4 male and 10 female; age: 35.9±16.4 years; height: 1.65±0.10 cm; body mass: 64.5±10.2 kg). Six subjects had myositis (2 male and 4 female; age: 44.5±24.3 years; height: 1.65±0.12 m; body mass: 72.8±22.8 kg). Myositis patients were diagnosed by proximal muscle weakness, elevated serum levels of muscle enzymes, and muscle biopsy evidence of inflammation. Five of the myositis patients had dermatomyositis and one had polymyositis. The remaining seven study subjects had hyperthyroid myopathy (1 male and 6 female; age: 40±14.9 years; height: 1.67±0.052 m; body mass: 66.0±12.8 kg). Hyperthyroid myopathy patients showed suppressed serum thyrotropin (TSH) and elevated levels of free thyroxine (FT4) and triiodothyronine (T3). FT4 ranged from 1.8 to 8.2 ng/dL, while TSH levels were all below 0.010 mLU/L. Of the seven hyperthyroid subjects four subjects were retested after treatment with radioactive iodine and levothyroxine replacement. All subjects provided informed consent, and all procedures were approved by the institutional review board.
Scans were performed with a 1.5 T General Electric Signa MRI machine. A custom-made Helmholtz surface receive coil was placed around the thigh for data acquisition (Bensamoun et al., 2006). The subjects laid supine with a 30° knee angle and were instructed to relax all muscles during the scans. Vibration was applied by a small silicone tube wrapped around the subject’s thigh of the distance from the patellar tendon to the greater trochanter. This tube was connected via a long hose to an acoustic speaker operating at 90 Hz. The resulting vibration produced shear waves with amplitudes on the order of microns. When the MRE images were collected, four phase offsets were obtained. The flip angle was 45° and the FOV was 24 × 24 cm2. The acquisition matrix was 256 × 64, which was interpolated to 256 × 256. The slice thickness was 5 mm. The TR was 350 ms and the TE corresponded to the minimum spin echo time that allowed for motion encoding.
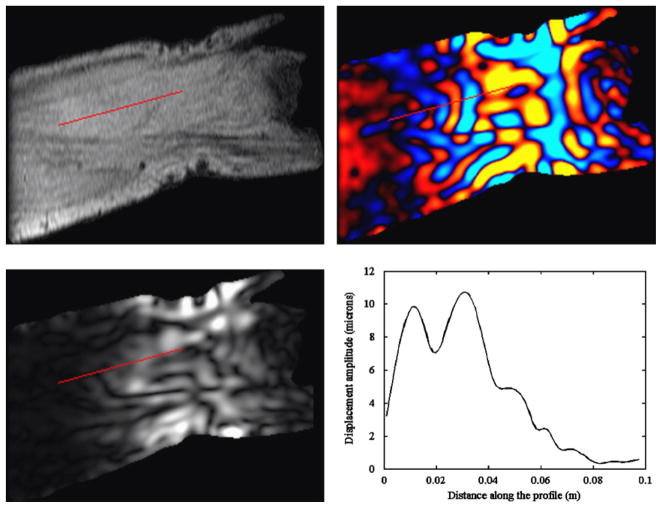
A series of axial scout images of the thigh was acquired using gradient echo sequence. From these images an oblique slice was drawn tangent to the medial curvature of the vastus medialis. This slice was then translated so that it was approximately in the middle of the muscle in a central axial image. Axial images were scrolled through to verify the placement of this plane stayed within the muscle (Bensamoun et al., 2006). MRE scans were performed in this plane (Fig. 1). Phase data was unwrapped and filtered using a bandwidth Butterworth filter with wavelength cutoffs of 0.48 and 4.8 m. At each pixel a time-domain, discrete Fourier analysis was performed on the displacement data of the four phase offsets, and the amplitude of the first harmonic component at 90 Hz was extracted and reported as the wave amplitude at that pixel. A linear profile was drawn starting in the center of the muscle at the point of vibration application (Fig. 2). This profile continued proximally to the end of the muscle in a direction estimated to be perpendicular to the wave motion from the phase image.
Fig. 1.
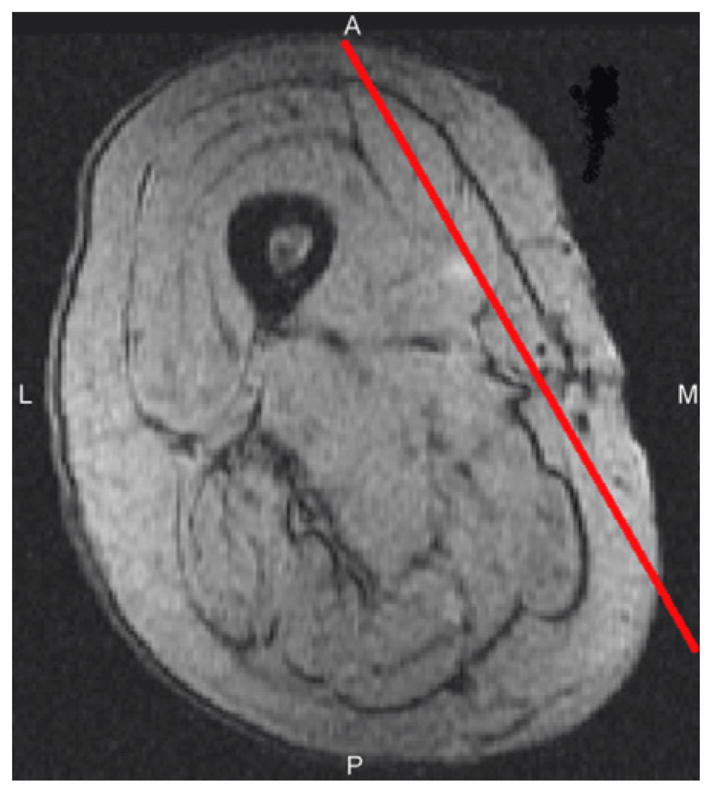
T2* weighted, gradient echo, axial image of the right thigh, showing the location of the scan plane through the vastus medialis.
Fig. 2.
Typical output from a MRE scan. Top left: magnitude image. Top right: phase image displaying wave displacements. Bottom left: displacement amplitude image. Bottom right: amplitude plot along the selected profile. The red line indicates the location of the linear profile. (For interpretation of the references to color in this figure legend, the reader is referred to the web version of this article.)
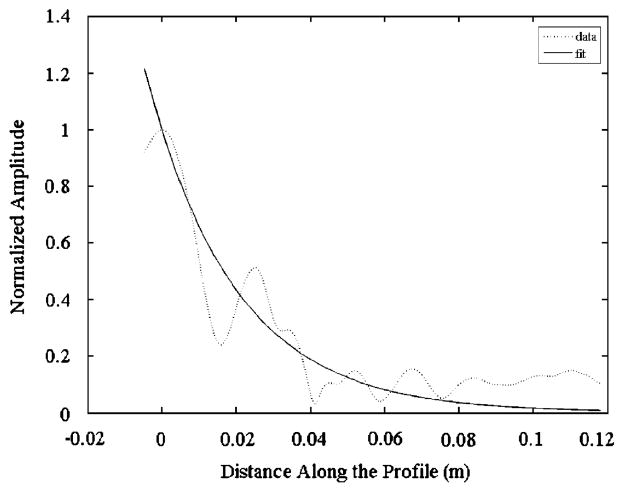
The values for amplitude along the profile were then used to determine a decay constant for wave attenuation in each subject. For each profile, the maximum value for amplitude was determined and used to normalize the data. Any points distal to the maximum were assumed to be a result of attenuation in the distal direction and were discarded. An exponential decay curve was fit to the remaining data using a least squares fit to Eq. (1) (Fig. 3).
Fig. 3.
Typical normalized amplitude data along the profile and the curve fit. Zero distance corresponds to the location of maximum amplitude along the profile. Data to the left of zero is disregarded.
| (1) |
where A is the displacement amplitude, AMax is the maximum displacement amplitude, λ is the spatial decay constant of displacement amplitude and x is the distance along the profile measured in meters
A Student t-test was used to compare means of the decay constants between diseased and healthy muscle. A value for significance was set at 0.05.
3. Results
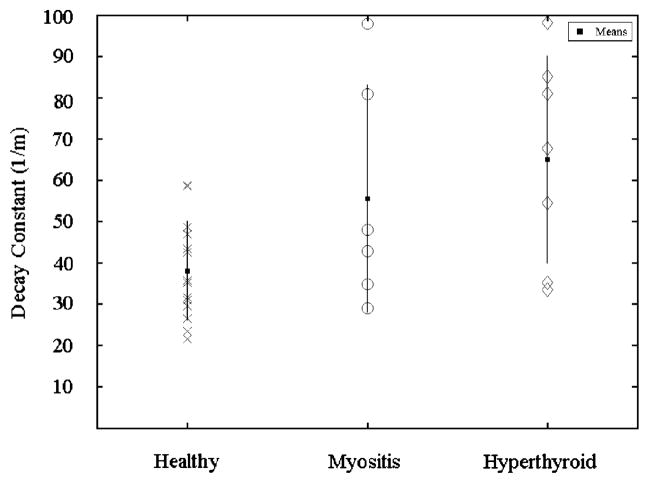
All results are presented as mean±standard deviation. Healthy muscle was found to have a decay constant of 38.1±12.1 m−1 and diseased muscle was found to have a decay constant of 60.7±25.6 m−1. This difference was found to be statistically significant. Means for the different pathologies were 55.6±27.5 m−1 for myositis and 65.1±25.1 m−1 for hyperthyroid (Fig. 4).
Fig. 4.
Decay constants for each subject separated by group. The squares indicate group means. The lines indicate standard deviations.
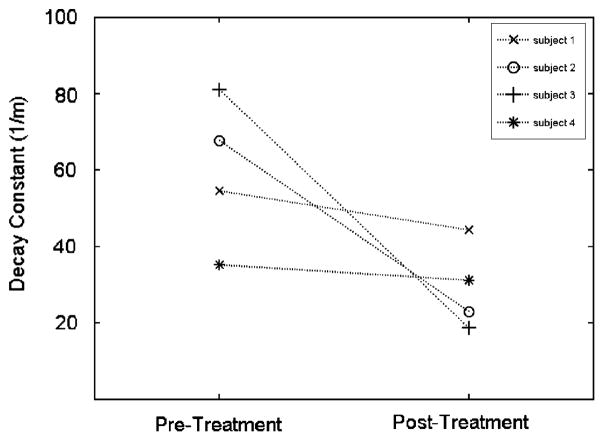
The four hyperthyroid patients whom retest data were available had a mean decay constant of 59.6±19.6 m−1 pre-treatment and a mean decay constant of 29.3±11.3 m−1 post-treatment. Each of the four subjects showed a decrease in decay constant following treatment (Fig. 5).
Fig. 5.
Decay constants for each hyperthyroid patient with pre- and post-treatment data.
4. Discussion
A decay constant fit to wave amplitude data was selected as a simple measure of wave attenuation. This measure was able to find significant differences in attenuation between healthy and diseased muscle. Furthermore, four subjects who were tested following treatment all showed improvement by this measure.
A likely reason for patients with hyperthyroid myopathy and myositis behaving similarly is that this measurement may reflect changes in the muscle extracellular matrix. It is known that thyroid hormone induces matrix degradation by activating matrix metalloproteinase-1 (Ghose Roy et al., 2007) and as well as having a role in regulating collagen synthesis (Klein et al., 1996) in cardiac muscle. Increased activity of matrix metalloproteinases have also been seen in patients with myositis (Kieseier et al., 2001).
In addition to modulus, attenuation seems to be an important parameter to measure in skeletal muscle. However, the standard deviation of this measure was large. The large standard deviation in patients may be related to disease severity, but even in healthy subjects there was a relatively large standard deviation. Viscoelastic behavior of muscle is complex and depends on fiber orientation (van Loocke et al., 2008). Therefore, variation in the placement of the profile with respect to fiber orientation seems a likely cause for the large standard deviations found. Future studies should consider anisotropic models. Other issues such as nonlinearity and muscle inhomogeneity may also contribute to large standard deviations. Given that viscoelastic behavior of muscle is also rate dependent (van Loocke et al., 2008), future studies should consider collecting wavelength and attenuation data at multiple frequencies. Thus, allowing parameters which characterize the viscous and elastic properties related to shear deformation to be calculated by curve fitting different viscoelastic models.
Even though a simple measure of attenuation had large variation, statistically significant differences were observed between healthy and diseased muscle. The use of viscosity and incorporation of anisotropy will likely decrease variation and enhance the usefulness of this measure. Future studies should also include muscle biopsies to confirm that the changes seen are as a result of changes in extracellular matrix structure.
Acknowledgments
This study was supported by grants from NIBIB R01 EB 00812 and NICHD T32 HD 07447. We thank Tom Hulshizer for his help with data collection.
Footnotes
Conflict of interest statement
None of the authors have a conflict of interest.
References
- Bensamoun SF, Ringleb SI, Littrell L, Chen Q, Brennan M, Ehman RL, An KN. Determination of thigh muscle stiffness using magnetic resonance elastography. Journal of Magnetic Resonance Imaging. 2006;23:242–247. doi: 10.1002/jmri.20487. [DOI] [PubMed] [Google Scholar]
- Bensamoun SF, Ringleb SI, Chen Q, Ehman RL, An KN, Brennan M. Thigh muscle stiffness assessed with magnetic resonance elastography in hyperthyroid patients before and after medical treatment. Journal of Magnetic Resonance Imaging. 2007;26:708–713. doi: 10.1002/jmri.21073. [DOI] [PubMed] [Google Scholar]
- Chen Q, Bensamoun S, Basford JR, Thompson JM, An KN. Identification and quantification of myofascial taut bands with magnetic resonance elastography. Archives of Physical Medicine and Rehabilitation. 2007;88:1658–1661. doi: 10.1016/j.apmr.2007.07.020. [DOI] [PubMed] [Google Scholar]
- Dresner MA, Rose GH, Rossman PJ, Muthupillai R, Manduca A, Ehman RL. Magnetic resonance elastography of skeletal muscle. Journal of Magnetic Resonance Imaging. 2001;13:269–276. doi: 10.1002/1522-2586(200102)13:2<269::aid-jmri1039>3.0.co;2-1. [DOI] [PubMed] [Google Scholar]
- Finni T, Hodgson JA, Lai AM, Edgerton VR, Sinha S. Muscle synergism during isometric plantarflexion in achilles tendon rupture patients and in normal subjects revealed by velocity-encoded cine phase-contrast MRI. Clinical Biomechanics. 2006;21:67–74. doi: 10.1016/j.clinbiomech.2005.08.007. [DOI] [PubMed] [Google Scholar]
- Fisher MJ, Meyer RA, Adams GR, Foley JM, Potchen EJ. Direct relationship between proton T2 and exercise intensity in skeletal muscle MR images. Investigative Radiology. 1990;25:480–485. doi: 10.1097/00004424-199005000-00003. [DOI] [PubMed] [Google Scholar]
- Ghose Roy S, Mishra S, Ghosh G, Bandyopadhyay A. Thyroid hormone induces myocardial matrix degradation by activating matrix metalloproteinase-1. Matrix Biology. 2007;26:269–279. doi: 10.1016/j.matbio.2006.12.005. [DOI] [PubMed] [Google Scholar]
- Heers G, Jenkyn T, Dresner MA, Klein MO, Basford JR, Kaufman KR, Ehman RL, An KN. Measurement of muscle activity with magnetic resonance elastography. Clinical Biomechanics. 2003;18:537–542. doi: 10.1016/s0268-0033(03)00070-6. [DOI] [PubMed] [Google Scholar]
- Kieseier BC, Schneider C, Clements JM, Gearing AJ, Gold R, Toyka KV, Hartung HP. Expression of specific matrix metalloproteinases in inflammatory myopathies. Brain. 2001;124:341–351. doi: 10.1093/brain/124.2.341. [DOI] [PubMed] [Google Scholar]
- Klatt D, Hamhaber U, Asbach P, Braun J, Sack I. Noninvasive assessment of the rheological behavior of human organs using multifrequency MR elastography: a study of brain and liver viscoelasticity. Physics in Medicine and Biology. 2007;52:7281–7294. doi: 10.1088/0031-9155/52/24/006. [DOI] [PubMed] [Google Scholar]
- Klein LE, Sigel AV, Douglas JA, Eghbali-Webb M. Upregulation of collagen type I gene expression in the ventricular myocardium of thyroidectomized male and female rats. Journal of Molecular and Cellular Cardiology. 1996;28:33–42. doi: 10.1006/jmcc.1996.0004. [DOI] [PubMed] [Google Scholar]
- Kruse SA, Smith JA, Lawrence AJ, Dresner MA, Manduca A, Greenleaf JF, Ehman RL. Tissue characterization using magnetic resonance elastography: preliminary results. Physics in Medicine and Biology. 2000;45:1579–1590. doi: 10.1088/0031-9155/45/6/313. [DOI] [PubMed] [Google Scholar]
- Levinson SF, Shinagawa M, Sato T. Sonoelastic determination of human skeletal muscle elasticity. Journal of Biomechanics. 1995;28:1145–1154. doi: 10.1016/0021-9290(94)00173-2. [DOI] [PubMed] [Google Scholar]
- Manduca A, Oliphant TE, Dresner MA, Mahowald JL, Kruse SA, Amromin E, Felmlee JP, Greenleaf JF, Ehman RL. Magnetic resonance elastography: non-invasive mapping of tissue elasticity. Medical Image Analysis. 2001;5:237–254. doi: 10.1016/s1361-8415(00)00039-6. [DOI] [PubMed] [Google Scholar]
- Muthupillai R, Lomas DJ, Rossman PJ, Greenleaf JF, Manduca A, Ehman RL. Magnetic resonance elastography by direct visualization of propagating acoustic strain waves. Science. 1995;269:1854–1857. doi: 10.1126/science.7569924. [DOI] [PubMed] [Google Scholar]
- Papazoglou S, Braun J, Hamhaber U, Sack I. Two-dimensional waveform analysis in MR elastography of skeletal muscles. Physics in Medicine and Biology. 2005;50:1313–1325. doi: 10.1088/0031-9155/50/6/018. [DOI] [PubMed] [Google Scholar]
- Ringleb SI, Bensamoun SF, Chen Q, Manduca A, An KN, Ehman RL. Applications of magnetic resonance elastography to healthy and pathologic skeletal muscle. Journal of Magnetic Resonance Imaging. 2007;25:301–309. doi: 10.1002/jmri.20817. [DOI] [PubMed] [Google Scholar]
- Sinkus R, Tanter M, Catheline S, Lorenzen J, Kuhl C, Sondermann E, Fink M. Imaging anisotropic and viscous properties of breast tissue by magnetic resonance-elastography. Magnetic Resonance in Medicine. 2005;53:372–387. doi: 10.1002/mrm.20355. [DOI] [PubMed] [Google Scholar]
- Uffmann K, Maderwald S, Ajaj W, Galban CG, Mateiescu S, Quick HH, Ladd ME. In vivo elasticity measurements of extremity skeletal muscle with MR elastography. NMR in Biomedicine. 2004;17:181–190. doi: 10.1002/nbm.887. [DOI] [PubMed] [Google Scholar]
- Van Loocke M, Lyons CG, Simms CK. Viscoelastic properties of passive skeletal muscle in compression: stress–relaxation behaviour and constitutive modelling. Journal of Biomechanics. 2008;41:1555–1566. doi: 10.1016/j.jbiomech.2008.02.007. [DOI] [PubMed] [Google Scholar]
- Zhong X, Epstein FH, Spottiswoode BS, Helm PA, Blemker SS. Imaging two-dimensional displacements and strains in skeletal muscle during joint motion by cine DENSE MR. Journal of Biomechanics. 2008;41:532–540. doi: 10.1016/j.jbiomech.2007.10.026. [DOI] [PMC free article] [PubMed] [Google Scholar]


