

Abstract
Despite efforts to increase HIV testing in the African region, the proportion of men who report ever having been tested for HIV remains low. Research has focused on individual level determinants of women's testing however little is known about factors associated with men's testing behavior. This analysis investigates community influences on HIV testing among men ages 15–54, using Demographic and Health Survey (DHS) data from Chad, Ghana, Malawi, Nigeria, Tanzania, Uganda, Zambia, and Zimbabwe. Multilevel models were fitted in each country for the outcome of ever receiving an HIV test. After controlling for individual and household level factors, community level factors of demographics, economics, and behavior and knowledge remain significantly associated with HIV testing among men. The results of this analysis highlight the need to recognize the impact of community influences on men's HIV test seeking behavior, and to harness these community factors in the design of programs aimed at encouraging the uptake of HIV testing among men in Africa.
Keywords: Contextual influences, Male HIV testing, Gender, Community
Introduction
Globally, there have been increases in the proportion of adults who report ever having received an HIV test [1]. However, despite the presence of a range of HIV testing and counseling modes of delivery and implementation models—voluntary counseling and testing (VCT), couples voluntary counseling and testing (CVCT), mobile testing, and community and home based testing, and more recently, provider initiated testing—knowledge of serostatus is still unacceptably low and significant gender differences exist in testing rates [1]. There is a growing body of evidence describing determinants of testing among men; however, much of this research is conducted in high-resource settings (namely the U.S.) and focuses on men who have sex with men (MSM). Current studies investigating determinants of HIV testing in low-resources settings have primarily concentrated on women's testing behavior, either through examining factors associated with couples VCT or determinants of uptake of testing among women seeking antenatal care services [2–4]. Very little research has focused on determinants of HIV testing among men in resource poor settings. Understanding factors associated with receiving an HIV test among men is an important aspect of supporting men's sexual health. Additionally, given that an increasing body of evidence suggests that women's risk for HIV infection is highest in marriage, examining married men's uptake of HIV testing can help to address issues related to transmission of HIV among partners [5–8].
Previous research focusing on individual level determinants of HIV testing has focused on individual's perceptions of the availability of services and the quality of services provided [9–12]. Historically, testing campaigns have been more successful among women because of programmatic efforts to integrate VCT and opt-out testing during antenatal care visits [3, 13]. Additionally, women and girls are more likely to present at formal health-care services than are men [14]. In addition to infrastructural level influences on individual's testing behavior, studies have also demonstrated that being married, higher levels of education, urban residence, and knowledge of HIV are significantly associated with receiving an HIV test [15–18]. Although some studies have addressed dyadic level factors associated with testing behavior and HIV status disclosure, these have been largely confined to associations between intimate partner violence and HIV status and testing behavior [19–21]. Increasingly, the results of individual level studies of HIV testing behavior point to the role of contextual level factors in shaping the willingness to undergo an HIV test, for example, the roles of perceived stigma arising from local attitudes towards sexual health and behavior, and acknowledge the role of social factors in determining individual level behavior [22–24].
In recent years, there has been a general growth of interest in examining how community level factors shape health outcomes [25–28]. Studies using a community level approach to investigating factors associated HIV and sexual health have generally focused on how the health infrastructure and care delivery in the community shape individual health outcomes, or how community perceptions of stigma around HIV/AIDS shape individual behavior [29, 30]. Other previous work has demonstrated an association between media exposure in the community and community socio-economic status and various HIV related outcomes [31–34]. Taken together, these studies confirm the importance of evaluating contextual influences on HIV related outcomes. However, there is a paucity of research addressing community level determinants of men's HIV testing uptake, resulting in a gap in our understanding of how to harness community level factors to improve the health of men and their sexual partners.
This paper examines associations between individual, household, and community level factors and men's HIV testing behavior in 8 African countries, with a particular focus on investigating the relationships between community demographics, economics, and behavior and knowledge on men's HIV testing. Evidence suggests that men are more responsive to the influence of social norms and have different motivations for testing than do women [23, 35]. Identifying contextual influences on men's testing behavior is critical to informing HIV testing programmatic efforts and addressing gender gaps in HIV testing uptake.
Methods
The data used in this analysis were from the nationally representative Demographic and Health Surveys (DHS) for eight African countries: Chad (2004), Ghana (2003), Malawi (2004), Nigeria (2003), Tanzania (2004–2005), Uganda (2006), Zambia (2001–2002), and Zimbabwe (2005–2006). A full list of countries with available DHS data can be found at www.measuredhs.com. DHS collect data on fertility, family planning, and health knowledge as well as demographic and socioeconomic information among women of reproductive age. Companion surveys of males were also conducted in each of the study countries. For the men's sample, the age was 15–59 for most countries but 15–49 in Tanzania and 15–54 in Malawi, Uganda, and Zimbabwe. The DHS men's questionnaires included a module on HIV/AIDS and sexual behavior that gathered information on knowledge of HIV/AIDS, source of knowledge, attitudes towards HIV/AIDS, uptake of HIV testing, and recent sexual behavior. The module was standardized across countries allowing for standard dependent and independent variables for the analysis. Nationally representative samples of men were obtained through separate stratified multi-stage cluster sample designs for rural and urban areas in each country, and appropriate weights are applied in analysis to ensure representativeness of the data. The response rates for the men's questionnaire ranged from 94.4 % (Chad) to 81.9 % (Zimbabwe). Lower response rates reflect more men's frequent and longer absences from the home. For this analysis, samples were restricted to married sexually active men in order to identify factors that shape men's testing behavior within marriage. The resulting sample sizes were: Chad 1062, Ghana 1821, Malawi 2114, Nigeria 1196, Tanzania 1379, Uganda 1443, Zambia 780, and Zimbabwe 3367.
The DHS collect data on HIV testing behavior. Specifically, respondents are asked whether they have ever been tested and if so, whether they received the results and where they were tested. The dependent variable for analysis is a binary variable that captures whether the respondent reports having been tested for HIV and receiving the results. The variable is coded 1 if the respondent reports both having been tested for HIV and receiving the results and is coded 0 if the respondent reports never having been tested for HIV. Given the focus of this analysis on knowledge of sero-status, it was decided that men who reported having been tested but never receiving the results would also be coded zero (the proportion of men who reported being tested but not receiving the results was very low, less than 1 % in each country).
For each of the eight countries, a separate multi-level logistic model was fitted for the outcome of reporting ever having an HIV test and receiving the results using the STATA software package (College Station, Texas). The multilevel modeling technique was used to account for the hierarchical structure of the data. DHS data violate the assumption of independence as the data are collected through a complex sample design and respondents are clustered within Primary Sampling Units (PSUs); the standard errors are underestimated if the sampling design is not accounted for in the model. By using a multi-level modeling technique, the influence of community (PSU) level factors on men's testing behavior can be estimated [36, 37]. Additionally, through multilevel modeling, the clustering of HIV testing behavior can be identified allowing for the estimation of the extent to which testing behavior differs between communities.
Since very few studies have addressed community level influences on men's HIV testing behavior, this study takes an exploratory approach to the analysis. For this analysis, three levels of potential influence on HIV testing behavior are considered: individual, household, and community. Individual and household level factors included in the analysis capture general background characteristics as well as factors shown to influence testing behavior in previous studies. Table 1 shows the distribution of the individual and household level factors included: age, residence, education, number of living children, age at first sex, regular media exposure to radio, television, and newspaper, and household wealth. Bivariate analyses were performed between these factors and the outcome of interest, HIV testing and receipt of results (Table 3). Variables significantly associated with the outcome (at the <0.05 level) in at least one country were included in the multivariate analysis.
Table 1.
Distribution of individual and household level factors among married men ages 15–54 in 8 countries
| HIV testing |
||||||||
|---|---|---|---|---|---|---|---|---|
| Malawi | Tanzania | Uganda | Zambia | Chad | Nigeria | Ghana | Zimbabwe | |
| Age | ||||||||
| 15–19 | 0.90 | 0.51 | 0.69 | 0.95 | 0.62 | 0.42 | 0.44 | 0.30 |
| 20–24 | 12.68 | 9.50 | 10.40 | 13.38 | 7.04 | 4.52 | 7.58 | 8.97 |
| 25–29 | 23.51 | 19.58 | 16.91 | - | 17.43 | 11.20 | - | 19.63 |
| 30–34 | 20.62 | 22.48 | 22.04 | - | 16.90 | 17.98 | - | 22.36 |
| 35–39 | 12.87 | 18.49 | 19.20 | 29.46 | 15.93 | 15.47 | 24.55 | 16.66 |
| 40+ | 29.42 | 29.44 | 30.77 | 56.22 | 42.08 | 50.42 | 67.44 | 32.08 |
| Residence | ||||||||
| Urban | 12.72 | 19.36 | 12.75 | 27.03 | 48.59 | 36.37 | 32.62 | 34.72 |
| Rural | 87.28 | 80.64 | 87.25 | 72.97 | 51.41 | 63.63 | 67.38 | 65.28 |
| Education | ||||||||
| None | 14.47 | 14.94 | 8.04 | 6.08 | 51.58 | 32.53 | 31.85 | 2.61 |
| Primary | 64.81 | 73.02 | 66.25 | 55.14 | 23.50 | 30.02 | 13.40 | 32.31 |
| Secondary | 18.83 | 8.41 | 19.20 | 31.35 | 19.10 | 25.25 | 46.29 | 57.56 |
| Higher | 1.89 | 3.63 | 6.51 | 7.43 | 5.81 | 12.21 | 8.46 | 7.51 |
| Number of living children | ||||||||
| None | 6.29 | 8.56 | 4.02 | 4.32 | 9.86 | 7.19 | 4.72 | 6.68 |
| 1–2 | 27.25 | 29.30 | 19.89 | 15.00 | 21.92 | 22.32 | 14.17 | 38.25 |
| 3–4 | 25.31 | 25.96 | 20.24 | 12.16 | 18.66 | 20.23 | 24.05 | 28.69 |
| 5+ | 41.15 | 36.19 | 55.86 | 68.51 | 49.56 | 50.25 | 57.06 | 26.37 |
| Age at first sex | ||||||||
| <15 | 23.32 | 18.49 | 22.45 | 32.57 | 14.88 | 8.70 | 8.79 | 8.91 |
| 16–20 | 50.90 | 51.56 | 61.88 | 44.73 | 44.10 | 29.85 | 45.63 | 54.56 |
| 21+ | 25.78 | 29.95 | 15.66 | 22.70 | 41.02 | 61.45 | 45.58 | 36.53 |
| Reports regular media exposure | ||||||||
| Yes | 50.14 | 62.94 | 39.71 | 45.27 | 37.41 | 54.93 | 51.78 | 66.17 |
| No | 49.86 | 37.06 | 60.29 | 54.73 | 62.59 | 45.07 | 48.22 | 33.83 |
| Household wealth quintile | ||||||||
| 1 | 13.39 | 19.36 | 21.07 | n.a. | 14.79 | 21.07 | 26.63 | 18.98 |
| 2 | 21.95 | 21.25 | 21.83 | n.a. | 14.26 | 20.15 | 20.76 | 19.45 |
| 3 | 25.35 | 19.14 | 18.85 | n.a. | 11.80 | 19.23 | 18.67 | 14.43 |
| 4 | 22.89 | 21.83 | 18.43 | n.a. | 16.37 | 18.56 | 14.55 | 27.38 |
| 5 | 16.41 | 18.42 | 19.82 | n.a. | 42.78 | 20.99 | 19.38 | 19.75 |
Table 3.
Distribution of testing by individual and household level factors, among men ages 15–54 in 8 countries
| HIV testing |
||||||||
|---|---|---|---|---|---|---|---|---|
| Malawi | Test statistic P value | Tanzania | Test statistic P value | Uganda | Test statistic P value | Zambia | Test statistic P value | |
| Agea | ||||||||
| 15–19 | 10.53 | 6.89 | 0.00 | 5.04 | 10.00 | 17.06 | 0.00 | 7.48 |
| 20–24 | 15.67 | 0.228 | 14.50 | 0.410 | 26.00 | 0.004 | 9.09 | 0.058 |
| 25–29 | 18.51 | 17.78 | 35.25 | n.a. | ||||
| 30–34 | 16.74 | 14.19 | 32.08 | n.a. | ||||
| 35–39 | 13.60 | 19.61 | 29.96 | 16.06 | ||||
| 40+ | 13.50 | 16.75 | 22.75 | 19.23 | ||||
| Residenceb | ||||||||
| Urban | 27.14 | 31.08 | 28.46 | 33.62 | 49.46 | 45.17 | 20.00 | 2.06 |
| Rural | 13.93 | 0.000 | 13.76 | 0.000 | 25.50 | 0.000 | 15.56 | 0.151 |
| Educationa | ||||||||
| None | 9.15 | 63.61 | 9.71 | 58.06 | 9.48 | 102.96 | 8.89 | 9.47 |
| Primary | 13.50 | 0.000 | 15.00 | 0.000 | 23.64 | 0.000 | 14.95 | 0.024 |
| Secondary | 25.13 | 29.31 | 43.32 | 18.53 | ||||
| Higher | 42.50 | 48.00 | 58.51 | 29.09 | ||||
| Number of living childrena | ||||||||
| None | 21.80 | 6.57 | 14.41 | 2.44 | 31.03 | 14.26 | 18.75 | 2.85 |
| 1–2 | 16.67 | 0.087 | 17.57 | 0.485 | 32.06 | 0.003 | 11.71 | 0.415 |
| 3–4 | 15.89 | 18.44 | 35.27 | 20.00 | ||||
| 5+ | 13.79 | 15.03 | 24.69 | 17.16 | ||||
| Age at first sexa | ||||||||
| <15 | 14.40 | 2.77 | 12.94a | 6.36 | 25.93 | 1.45 | 11.62 | 15.54 |
| 16–20 | 15.06 | 0.249 | 15.89a | 0.041 | 29.45 | 0.483 | 15.71 | 0.000 |
| 21+ | 17.80 | 20.10a | 28.76 | 26.19 | ||||
| Reports regular media exposureb | ||||||||
| Yes | 20.28 | 35.23 | 19.47 | 13.87 | 41.88 | 82.82 | 17.91 | 0.58 |
| No | 10.91 | 0.000 | 11.74 | 0.000 | 19.77 | 0.000 | 15.80 | 0.445 |
| Household wealth quintilea | ||||||||
| 1 | 13.43 | 43.67 | 11.99 | 56.34 | 18.75 | 109.88 | n.a. | n.a |
| 2 | 9.05 | 0.000 | 10.58 | 0.000 | 17.78 | 0.000 | n.a. | |
| 3 | 14.74 | 13.64 | 21.69 | n.a. | ||||
| 4 | 16.95 | 16.28 | 36.84 | n.a. | ||||
| 5 | 25.65 | 31.89 | 49.65 | n.a. | ||||
| HIV testing |
||||||||
|---|---|---|---|---|---|---|---|---|
| Chad | Test statistic P value | Nigeria | Test statistic P value | Ghana | Test statistic P value | Zimbabwe | Test statistic P value | |
| Agea | ||||||||
| 15–19 | 14.29 | 8.24 | 40.00 | 9.04 | 0.00 | 4.08 | 20.00 | 4.89 |
| 20–24 | 5.00 | 0.143 | 16.67 | 0.107 | 5.07 | 0.252 | 18.21 | 0.429 |
| 25–29 | 8.59 | 24.63 | n.a. | 23.75 | ||||
| 30–34 | 7.81 | 23.26 | n.a. | 22.18 | ||||
| 35–39 | 10.50 | 32.97 | 10.07 | 22.82 | ||||
| 40+ | 5.02 | 24.71 | 8.71 | 20.74 | ||||
| Residenceb | ||||||||
| Urban | 13.59 | 70.25 | 30.57 | 9.58 | 17.68 | 88.51 | 30.97 | 88.92 |
| Rural | 0.86 | 0.000 | 22.47 | 0.002 | 4.40 | 0.000 | 16.88 | 0.000 |
| Educationa | ||||||||
| None | 1.19 | 149.40 | 17.48 | 86.58 | 2.76 | 66.37 | 6.82 | 108.29 |
| Primary | 5.62 | 0.000 | 20.89 | 0.000 | 6.97 | 0.000 | 13.79 | 0.000 |
| Secondary | 15.21 | 26.49 | 10.91 | 24.61 | ||||
| Higher | 37.88 | 55.48 | 22.08 | 39.53 | ||||
| Number of living childrena | ||||||||
| None | 18.75 | 31.89 | 26.74 | 4.47 | 8.14 | 17.43 | 21.33 | 10.27 |
| 1–2 | 5.62 | 0.000 | 20.97 | 0.214 | 12.02 | 0.001 | 24.22 | 0.016 |
| 3–4 | 9.43 | 28.93 | 12.33 | 21.64 | ||||
| 5+ | 4.44 | 25.79 | 6.45 | 18.47 | ||||
| Age at first sexa | ||||||||
| <15 | 10.65 | 19.90 | 19.23 | 4.13 | 6.88 | 1.52 | 17.67 | 6.53 |
| 16–20 | 9.58 | 0.000 | 28.57 | 0.126 | 8.30 | 0.466 | 21.07 | 0.038 |
| 21+ | 3.00 | 24.76 | 9.52 | 23.82 | ||||
| Reports regular media exposureb | ||||||||
| Yes | 15.53 | 74.71 | 34.09 | 57.88 | 14.42 | 79.47 | 25.67 | 58.91 |
| No | 1.97 | 0.000 | 14.84 | 0.000 | 2.62 | 0.000 | 14.14 | 0.000 |
| Household wealth quintilea | ||||||||
| 1 | 0.00 | 79.48 | 13.10 | 30.50 | 2.47 | 134.57 | 11.11 | 136.51 |
| 2 | 0.62 | 0.000 | 26.14 | 0.000 | 3.17 | 0.000 | 15.57 | 0.000 |
| 3 | 1.49 | 29.13 | 5.88 | 20.37 | ||||
| 4 | 2.69 | 25.68 | 13.21 | 24.30 | ||||
| 5 | 14.81 | 33.47 | 22.66 | 35.64 | ||||
F test statistic
χ2 test statistic
Given that community level data is not routinely collected in the DHS, community level data were derived from individual level responses. The PSU served as a proxy for the individual's community in this analysis. Individual level data were aggregated to the PSU (minus the index response) to form proxy community indicators. In each of the study countries a companion survey was completed of representative samples of women of reproductive age (15–49). For this analysis, community level variables were created using both the women's and men's surveys to allow for the conceptualization of men's sexual behavior as influenced by aggregate behaviors, attitudes, and characteristics of both men and women in the community. The datasets were linked using the PSU identifier. Community level variables were chosen based on previous literature investigating sexual health care seeking behavior among men and conceptualized into three domains.
Community Economics
Previous research has demonstrated an association between socio-economic status—both wealth and education—and HIV related health outcomes for men and women [17, 33, 34]. The influence of community level economics on HIV testing may be related to decreased barriers to care through increased ability to allocate scarce resources to health more broadly as well as increased social networks and exposure to health promotion interventions through the workplace and schools [9]. However, this association is complicated by perceived stigma. Men may be reluctant to determine serostatus if they feel that doing so they become defined as ill and their ability secure and maintain employment becomes threatened [38]. To measure community economics, four variables were chosen. The percentage of men currently employed and the percentage of women currently employed in the community were measured separately as well as the percentage of men with at least a primary education and the percentage of women with at least a primary education in the community. Since this study seeks to examine married men's testing behavior, by including variables for both men and women in the community the impact of women's increased participation in the work-force and education on men's testing behavior can be explored.
Community Behavior and Knowledge
The literature on determinants of HIV testing highlights individual perception of risk for HIV infection as a significant factor influencing uptake of HIV testing [10, 16, 23]. General knowledge of HIV, HIV prevention, and the benefits of HIV testing and counseling have also been associated with uptake of testing in previous studies [11, 15, 18]. Other dimensions of behavior and knowledge, intimate partner violence (IPV) and decision-making dynamics between partners have been shown to shape testing and disclosure behavior in previous studies; however, much of this research is focused on women's experience of IPV and subsequent HIV risk [21, 30]. Some evidence suggests that men's risk for HIV is increased through perpetration of IPV and gender power dynamics around condom negotiation [39]. Taken together, attitudes towards violence and decision-making are associated with constructs of masculinity which in turn could influence sexual risk-taking and perception of HIV risk and may ultimately impact health care-seeking behavior [39].
To examine behavior and knowledge at the community level, 5 variables were selected. Men's sexual behavior was measured using the mean number of sexual partners in the last 12 months for men in the community and the proportion of men in the community who reported using at condom at last intercourse. The proportion of men and women in the community who know three ways to avoid HIV infection was used to measure HIV knowledge. In order to capture men's attitudes towards intimate partner violence and male roles, the mean score for men in the community on an index measuring acceptability of violence against women and the mean score for men in the community on an index measuring household decision-making were used. The index of attitudes towards violence included 5 variables measuring the acceptability of violence against women in five circumstances (leaving the home without permission, neglect of children, burning food, arguing with husband and refusing sex). A score of 5 on this index corresponded with condoning violence under each of these circumstances. The index of men's attitudes towards their roles in decision-making was created from five variables: purchasing large goods, purchasing small daily goods, visits to family/relatives, food to be cooked, and how money earned by a spouse is spent. Men who score five on this index report that they have the final say in each of these decisions. The indices were first created at the individual level, and then aggregated to the PSU. Data on attitudes towards violence against women and decision-making were not available for Chad.
Community Demographics
Patterns in the community regarding marriage and childbearing may reflect broader gender norms and expectations. Gender roles and younger ages of marriage and childbearing in the community help to define and shape men's perceptions of their role as the head of household. Social scripts of masculinity may pressure men to maintain their position as the primary source of financial support for their families, creating a reticence to test as it would threaten their perceived health status and, if they tested positive, would cause them to be dependent upon other family members [38]. Two variables were chosen to capture the impact of community level demographics on men's HIV testing behavior: the mean age at marriage for women and the mean age at first birth for women in the community.
An iterative model building process was used and a random intercept was fitted to account for the hierarchical structure of the data. Fitting a random intercept allows for the estimation of inter- and intra-cluster variance. Model 1 included the individual and household level variables shown in Tables 2, 3 and model 2 included the addition of the community level variables described in Table 1. The sigma mu values for model 1 and model 2 were reported for each country to show the remaining unexplained random variance.
Table 2.
Operational definitions for community level variables used in modeling factors associated with HIV testing among men in eight African countries
| Community level variables | Definition |
|---|---|
| Community economics | |
| Percentage of men currently employed | Percentage of men in the community who are currently employed |
| Percentage of women currently employed | Percentage of women in the community who are currently employed |
| Percentage of men with at least primary education | Percentage of men in the community with at least a primary education |
| Percentage of women with at least primary education | Percentage of women in the community with at least a primary education |
| Community behavior and knowledge | |
| Mean number of sexual partners for men in previous 12 months | Mean number of sexual partners for men in the previous 12 months in the community |
| Percentage of men using a condom at last intercourse | Percentage of men in the community who used a condom at last intercourse |
| Percentage of men who know 3 ways to avoid HIV infection | Percentage of men in the community who know 3 ways to avoid HIV infection |
| Percentage of women who know 3 ways to avoid HIV infection | Percentage of women in the community who know 3 ways to avoid HIV infection |
| Mean score for men on attitudes towards violence against women | 6 point scale of attitudes towards domestic violence where a lower score indicates that violence is not justified. |
| Mean score for men on attitudes towards male roles | 5 point scale of men's attitudes to their roles in household decision-making where a higher score reflects men who report making the final decision |
| Community demographics | |
| Mean age at marriage for women | Mean age at marriage for women ages 15–49 in the community |
| Mean age at first birth for women | Mean age at first birth for women ages 15–49 in the community |
Results
Overall, the proportion of men who reported ever getting tested for HIV and receiving the results ranged from 7.04 % in Chad to 28.55 % in Uganda (Fig. 1). The majority of respondents were from rural areas; with the exception of Chad with 49 % living in urban areas and 51 % in rural areas (Table 1). The age of respondents was evenly distributed in Malawi, Tanzania, Uganda, and Zimbabwe; however, in Zambia, Chad, Nigeria, and Ghana respondents were older, specifically more than 42 % of men were over age forty. In general the respondents had either completed primary or secondary education; however in Chad, Nigeria, and Ghana a large proportion of men reported no education at all (Chad 51.58 %, Nigeria 32.53 %, and Ghana 31.85 %). The majority of respondents reported having more than one child, and age at first sex was greater than 15 years old. Men differed across country by regular exposure to media. In Tanzania, Nigeria, and Zimbabwe most men reported regular media exposure. Conversely, in Uganda, Zambia, and Chad most men reported that they did not have regular media exposure, and about an even number of men from Malawi and Ghana reported having and not having regular media exposure (Table 1).
Fig. 1.
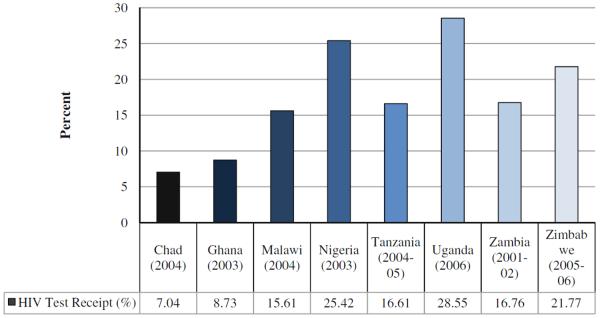
Distribution of HIV test receipt among men in 8 African countries (%)
The distribution of testing by individual and household level factors, and bivariate associations with HIV testing, are shown in Table 3. In seven of the eight countries there was no significant association between age and HIV testing, but in Uganda men 25–39 were more likely to be tested then men less than age 25, and over age 40. Urban residents, men with more education, and men in the higher household wealth quintiles were, not surprisingly, more likely to be tested across all eight countries. Men with more than five children and men who report no regular media exposure were less likely to report testing, although the relationship between parity and HIV testing was not significant in all countries. The relationship between HIV testing and age at first sex was in consistent: in Tanzania, Zambia, and Zimbabwe men who reported an older age at first sex were more likely to report testing, while in Chad, men who reported a younger age at first sex were more likely to report HIV testing. The results of the multilevel modeling of HIV testing are presented by community domain (Table 4).
Table 4.
Multilevel model for HIV testing among men 15–54 in 8 African countries
| Malawi |
Tanzania |
|||
|---|---|---|---|---|
| OR (95 % CI) | z (P > z) | OR (95 % CI) | z (P > z) | |
| Individual | ||||
| Age (15–19) | ||||
| 20–24 | 2.13 (1.31, 3.47) | 0.71 (0.476) | 3.37 (1.62, 6.99) | 5.71 (0.000) |
| 25–29 | 2.74 (1.62, 4.61) | 0.83 (0.407) | 5.18 (2.43, 11.0) | 5.72 (0.000) |
| 30–34 | 1.96 (1.09, 3.53) | 0.55 (0.585) | 3.56 (1.60, 7.92) | 5.55 (0.000) |
| 35–39 | 1.61 (0.83, 3.13) | 0.27 (0.790) | 3.94 (1.70, 9.15) | 5.62 (0.000) |
| 40+ | 1.52 (0.80, 2.59) | 0.27 (0.789) | 3.80 (1.64, 8.79) | 5.59 (0.000) |
| Resident in a rural area | 0.63 (0.45, 0.90) | −2.51 (0.012) | 0.78 (0.53, 1.13) | −0.90 (0.368) |
| Education (none) | ||||
| Primary | 1.21 (0.77, 1.91) | 1.12 (0.261) | 1.77 (0.97, 3.22) | 1.52 (0.127) |
| Secondary | 1.91 (1.15, 3.17) | 2.76 (0.006) | 2.66 (1.32, 5.38) | 2.23 (0.026) |
| Higher | 4.28 (2.02, 9.05) | 3.31 (0.001) | 6.71 (2.99, 15.3) | 3.59 (0.000) |
| Number of living children (None) | ||||
| 1–2 | 0.84 (0.60, 1.19) | −2.02 (0.064) | 1.16 (0.78, 1.73) | 0.63 (0.525) |
| 3–4 | 0.95 (0.63, 1.44) | −1.49 (0.137) | 1.31 (0.82, 2.09) | 0.94 (0.348) |
| 5+ | 1.13 (0.71, 1.82) | −1.29 (0.196) | 1.20 (0.71, 2.03) | 0.60 (0.151) |
| Age at first sex (<15) | ||||
| 16–20 | 1.07 (0.82, 1.39) | −0.01 (0.992) | 1.09 (0.77, 1.54) | 0.92 (0.356) |
| 21+ | 1.32 (0.96, 1.82) | 1.41 (0.159) | 1.19 (0.78, 1.79) | 0.98 (0.328) |
| Reports regular exposure to radio, television and newspaper | 1.42 (1.10, 1.82) | 3.70 (0.000) | 0.98 (0.71, 1.35) | 0.48 (0.631) |
| Household | ||||
| Household wealth quintile (1) | ||||
| 2 | 0.70 (0.45, 1.08) | −1.81 (0.071) | 0.86 (0.52, 1.41) | −0.99 (0.322) |
| 3 | 1.22 (0.82, 1.81) | 0.28 (0.783) | 0.93 (0.57, 1.51) | −0.43 (0.666) |
| 4 | 1.32 (0.85, 2.05) | 0.74 (0.460) | 1.12 (0.70, 1.79) | −0.58 (0.561) |
| 5 | 1.32 (0.85, 2.05) | 1.69 (0.092) | 1.23 (0.70, 2.15) | 0.81 (0.417) |
| Community economics | ||||
| Percentage of men currently employed | 1.01 (0.71, 1.44) | 0.24 (0.814) | 0.81 (0.35, 1.87) | −0.17 (0.865) |
| Percentage of women currently employed | 0.82 (0.48, 1.37) | −0.20 (0.843) | 0.51 (0.23, 1.09) | −1.23 (0.219) |
| Percentage of men with at least primary education | 0.74 (0.30, 1.78) | −0.08 (0.936) | 0.34 (0.19, 0.98) | −2.00 (0.046) |
| Percentage of women with at least primary education | 2.27 (0.97, 5.27) | 0.35 (0.729) | 4.56 (1.75, 11.8) | 2.17 (0.030) |
| Community behavior & knowledge | ||||
| Mean number of sexual partners for men in previous 12 months | 0.63 (0.41, 0.99) | −1.34 (0.018) | 0.59 (0.43, 0.81) | −2.58 (0.010) |
| Percentage of men using a condom at last intercourse | 3.14 (1.51, 6.52) | 1.23 (0.012) | 2.75 (1.34, 5.66) | 1.72 (0.045) |
| Percentage of men who know 3 ways to avoid HIV infection | 1.50 (0.18, 12.6) | 0.39 (0.696) | 0.51 (0.18, 1.47) | −1.36 (0.174) |
| Percentage of women who know 3 ways to avoid HIV infection | 1.51 (0.51, 4.42) | 0.10 (0.920) | 3.83 (0.54, 2.71) | 1.21 (0.226) |
| Mean score for men on attitudes towards violence against women | 0.99 (0.70, 1.38) | −2.29 (0.212) | 1.10 (0.86, 1.41) | 0.80 (0.424) |
| Mean score for men on attitudes towards male roles | 0.78 (0.57, 1.07) | 0.48 (0.634) | 1.12 (0.95, 1.32) | 0.75 (0.452) |
| Community demographics | ||||
| Mean age at marriage for women | 0.99 (0.81, 1.14) | −0.71 (0.479) | 0.97 (0.84, 1.13) | 0.75 (0.456) |
| Mean age at first birth for women | 0.98 (0.82, 1.18) | −0.25 (0.799) | 0.99 (0.84, 1.17) | −0.53 (0.595) |
| Sigma mu (SE) | ||||
| Community level random intercept | 0.66 (0.12) | 0.37 (0.27) | ||
| Uganda |
Zambia |
|||
|---|---|---|---|---|
| OR (95 %CI) | z (P > z) | OR (95 %CI) | z (P > z) | |
| Individual | ||||
| Age (15–19) | ||||
| 20–24 | 1.69 (0.28, 2.15) | 0.83 (0.406) | 1.33 (1.14, 2.58) | 5.28 (0.000) |
| 25–29 | 2.63 (0.51, 4.60) | 1.35 (0.178) | - | - |
| 30–34 | 2.30 (0.25, 4.24) | 1.13 (0.260) | - | - |
| 35–39 | 2.25 (0.20 (4.25) | 1.08 (0.279) | 2.21 (1.45, 3.12) | 4.12 (0.000) |
| 40+ | 1.89 (0.30, 2.56) | 0.89 (0.375) | 2.45 (1.57, 3.78) | 5.12 (0.000) |
| Resident in a rural area | 1.53 (1.04, 2.26) | 2.20 (0.028) | 0.85 (0.52, 1.39) | −0.50 (0.616) |
| Education (none) | ||||
| Primary | 1.60 (0.83, 3.08) | 1.52 (0.130) | 1.68 (0.51, 5.46) | 0.20 (0.844) |
| Secondary | 2.54 (1.28, 5.05) | 2.50 (0.012) | 2.31 (0.68, 7.54) | 0.54 (0.590) |
| Higher | 4.00 (1.88, 8.54) | 2.78 (0.005) | 1.99 (0.47, 8.38) | 0.94 (0.348) |
| Number of living children (none) | ||||
| 1–2 | 0.87 (0.42, 1.81) | −0.36 (0.719) | 1.01 (0.49. 2.07) | −1.70 (0.090) |
| 3–4 | 0.91 (0.41, 2.00) | −0.21 (0.830) | 1.16 (0.47, 2.87) | −1.28 (0.200) |
| 5+ | 0.65 (0.29, 1.45) | −1.04 (0.299) | 1.10 (0.48, 2.54) | −1.77 (0.077) |
| Age at first sex (<15) | ||||
| 16–20 | 1.17 (0.90, 1.51) | 0.96 (0.340) | 1.01 (0.67, 1.53) | 1.00 (0.319) |
| 21+ | 0.95 (0.65, 1.38) | −0.17 (0.866) | 1.78 (1.10, 2.89) | 2.93 (0.003) |
| Reports regular exposure to radio, television and newspaper | 1.62 (1.27, 2.07) | 3.44 (0.001) | 1.02 (0.66, 1.58) | 0.07 (0.944) |
| Household | ||||
| Household wealth quintile (1) | ||||
| 2 | 0.89 (0.61, 1.30) | −1.40 (0.162) | n.a. | n.a. |
| 3 | 1.03 (0.69, 1.53) | −0.39 (0.697) | n.a. | n.a. |
| 4 | 1.72 (1.17, 2.54) | 2.72 (0.006) | n.a. | n.a. |
| 5 | 1.52 (1.01, 2.23) | 2.01 (0.044) | n.a. | n.a. |
| Community economics | ||||
| Percentage of men currently employed | 2.45 (0.69, 8.66) | 1.29 (0.196) | 3.37 (1.57, 7.22) | 3.09 (0.002) |
| Percentage of women currently employed | 0.30 (0.13, 0.66) | −3.18 (0.001) | 1.16 (0.56, 2.41) | −0.12 (0.903) |
| Percentage of men with at least primary education | 6.60 (1.81, 9.23) | 2.20 (0.028) | 1.92 (0.24, 8.05) | 0.92 (0.360) |
| Percentage of women with at least primary education | 0.71 (0.31, 1.65) | −0.58 (0.559) | 0.48 (0.10, 2.21) | −0.85 (0.394) |
| Community behavior & knowledge | ||||
| Mean number of sexual partners for men in previous 12 months | 1.09 (0.85, 1.39) | 0.57 (0.571) | 1.35 (1.01, 1.85) | 3.12 (0.001) |
| Percentage of men using a condom at last intercourse | 0.93 (0.44, 1.94) | −0.34 (0.734) | 1.26 (0.51, 3.13) | −0.47 (0.636) |
| Percentage of men who know 3 ways to avoid HIV infection | 3.58 (1.40, 5.56) | 1.98 (0.047) | 0.28 (0.34, 2.31) | −1.70 (0.089) |
| Percentage of women who know 3 ways to avoid HIV infection | 7.06 (1.10, 12.2) | 1.86 (0.049) | 2.09 (1.09, 7.54) | 3.10 (0.002) |
| Mean score for men on attitudes towards violence against women | 0.74 (0.58, 0.94) | −2.23 (0.026) | 1.04 (0.75, 1.40) | 0.56 (0.576) |
| Mean score for men on attitudes towards male roles | 0.86 (0.75, 0.98) | −2.33 (0.020) | 0.96 (0.79, 1.17) | −0.47 (0.636) |
| Community demographics | ||||
| Mean age at marriage for women | 0.90 (0.78, 1.04) | −1.01 (0.313) | 0.83 (0.66, 1.03) | −1.21 (0.226) |
| Mean age at first birth for women | 1.23 (1.06, 1.42) | 2.29 (0.022) | 1.44 (1.08, 1.92) | 2.65 (0.008) |
| Community level random intercept | 0.59 (0.15) | 0.37 (0.15) | ||
| Chad |
Nigeria |
|||
|---|---|---|---|---|
| OR (95 %CI) | z (P > z) | OR (95 %CI) | z (P > z) | |
| Individual | ||||
| Age (15–19) | ||||
| 20–24 | 0.50 (0.03, 4.51) | −0.52 (0.605) | 1.07 (0.65, 1.78) | −1.69 (0.092) |
| 25–29 | 1.32 (0.11, 4.51) | 0.23 (0.822) | 0.99 (0.58, 1.69) | −1.50 (0.134) |
| 30–34 | 1.40 (0.11, 3.79) | 0.26 (0.791) | 0.73 (0.40, 1.34) | −1.81 (0.070) |
| 35–39 | 2.69 (0.20, 4.21) | 0.75 (0.451) | 1.17 (0.61, 2.24) | −1.24 (0.216) |
| 40+ | 1.12 (0.54, 3.14) | 0.10 (0.919) | 0.81 (0.42, 1.56) | −1.60 (0.111) |
| Resident in a rural area | 0.19 (0.05, 0.70) | −2.49 (0.013) | 0.92 (0.69, 1.54) | −0.59 (0.555) |
| Education (none) | ||||
| Primary | 2.46 (0.60, 6.69) | 1.79 (0.074) | 0.99 (0.63, 1.54) | 1.08 (0.280) |
| Secondary | 4.51 (1.69, 9.12) | 2.79 (0.005) | 1.33 (0.82. 2.12) | 1.60 (0.109) |
| Higher | 6.70 (3.08, 9.42) | 4.16 (0.000) | 3.68 (2.18, 6.23) | 5.27 (0.000) |
| Number of living children (none) | ||||
| 1–2 | 0.49 (0.23, 0.73) | −2.66 (0.008) | 0.66 (0.44, 1.23) | −1.30 (0.192) |
| 3–4 | 0.97 (0.43, 2.18) | −1.06 (0.291) | 1.11 (0.70, 1.77) | 0.38 (0.703) |
| 5+ | 0.51 (0.21, 2.17) | −1.92 (0.055) | 1.05 (0.64, 1.70) | 0.20 (0.840) |
| Age at first sex (<15) | ||||
| 16–20 | 0.90 (0.53, 1.52) | −0.08 (0.935) | 1.02 (0.71, 1.45) | 1.42 (0.156) |
| 21+ | 0.39 (0.18, 0.89) | −2.20 (0.028) | 0.91 (0.61, 1.34) | 0.42 (0.678) |
| Reports regular exposure to radio, television and newspaper | 1.84 (0.92, 3.66) | 0.66 (0.511) | 2.03 (1.48, 2.79) | 3.02 (0.003) |
| Household | ||||
| Household wealth quintile (1) | ||||
| 2 | n.a. | n.a. | 1.79 (1.16, 2.79) | 2.24 (0.025) |
| 3 | n.a. | n.a. | 1.70 (1.10, 2.63) | 1.36 (0.017) |
| 4 | n.a. | n.a. | 1.26 (0.78, 2.03) | −0.26 (0.798) |
| 5 | n.a. | n.a. | 1.43 (0.84, 2.42) | −0.06 (0.954) |
| Community economics | ||||
| Percentage of men currently employed | 0.67 (0.13, 3.52) | −1.74 (0.082) | 3.07 (1.21, 7.79) | 2.36 (0.018) |
| Percentage of women currently employed | 0.64 (0.17, 2.32) | −0.79 (0.429) | 0.93 (0.50, 1.74) | −0.11 (0.909) |
| Percentage of men with at least primary education | 4.76 (1.06, 9.51) | 2.30 (0.021) | 1.40 (0.66, 3.00) | −0.03 (0.975) |
| Percentage of women with at least primary education | 0.46 (0.12, 1.69) | −1.62 (0.106) | 0.54 (0.26, 1.11) | −1.81 (0.077) |
| Community behavior & knowledge | ||||
| Mean number of sexual partners for men in previous 12 months | 0.92 (0.72, 1.18) | −0.12 (0.907) | 1.42 (1.21, 1.67) | 3.02 (0.003) |
| Percentage of men using a condom at last intercourse | 1.78 (0.33, 8.54) | 0.20 (0.842) | 0.75 (0.38, 1.47) | 0.23 (0.820) |
| Percentage of men who know 3 ways to avoid HIV infection | 4.32 (1.23, 6.12) | 2.31 (0.001) | 0.34 (0.07, 1.10) | −0.65 (0.514) |
| Percentage of women who know 3 ways to avoid HIV infection | 1.07 (0.20, 5.60) | 0.12 (0.906) | 2.46 (1.25, 4.83) | 3.12 (0.002) |
| Mean score for men on attitudes towards violence against women | - | - | 1.42 (1.14, 1.77) | −2.41 (0.016) |
| Mean score for men on attitudes towards male roles | - | - | 0.78 (0.67, 0.90) | 3.14 (0.002) |
| Community demographics | ||||
| Mean age at marriage for women | 0.91 (0.63, 1.30) | −15.51 (0.132) | 1.09 (0.98, 1.22) | −0.26 (0.798) |
| Mean age at first birth for women | 1.21 (0.88, 1.68) | 1.34 (0.180) | 0.84 (0.74, 1.95) | −0.06 (0.954) |
| Sigma mu (SE) | ||||
| Community level random intercept | 0.77 (0.28) | 0.59 (0.17) | ||
| Ghana |
Zimbabwe |
|||
|---|---|---|---|---|
| OR (95 %CI) | z (P > z) | OR (95 %CI) | z (P > z) | |
| Individual | ||||
| Age (15–19) | ||||
| 20–24 | 3.21 (1.13, 6.12) | 3.12 (0.000) | 0.63 (0.12, 3.24) | −0.55 (0.585) |
| 25–29 | - | - | 0.77 (0.15, 3.93) | −0.31 (0760) |
| 30–34 | - | - | 0.65 (0.12, 3.34) | −0.51 (0.610) |
| 35–39 | 4.21 (1.42, 7.12) | 2.99 (0.000) | 0.64 (0.12, 3.24) | −0.52 (0.600) |
| 40+ | 3.08 (1.12, 5.14) | 2.89 (0.000) | 0.66 (0.12, 3.41) | −0.49 (0.621) |
| Resident in a rural area | 0.94 (0.77, 1.15) | −1.75 (0.081) | 0.85 (0.67, 1.09) | −1.11 (0.266) |
| Education (None) | ||||
| Primary | 2.36 (1.09, 5.35) | 2.05 (0.040) | 1.99 (0.88, 4.49) | 1.65 (0.098) |
| Secondary | 1.78 (0.85, 3.74) | 1.54 (0.125) | 3.38 (1.49, 7.67) | 2.59 (0.010) |
| Higher | 2.05 (1.06, 3.96) | 2.29 (0.022) | 5.94 (2.54, 9.65) | 3.50 (0.000) |
| Number of living children (None) | ||||
| 1–2 | 0.89 (0.34, 2.37) | −0.21 (0.830) | 1.09 (0.88, 1.35) | 0.55 (0.583) |
| 3–4 | 0.98 (0.36, 2.64) | 0.03 (0.977) | 1.09 (0.83, 1.44) | 0.52 (0.603) |
| 5+ | 0.72 (0.26, 1.98) | −0.62 (0.536) | 1.25 (0.90, 1.73) | 0.96 (0.339) |
| Age at first sex (<15) | ||||
| 16–20 | 1.09 (0.66, 1.80) | 0.54 (0.592) | 0.94 (0.74, 1.19) | 0.42 (0.674) |
| 21+ | 1.44 (0.85, 2.43) | 1.27 (0.204) | 1.11 (0.86, 1.44) | 1.12 (0.264) |
| Reports regular exposure to radio, television and newspaper | 2.34 (1.48, 3.69) | 2.63 (0.008) | 1.20 (1.02, 1.44) | 1.83 (0.004) |
| Household | ||||
| Household wealth quintile (1) | ||||
| 2 | 1.01 (0.53, 1.87) | −0.00 (0.997) | 1.26 (0.95, 1.66) | 1.76 (0.078) |
| 3 | 1.59 (0.86, 2.93) | 0.81 (0.418) | 1.47 (1.10, 1.96) | 3.05 (0.002) |
| 4 | 1.84 (0.92, 3.68) | 1.75 (0.081) | 1.51 (1.10, 2.16) | 2.90 (0.004) |
| 5 | 3.37 (1.62, 7.02) | 2.69 (0.007) | 2.20 (1.52, 3.19) | 4.27 (0.000) |
| Community economics | ||||
| Percentage of men currently employed | 0.74 (0.24, 2.15) | −0.92 (0.356) | 1.21 (0.83, 1.77) | 1.23 (0.219) |
| Percentage of women currently employed | 1.02 (0.33, 3.13) | 0.95 (0.341) | 0.70 (0.48, 0.87) | −2.55 (0.011) |
| Percentage of men with at least primary education | 1.12 (0.37, 3.37) | −0.64 (0.524) | 0.53 (0.12, 2.12) | −1.09 (0.276) |
| Percentage of women with at least primary education | 0.59 (0.23, 1.53) | −0.72 (0.474) | 0.99 (0.28, 3.50) | 0.43 (0.667) |
| Community behavior & knowledge | ||||
| Mean number of sexual partners for men in previous 12 months | 1.27 (0.75, 2.17) | 1.43 (0.153) | 1.61 (1.05, 2.45) | 2.22 (0.027) |
| Percentage of men using a condom at last intercourse | 0.61 (0.22, 1.67) | −0.70 (0.483) | 1.10 (0.58, 2.06) | 0.28 (0.777) |
| Percentage of men who know 3 ways to avoid HIV infection | 1.72 (0.57, 6.32) | 0.79 (0.432) | 1.57 (1.12, 3.52) | 2.09 (0.036) |
| Percentage of women who know 3 ways to avoid HIV infection | 2.11 (0.47, 5.23) | 1.58 (0.115) | 1.07 (0.39, 2.94) | 0.62 (0.537) |
| Mean score for men on attitudes towards violence against women | 1.12 (0.73, 1.73) | 0.03 (0.975) | 1.32 (1.02, 1.74) | 0.92 (0.306) |
| Mean score for men on attitudes towards male roles | 1.21 (0.93, 1.57) | 0.26 (0.792) | 0.87 (0.71, 1.07) | −0.42 (0.672) |
| Community demographics | ||||
| Mean age at marriage for women | 0.90 (0.80, 0.99) | 1.45 (0.021) | 0.97 (0.89, 1.05) | −1.61 (0.108) |
| Mean age at first birth for women | 1.07 (0.94, 1.22) | 0.57 (0.565) | 1.10 (0.92, 1.12) | 0.94 (0.347) |
| Sigma mu (SE) | ||||
| Community level random intercept | 0.70 (0.19) | 0.25 (0.12) | ||
Community Economics
Men were significantly more likely to report testing in communities where a larger percentage of men were currently employed (Zambia OR 3.37 (1.57, 7.22) z(P > z) 3.09 (0.002) and Nigeria OR 3.07 (1.21, 7.79) z (P > z) 2.36 (0.0018))). In turn, men were less likely to report testing in communities where a larger percentage of women were employed (Uganda OR 0.30 (0.13, 0.66) z (P > z) −3.18 (0.001) and Zimbabwe OR 0.70 (0.48, 0.87) z(P > z) −2.55 (0.011)). In communities that had a greater proportion of men with at least primary education, men were more likely to report testing (Uganda OR 6.60 (1.81, 9.23) z (P > z) 2.20 (0.028) and Chad OR 4.76 (1.06, 9.51)) z (P > z) 2.30 (0.021)). Similarly, men in communities with a larger proportion of women with at least primary education were also more likely to report testing (Tanzania OR 4.56 (1.75, 11.80) z (P > z) 2.17 (0.030)).
Community Behavior and Knowledge
The association between mean number of sexual partners for men in the community and testing behavior was mixed across countries. In Zambia, Zimbabwe and Nigeria, men in communities with a higher mean number of sexual partners were more likely to report testing (Zambia OR 1.35 (1.01, 1.85) z (P > z) 3.12 (0.001), Zimbabwe OR 1.61 (1.05, 2.45) z (P > z) 2.22 (0.027) and Nigeria OR 1.42 (1.21, 1.67) z (P > z) 3.02 (0.003)); however, in Malawi and Tanzania a higher number of sexual partners in the community was associated with a decreased likelihood that men would report testing (Malawi OR 0.63 (0.41, 0.99) z (P > z) −1.34 (0.018) and Tanzania OR 0.59 (0.43, 0.81) z (P > z) −2.58 (0.00)). In communities with a larger proportion of men reporting condom use at last sex, men were more likely to report testing (Malawi OR 3.14 (1.51, 6.52) z (P > z) 1.23 (0.012) and Tanzania OR 2.75 (1.34, 5.66) z (P > z) 1.72 (0.045)). At the community level, both men's and women's knowledge of ways to avoid HIV infection were positively associated with reported testing. Men in communities where a greater proportion of men knew three ways to avoid HIV were more likely to report testing (Chad OR 4.32 (1.23, 6.12) z (P > z) 2.3 (0.001) and Uganda OR 3.58 (1.40, 5.56) z (P > z) 1.98 (0.047)), and men in communities where a greater proportion of women knew three ways to avoid HIV were also more likely to report testing (Uganda OR 7.06 (1.10, 12.20) z (P > z) 1.86 (0.049), Zambia OR 2.09 (1.09, 7.54) z (P > z) 3.10 (0.002) and Nigeria OR 2.46 (1.25, 4.83) z (P > z) 3.12 (0.002)). The mean community score of men's attitudes towards violence against women had differing associations with testing in Uganda and Nigeria. In Uganda, men in communities with a higher mean score of justified violence were less likely to report testing (OR 0.74 (0.58, 0.94) z (P > z) −2.23 (0.026)). However, in Nigeria men in communities with a higher mean score of justified violence were more likely to report testing (OR 1.42 (1.14, 1.77) z (P > z) 2.41 (0.016)). Finally, in Uganda and Nigeria the mean score for men on attitudes towards male roles was negatively associated with testing (Uganda OR 0.86 (0.75, 0.98) z (P > z) −2.33 (0.020); Nigeria OR 0.78 (0.67, 0.90) z (P > z) 3.14 (0.002)).
Community Demographics
Men in communities with a higher mean age at marriage for women were less likely to report testing (Ghana OR 0.90 (0.89, 0.99) z (P > z) 1.45 (0.021)). In both Uganda and Zambia a positive association was found between communities where women had a first birth at an older age and men's reported testing (Uganda OR 1.23 (1.06, 1.42) z (P > z) 2.29 (0.022)) and Zambia OR 1.44 (1.08, 1.92) z (P > z) 2.65 (0.008)).
However, after including individual, household, and community level variables in the models, significant PSU level variation was still present; hence there remained unexplained community level variation in men's HIV testing.
Discussion
At the individual level, higher levels of education and media exposure were consistently positively associated with HIV testing, confirming the results found by previous studies, and demonstrating the strong associations between expanded social networks and access to broader information channels and HIV testing behavior [15, 18]. The associations between HIV testing and other individual factors—such as household wealth and parity—had mixed effects across countries. These results coincide with Parkhurst's findings, highlighting the context specific impact of wealth and showing that access to capital may be associated with testing behavior but may not be definitive of ability to seek testing services in all countries [40]. The association between parity and testing showed similarly differential effects across countries emphasizing context specific connections between fertility and desire to know serostatus.
At the community level, several factors were associated with reporting of ever having been tested for HIV and receipt of the results among married men; however, the strength of association and directionality of the association differed across the study countries. In contexts where a greater proportion of men have at least a primary education, men may have greater access to health knowledge and increased exposure to broader social networks, facilitating access to HIV testing services. Specifically, men may be more likely to be familiar with the benefits of testing and available treatment options [18]. The results of this study suggest that in communities where a greater proportion of men were currently employed, men were more likely to have received an HIV test; these results agree with the findings of previous studies showing a connection between employment and testing among men [16, 24], again likely explained by the increased social and economic access to HIV testing afforded to men with access to economic capital and social networks. Women's employment at the community level, however, was negatively associated with uptake of testing among men (although only in Uganda and Zimbabwe). As demonstrated by Greig and Koopman, women's employment and economic independence are associated with increased empowerment surrounding sexual health issues, stressing a potential shift in power dynamics within couples and possibly causing men to be concerned about disclosing their serostatus [38, 41, 42]. Alternatively, this result could also be evidence of greater economic hardship and lower socio-economic status—if women whose traditional roles are in the home are forced to work through economic hardship—limiting men's access to care.
Measures of HIV knowledge at the community level for men and women were positively associated with testing among men, demonstrating an association between correct knowledge of HIV and HIV testing rates, stressing the importance of providing health education to both men and women. The results of this study are in line with previous studies that have found similarly strong associations between knowledge of HIV and the benefits of testing and receipt of an HIV test [15, 16, 18]. However, this study demonstrates that it is not only individual level knowledge that influences testing behavior, but also the general level of HIV knowledge in a community that shapes testing uptake. Men residing in communities in which a higher percentage of men report using condoms at last sex were more likely to report HIV testing. With cross-sectional data the directionality of this association cannot be determined. It is possible that increased knowledge in the community, the product of prevention messaging, may have led to increases in HIV testing. It is also possible that programmatic efforts to increase HIV testing may have had a resultant impact on knowledge of HIV and safer sexual practices, as knowledge and prevention advice are dissemination through HIV testing and counseling sessions.
In Nigeria men there was a strong positive association between HIV testing and living in a community with a greater tolerance for violence against women, while in Uganda there was a strong negative association, again, drawing attention to the role of gender power norms and highlighting context specific associations between intimate partner violence and HIV status [20, 21]. Similarly, men in Uganda residing in a community with more conservative norms around male roles were less likely to get tested. For men in Uganda and Zambia, living a community with a higher mean age at first birth for women was associated with a greater likelihood of getting tested. When women delay childbearing they may have more opportunities for economic and social advancement which in turn may reflect greater gender equity and less social pressure on men to adhere to more traditional gender roles [43]. However, in Ghana, men residing in communities with a higher mean age at marriage for women were also less likely to get tested.
There are several limitations to this work. First, the DHS data are cross-sectional, and this the analysis can only identify associations, and does not suggest causality between community domains and HIV testing behavior. A further limitation of this study is the conceptualization of community and the use of proxy community level variables. For this analysis, PSUs were used as surrogates for the individual's community; this geographic representation of community may not represent how the individual views community or what the social dynamic of the community is in its entirety, the analysis is essentially using artificially created units, created for enumeration purposes, to represent communities. It is not clear how these units represent individual's lived realities of community boundaries. Using PSUs as approximations for communities, however, allows for the estimation of community level effects on testing behavior in the absence of more focused efforts to collect community level data, and it must be clear when interpreting these results that these are only approximations of communities. However, the analysis avoids the ecologic fallacy, in which the aggregate characteristics of the group are assumed to represent the individuals: the community variables used here are created by aggregating the data for others living in the PSU, minus the individual respondent, hence community variables are conceptualized as the mean of others who live in the same community as the respondent.
This study did not control for health infrastructure level variables. Some evidence suggests that men are influenced in their uptake of testing by the facilities available to them and feel uncomfortable approaching traditionally female spaces for testing services (such as antenatal care clinics for couples testing). Therefore, it is possible that including information regarding health services in the community would have helped to explain the remaining variance in the models. This analysis defined the outcome of HIV testing as having ever been tested and received the results. While this captures the overall prevalence of men who know their serostatus, it does not describe factors associated with repeat testing. As awareness and acceptability of HIV testing increases and coverage testing services grows, testing campaigns should also encourage repeat testing and studies should track successful methods of normalizing testing and integrating it into more routine services for men. Additionally, the analysis relies upon self-reported data; in contexts of high HIV stigma, or where that has been recent programmatic effort to increase HIV testing, there may be social desirability bias to over or under report testing behavior.
The DHS data analyzed here was collected between 2003 and 2006, and it is possible that since this time HIV testing rates may have increased considerably in some of the study countries. The analysis must thus be viewed in it historical context, and the associations identified here may no longer be present. However, despite these limitations, the use of DHS data provides an unparalleled opportunity to examine community influences on HIV testing using standardized community indicators collected from nationally representative samples.
Conclusions
The community level factors associated with HIV testing varied across the eight countries included in this analysis and contribute to a new understanding of factors shaping men's testing behavior. As heterosexual adults continue to be the most at-risk group for HIV infection in parts of Sub-Saharan Africa and HIV testing rates are persistently higher among women, focusing on investigating determinants of uptake of testing among men is a critical part of supporting men's sexual health and preventing HIV transmission. Previously, HIV prevention interventions have partnered with existing health services delivery, such as antenatal care, effectively prioritizing women for testing and treatment. Evidence suggests that men hesitate to approach women-centered facilities for testing making the need for more tailored approaches to engaging men in testing campaigns necessary [38]. The results of this study demonstrate the range of factors associated with men's testing behavior and highlight regional differences that should be considered in planning and implementing interventions aimed at increasing men's uptake of HIV testing. Specifically, the results point to several potent community elements that may be harnessed in developing effective HIV testing campaigns for married men in these settings, for example, targeting testing programs towards those communities which currently do not share the characteristics associated with increased testing. However, further work is required to disentangle the causal pathways for the associations found here. For example, identifying the pathways between community levels of education and employment and HIV testing among married men, which we hypothesize, operate through expanded social networks and economic capital, and exploring how this information can be used to create targeted messaging to increase HIV testing among married men in resource-poor settings.
Acknowledgments
This research was funded by the National Institute of Child Health and Human Development, grant number 1R03HD053226-01A1.
References
- 1.WHO . Towards universal access: scaling up priority HIV/AIDS interventions in the health sector, progress report 2009. World Health Organization; Geneva, Switzerland: 2009. [Google Scholar]
- 2.Boxall EH, Smith N. Antenatal screening for HIV; are those who refuse testing at higher risk than those who accept testing? J Public Health (Oxf) 2004;26(3):285–7. doi: 10.1093/pubmed/fdh148. [DOI] [PubMed] [Google Scholar]
- 3.Cartoux M, Meda N, Van de Perre P, Newell ML, de Vincenzi I, Dabis F. Acceptability of voluntary HIV testing by pregnant women in developing countries: an international survey. Ghent International Working Group on Mother-to-Child Transmission of HIV. AIDS. 1998;12(18):2489–93. doi: 10.1097/00002030-199818000-00019. [DOI] [PMC free article] [PubMed] [Google Scholar]
- 4.Jereni BH, Muula AS. Availability of supplies and motivations for accessing voluntary HIV counseling and testing services in Blantyre, Malawi. BMC Health Serv Res. 2008;8:17. doi: 10.1186/1472-6963-8-17. [DOI] [PMC free article] [PubMed] [Google Scholar]
- 5.Smith DJ. Modern marriage, men's extramarital sex, and HIV risk in southeastern Nigeria. Am J Public Health. 2007;97(6):997–1005. doi: 10.2105/AJPH.2006.088583. [DOI] [PMC free article] [PubMed] [Google Scholar]
- 6.Dunkle KL, Stephenson R, Karita E, Chomba E, Kayitenkore K, Vwalika C, et al. New heterosexually transmitted HIV infections in married or cohabiting couples in urban Zambia and Rwanda: an analysis of survey and clinical data. Lancet. 2008;371(9631):2183–91. doi: 10.1016/S0140-6736(08)60953-8. [DOI] [PubMed] [Google Scholar]
- 7.Pulerwitz J, Izazola-Licea JA, Gortmaker SL. Extrarelational sex among Mexican men and their partners' risk of HIV and other sexually transmitted diseases. Am J Public Health. 2001;91(10):1650–2. doi: 10.2105/ajph.91.10.1650. [DOI] [PMC free article] [PubMed] [Google Scholar]
- 8.Amaro H. Love, sex, and power. Considering women's realities in HIV prevention. Am Psychol. 1995;50(6):437–47. doi: 10.1037//0003-066x.50.6.437. [DOI] [PubMed] [Google Scholar]
- 9.Corbett EL, Dauya E, Matambo R, Cheung YB, Makamure B, Bassett MT, et al. Uptake of workplace HIV counselling and testing: a cluster-randomised trial in Zimbabwe. PLoS Med. 2006;3(7):e238. doi: 10.1371/journal.pmed.0030238. [DOI] [PMC free article] [PubMed] [Google Scholar]
- 10.Mugisha E, van Rensburg GH, Potgieter E. Factors influencing utilization of voluntary counseling and testing service in Kasenyi fishing community in Uganda. J Assoc Nurses AIDS Care. 2010;21(6):503–11. doi: 10.1016/j.jana.2010.02.005. [DOI] [PubMed] [Google Scholar]
- 11.Castle S. Doubting the existence of AIDS: a barrier to voluntary HIV testing and counselling in urban Mali. Health Policy Plan. 2003;18(2):146–55. doi: 10.1093/heapol/czg019. [DOI] [PubMed] [Google Scholar]
- 12.Morin SF, Khumalo-Sakutukwa G, Charlebois ED, Routh J, Fritz K, Lane T, et al. Removing barriers to knowing HIV status: same-day mobile HIV testing in Zimbabwe. J Acquir Immune Defic Syndr. 2006;41(2):218–24. doi: 10.1097/01.qai.0000179455.01068.ab. [DOI] [PubMed] [Google Scholar]
- 13.Creek TL, Ntumy R, Seipone K, Smith M, Mogodi M, Smit M, et al. Successful introduction of routine opt-out HIV testing in antenatal care in Botswana. J Acquir Immune Defic Syndr. 2007;45(1):102–7. doi: 10.1097/QAI.0b013e318047df88. [DOI] [PubMed] [Google Scholar]
- 14.Rennie S, Behets F. Desperately seeking targets: the ethics of routine HIV testing in low-income countries. Bull World Health Organ. 2006;84(1):52–7. doi: 10.2471/blt.05.025536. [DOI] [PMC free article] [PubMed] [Google Scholar]
- 15.Mbago MC. Socio-demographic correlates of desire for HIV testing in Tanzania. Sex Health. 2004;1(1):13–21. doi: 10.1071/sh03010. [DOI] [PubMed] [Google Scholar]
- 16.Peltzer K, Matseke G, Mzolo T, Majaja M. Determinants of knowledge of HIV status in South Africa: results from a population-based HIV survey. BMC Public Health. 2009;9:174. doi: 10.1186/1471-2458-9-174. [DOI] [PMC free article] [PubMed] [Google Scholar]
- 17.Venkatesh KK, Madiba P, De Bruyn G, Lurie MN, Coates TJ, Gray GE. Who gets tested for HIV in a South African urban township? Implications for test and treat and gender-based prevention interventions. J Acquir Immune Defic Syndr. 2011;56(2):151–65. doi: 10.1097/QAI.0b013e318202c82c. [DOI] [PMC free article] [PubMed] [Google Scholar]
- 18.Ayenew A, Leykun A, Colebunders R, Deribew A. Predictors of HIV testing among patients with tuberculosis in North West Ethiopia: a case-control study. PLoS ONE. 2010;5(3):e9702. doi: 10.1371/journal.pone.0009702. [DOI] [PMC free article] [PubMed] [Google Scholar]
- 19.Weiser SD, Heisler M, Leiter K, Percy-de Korte F, Tlou S, DeMonner S, et al. Routine HIV testing in Botswana: a population-based study on attitudes, practices, and human rights concerns. PLoS Med. 2006;3(7):e261. doi: 10.1371/journal.pmed.0030261. [DOI] [PMC free article] [PubMed] [Google Scholar]
- 20.Jewkes R, Dunkle K, Nduna M, Levin J, Jama N, Khuzwayo N, et al. Factors associated with HIV sero-status in young rural South African women: connections between intimate partner violence and HIV. Int J Epidemiol. 2006;35(6):1461–8. doi: 10.1093/ije/dyl218. [DOI] [PubMed] [Google Scholar]
- 21.Maman S, Mbwambo JK, Hogan NM, Weiss E, Kilonzo GP, Sweat MD. High rates and positive outcomes of HIV-serostatus disclosure to sexual partners: reasons for cautious optimism from a voluntary counseling and testing clinic in Dar es Salaam, Tanzania. AIDS Behav. 2003;7(4):373–82. doi: 10.1023/b:aibe.0000004729.89102.d4. [DOI] [PubMed] [Google Scholar]
- 22.Kalichman SC, Simbayi LC. HIV testing attitudes, AIDS stigma, and voluntary HIV counselling and testing in a black township in Cape Town, South Africa. Sex Transm Infect. 2003;79(6):442–7. doi: 10.1136/sti.79.6.442. [DOI] [PMC free article] [PubMed] [Google Scholar]
- 23.Obermeyer CM, Osborn M. The utilization of testing and counseling for HIV: a review of the social and behavioral evidence. Am J Public Health. 2007;97(10):1762–74. doi: 10.2105/AJPH.2006.096263. [DOI] [PMC free article] [PubMed] [Google Scholar]
- 24.Bwambale FM, Ssali SN, Byaruhanga S, Kalyango JN, Karamagi CA. Voluntary HIV counselling and testing among men in rural western Uganda: implications for HIV prevention. BMC Public Health. 2008;8:263. doi: 10.1186/1471-2458-8-263. [DOI] [PMC free article] [PubMed] [Google Scholar]
- 25.Diez-Roux A. Investigating neighborhood and area effects on health. Am J Public Health. 2001;91(11):1783–9. doi: 10.2105/ajph.91.11.1783. [DOI] [PMC free article] [PubMed] [Google Scholar]
- 26.Diez-Roux AV. Bringing context back into epidemiology: variables and fallacies in multilevel analysis. Am J Public Health. 1998;88(2):216–22. doi: 10.2105/ajph.88.2.216. [DOI] [PMC free article] [PubMed] [Google Scholar]
- 27.Duncan C, Jones K, Moon G. Context, composition and heterogeneity: using multilevel models in health research. Soc Sci Med. 1998;46(1):97–117. doi: 10.1016/s0277-9536(97)00148-2. [DOI] [PubMed] [Google Scholar]
- 28.DiPrete TA, Forristal JD. Multilevel models: methods and substance. Ann Rev Sociol. 1994;20:331–57. [Google Scholar]
- 29.Hutchinson PL, Mahlalela X, Yukich J. Mass media, stigma, and disclosure of HIV test results: multilevel analysis in the Eastern Cape, South Africa. AIDS Educ Prev. 2007;19(6):489–510. doi: 10.1521/aeap.2007.19.6.489. [DOI] [PubMed] [Google Scholar]
- 30.Kranzer K, McGrath N, Saul J, Crampin AC, Jahn A, Malema S, et al. Individual, household and community factors associated with HIV test refusal in rural Malawi. Trop Med Int Health. 2008;13(11):1341–50. doi: 10.1111/j.1365-3156.2008.02148.x. [DOI] [PubMed] [Google Scholar]
- 31.Beaudoin CE. HIV prevention in sub-Saharan Africa: a multilevel analysis of message frames and their social determinants. Health Promot Int. 2007;22(3):198–206. doi: 10.1093/heapro/dam019. [DOI] [PubMed] [Google Scholar]
- 32.Gabrysch S, Edwards T, Glynn JR. The role of context: neighbourhood characteristics strongly influence HIV risk in young women in Ndola, Zambia. Trop Med Int Health. 2008;13(2):162–70. doi: 10.1111/j.1365-3156.2007.01986.x. [DOI] [PubMed] [Google Scholar]
- 33.Msisha WM, Kapiga SH, Earls FJ, Subramanian SV. Place matters: multilevel investigation of HIV distribution in Tanzania. AIDS. 2008;22(6):741–8. doi: 10.1097/QAD.0b013e3282f3947f. [DOI] [PMC free article] [PubMed] [Google Scholar]
- 34.Johns MM, Bauermeister JA, Zimmerman MA. Individual and neighborhood correlates of HIV testing among african american youth transitioning from adolescence into young adulthood. AIDS Educ Prev. 2010;22(6):509–22. doi: 10.1521/aeap.2010.22.6.509. [DOI] [PMC free article] [PubMed] [Google Scholar]
- 35.Babalola S. Readiness for HIV testing among young people in northern Nigeria: the roles of social norm and perceived stigma. AIDS Behav. 2007;11(5):759–69. doi: 10.1007/s10461-006-9189-0. [DOI] [PubMed] [Google Scholar]
- 36.Guo G, Zhao H. Multilevel modeling for binary data. Annual Review of Sociology. 2000;26:441–62. [Google Scholar]
- 37.Pickett KE, Pearl M. Multilevel analyses of neighbourhood socioeconomic context and health outcomes: a critical review. J Epidemiol Community Health. 2001;55:111–22. doi: 10.1136/jech.55.2.111. [DOI] [PMC free article] [PubMed] [Google Scholar]
- 38.Wyrod R. Masculinity and the persistence of AIDS stigma. Cult Health Sex. 2011;13(4):443–56. doi: 10.1080/13691058.2010.542565. [DOI] [PMC free article] [PubMed] [Google Scholar]
- 39.Townsend L, Jewkes R, Mathews C, Johnston LG, Flisher AJ, Zembe Y, et al. HIV risk behaviours and their relationship to intimate partner violence (IPV) among men who have multiple female sexual partners in Cape Town, South Africa. AIDS Behav. 2011;15(1):132–41. doi: 10.1007/s10461-010-9680-5. [DOI] [PubMed] [Google Scholar]
- 40.Parkhurst JO. Understanding the correlations between wealth, poverty and human immunodeficiency virus infection in African countries. Bull World Health Organ. 2010;88(7):519–26. doi: 10.2471/BLT.09.070185. [DOI] [PMC free article] [PubMed] [Google Scholar]
- 41.Greig FE, Koopman C. Multilevel analysis of women's empowerment and HIV prevention: quantitative survey. Results from a preliminary study in Botswana. AIDS Behav. 2003;7(2):195–208. doi: 10.1023/a:1023954526639. [DOI] [PubMed] [Google Scholar]
- 42.Iyaniwura CA, Oloyede O. HIV testing among youths in a Nigerian local population. West Afr J Med. 2006;25(1):27–31. doi: 10.4314/wajm.v25i1.28241. [DOI] [PubMed] [Google Scholar]
- 43.Sarna A, Chersich M, Okal J, Luchters SM, Mandaliya KN, Rutenberg N, et al. Changes in sexual risk taking with antiretroviral treatment: influence of context and gender norms in Mombasa, Kenya. Cult Health Sex. 2009;11(8):783–97. doi: 10.1080/13691050903033423. [DOI] [PubMed] [Google Scholar]