Abstract
microRNAs (miRNAs) are small, functional, non-coding RNAs. miRNAs are transcribed as long primary transcripts (primary precursors) that are processed to the ∼75 nt precursors (pre-miRNAs) by the nuclear enzyme Drosha. The ∼22 nt mature miRNA is processed from the pre-miRNA by the RNase III Dicer. The vast majority of published studies to date have used northern blotting to detect the expression of miRNAs. We describe here a sensitive, high throughput, real-time PCR assay to monitor the expression of miRNA precursors. Gene-specific primers and reverse transcriptase were used to convert the primary precursors and pre-miRNAs to cDNA. The expression of 23 miRNA precursors in six human cancer cell lines was assayed using the PCR assay. The miRNA precursors accumulated to different levels when compared with each other or when a single precursor is compared in the various cell lines. The precursor expression profile of three miRNAs determined by the PCR assay was identical to the mature miRNA expression profile determined by northern blotting. We propose that the PCR assay may be scaled up to include all of the 150+ known human miRNA genes and can easily be adaptable to other organisms such as plants, Caenorhabditis elegans and Drosophila.
INTRODUCTION
microRNAs (miRNAs) are the smallest, functional, non-coding RNAs of plants and animals (1,2). Mature miRNAs are ∼22 nt in length and are cleaved from the ∼75 nt partially duplexed precursor by the RNase III Dicer (3–5). The founding members of this class of genes, lin-4 and let-7, are expressed temporally during development of Caenorhabditis elegans (6–9). lin-4 and let-7 recognize partially complementary sequences within the 3′-untranslated regions of their respective target genes (lin-14, lin-28, hbl-2 and lin-41). Binding of the miRNA to the mRNA results in translational repression of the protein-coding genes (10,11).
miRNAs have been found in C.elegans, Drosophila, plants, mice and humans, suggesting an ancient and widespread role for these non-coding RNAs (12–18). To date, over 700 miRNAs have been discovered, including 106 in C.elegans, 175 in humans and 202 in mice (19). An algorithm termed miRscan was developed to predict the number of miRNAs in a genome based upon the phylogenetically conserved foldback structure of the miRNA (20,21). miRscan predicts the total number of miRNAs in the human genome to be 200–255, or ∼1% of the predicted genes in humans (21).
In addition to regulating development in C.elegans (6–9,17), miRNAs have been shown to negatively regulate the proapoptotic gene hid during Drosophila development (22). Two human miRNAs (miR-15a and miR-16) have been mapped to the region 13q14 that is commonly deleted in chronic lymphocytic leukemia (CLL). The expression of miR-15a and miR-16 was reduced in CLL patients with loss of heterozygosity at 13q14 (23). With the exception of the aforementioned studies and a few others in Drosophila (22,24), plants (25,26) and humans (14,23), very little is known about the targets, function and expression levels of miRNAs.
Most of the miRNA expression data published to date have used northern blotting to detect the miRNA. Northern blotting as a tool to study gene expression is finding less and less use due to the development of more sensitive (e.g. RT–PCR) and high-throughput (e.g. real-time PCR and cDNA micro-array) techniques. An advantage of northern blotting is that it allows one to determine the size of an RNA at the same time that it provides information on the expression level. Probes designed to hybridize to the mature miRNA detected the ∼22 nt mature miRNA and the ∼75 nt pre-miRNA simultaneously on the blot (14,17,18,23,27,28). Since miRNAs are very different from more traditional RNAs, new and different methods are needed to quantify their expression. The goal of this report was to develop, validate and test a high-throughput, real-time PCR method to quantify human miRNA precursors.
MATERIALS AND METHODS
Cell lines and tissue culture
The following human tumor cell lines were obtained from American Type Culture Collection (Manassas, VA). K-562 (chronic myelogenous leukemia), HL-60 (promyelocytic leukemia), LNCaP (prostate cancer), HeLa (cervical adenocarcinoma), HCT-8 (colorectal cancer) and HCT-116 (colorectal cancer). S2 Drosophila cells were purchased from Invitrogen (Carlsbad, CA). All cancer cell lines were cultured in a humidified atmosphere of 95% air, 5% CO2 using RPMI 1640 or other suitable media and 10% fetal bovine serum. S2 cells were cultured at room temperature according to Invitrogen’s protocol.
RNA, DNA extraction and reverse transcription
Total RNA was extracted from the cultured cells using Trizol (Invitrogen, Carlsbad, CA) according to the manufacturer’s protocol. The concentration of total RNA was quantified by the absorbance at 260 nm. Total RNA was briefly exposed to RNase-free DNase I as previously described (29). RNA was reverse transcribed to cDNA using either random hexamers or gene-specific primers and Thermoscript, thermostable reverse transcriptase (Invitrogen). A 1 µg aliquot of DNase-treated total RNA (10.5 µl total volume) was incubated with 1.5 µl of a cocktail containing 10 µM of each of the antisense primers listed in the Supplementary Material available at NAR Online. The reaction was heated to 80°C for 5 min to denature the RNA, then incubated for 5 min at 60°C to anneal the primers. The reactions were cooled to room temperature and the remaining reagents [5× buffer, dNTPs, dithiothreitol (DTT), RNase inhibitor, Thermoscript] were added as specified in the Thermoscript protocol and the reaction proceeded for 45 min at 60°C. Finally, the reverse transcriptase was inactivated by a 5 min incubation at 85°C. For the random hexamer-primed cDNA, RNA plus 0.25 µl of random primers (Invitrogen) was denatured at 80°C for 5 min and cooled to room temperature for 10 min to allow the hexamers to anneal. The additional reagents were then added and the reaction proceeded as described above. The minus reverse transcription controls were treated identically as described above except that the reactions lacked Thermoscript and primers. Genomic DNA was isolated from HeLa cells as previously described (30).
Gene expression in low molecular weight RNA fraction
Total RNA was isolated from HCT-116 cells using Trizol. A 700 µg aliquot of total RNA was loaded to the Midi RNA isolation column (Qiagen, Valencia, CA). Isolation of low molecular weight (LMW) RNA (∼160 nt and less) was achieved following the manufacturer’s protocol, including eluting the LMW RNA using buffer QRW2 [750 mM NaCl, 50 mM MOPS, pH 7.0, 15% (v/v) ethanol]. Total and LMW RNA were resolved on a denaturing 15% polyacrylamide gel to validate the isolation. A 1 µg aliquot of the LMW and total RNA was reverse transcribed to cDNA using Thermoscript and random hexamers or gene-specific primers as described above. The cDNA was assayed by real-time PCR using primers for six different miRNA genes and U6 RNA.
Northern blotting
Northern blotting was performed as previously reported (17). Briefly, total RNA (30 µg) was resolved on 15% polyacrylamide–urea gels and transferred to Genescreen Plus membranes (Perkin Elmer, Boston, MA). Oligo nucleotides complementary to the mature miRNA were end-labeled with [γ-32P]ATP and T4 kinase. The membranes were incubated with labeled probe (1.5 × 10⁶ c.p.m./ml hybridization buffer) prior to visualization using phosphorimaging. Blots were stripped once and re-probed using an oligonucleotide complementary to U6 RNA.
Primer design, PCR and validation
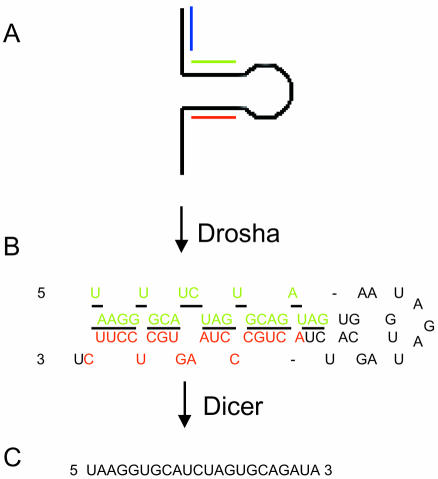
All primers were designed using Primer Express version 2.0 (Applied Biosystems, Foster City, CA). The following criteria were used during the primer design. Both sense and antisense primers were designed to be located within the hairpin sequence of the miRNA precursors (Fig. 1). The pre-miRNA sequences (19) are predicted based upon the fold-back structure (31). The exact sequence for each pre-miRNA is unknown. Mapping the 5′ and 3′ cleavage sites of miR-30a demonstrated that the termini of pre-miR-30a are identical to those of mature 30a and 30a* (32). It was presumed here that all pre-miRNAs are processed from the pri-miRNA in this manner. A maximal extension of 4 nt was allowed for each primer over the presumed 5′ or 3′ termini of the pre-miRNA. Since the hairpin is contained within both the pri-miRNA and the pre-miRNA, primers designed to the hairpin should simultaneously amplify both RNAs. We use the term ‘miRNA precursors’ here to be inclusive of both the pri-miRNA and the pre-miRNA. Primers were designed with a maximal Tm difference between both primers of ≤2°C and a primer length between 18 and 24 nt. An ideal Tm of 55–59°C was selected for the primers; however, due to size constraints, some primers were designed with a Tm that was <55°C. The Tm range of all the pre-miRNA primers was 49–59°C, and the median Tm was 56°C (Supplementary Material). Additional criteria included no 3′ GC clamps, and a minimal amplicon size of 55 bp.
Figure 1.
miRNA processing and primer design. miRNAs such as human miR-18 are transcribed as (A) a large primary precursor (pri-miRNA) that is processed by the nuclear enzyme Drosha to produce (B) the putative 62 nt precursor miRNA (pre-miRNA). Both the pri-miRNA and pre-miRNA contain the hairpin structure. The underlined portion of the pre-miRNA represents the sequence of (C) the 22 nt mature miRNA that is processed from the pre-miRNA by the RNase Dicer. Green, hybridization sequence of the forward primer; red, hybridization sequence of the reverse primer; blue, sense primer used along with the reverse (red) primer to amplify the pri-miRNA only.
PCR amplicons were validated using gel electrophoresis (2.2% agarose or 15% polyacrylamide) and by the presence of one peak on the thermal dissociation curve generated by the thermal denaturing protocol that followed each real-time PCR run (29). The sequences of the miRNA precursor amplicons were determined by subcloning the PCR product generated by amplifying HeLa cell cDNA into TOPO TA cloning vectors (Invitrogen) according to the manufacturer’s protocol. Plasmid purification and automated DNA sequencing of the plasmids were performed using standard techniques.
Real-time quantitative PCR
Real-time quantitative PCR was performed using standard protocols on an Applied Biosystem’s 7900HT Sequence Detection System. Briefly, 5 µl of a 1/100 dilution of cDNA in water was added to 12.5 µl of the 2× SYBR green PCR master mix (Applied Biosystems), 800 nM of each primer and water to 25 µl. The reactions were amplified for 15 s at 95°C and 1 min at 60°C for 40 cycles. The thermal denaturation protocol was run at the end of the PCR to determine the number of products that were present in the reaction (29). All reactions were run in triplicate and included no template and no reverse transcription controls for each gene. The cycle number at which the reaction crossed an arbitrarily placed threshold (CT) was determined for each gene, and the relative amount of each miRNA to U6 RNA was described using the equation 2–ΔCT where ΔCT = (CTmiRNA – CTU6RNA) (33). Relative gene expression was multiplied by 106 in order to simplify the presentation of the data.
Quantification of pri- and pre-miRNAs
PCR using the hairpin primers (Fig. 1) should amplify both the pri-miRNA and pre-miRNA. To amplify only the pri-miRNA, the antisense primer to the hairpin was used along with a new sense primer that was designed to anneal to ∼100 nt 5′ of the pre-miRNA (Fig. 1). PCR using the hairpin primers (red/green, Fig. 1) should amplify the pri-miRNA + pre-miRNA, and PCR using the upstream primer along with the antisense hairpin primer (blue/red, Fig. 1) should amplify only the pri-miRNA. The amount of pre-miRNA was calculated using the equation:
pre-miRNA = 2–CT(pri–miRNA + pre–miRNA) – 2–CTpri–miRNA.
Calculation of PCR efficiency
PCR efficiency was determined as previously described (34) from the equation N = N0 × En, where N is the number of amplified molecules, N0 is the initial number of molecules, n is the number of PCR cycles and E is the efficiency, which is ideally 2. When the equation is of the form n = –(1/log E) × log N0 + (logN/log E), a plot of log copy number versus CT yields a straight line with a slope = –(1/log E) (34). To experimentally determine PCR efficiency, 10-fold dilutions of HeLa cell genomic DNA were diluted over 4-logs. The diluted genomic DNA was amplified by real-time PCR using the identical conditions established for the gene expression analysis. Plots were made of the log of the template concentration versus the CT and the PCR efficiency was calculated from the slope of the line using the equation described above. The actual concentration of the template is not needed when determining the efficiency as it depends only upon the slope of the line.
Treeview analysis of PCR data
The expression of each miRNA relative to U6 RNA was converted to pseudocolors and plotted using the Treeview cluster analysis as previously reported (35–37). Expression that had a value equal to 1 was designated black, expression that was greater than 1 was designated red, and expression that was less than 1 was designated green. Genes with undetectable expression were designated as gray.
RESULTS
Validation of PCR primers
To amplify the miRNA precursors, PCR primers were designed to anneal to the hairpin (Fig. 1). Amplification of short hairpins by the PCR could present a challenge because of the competition between annealing of the primer and reformation of the hairpin. Primers were designed to 23 different pre-miRNA genes using the criteria described in Materials and Methods. Shown in Figure 2 are the products from amplifying HeLa cell genomic DNA using six of the miRNA precursor primers. All six reactions produced amplicons of the expected size with no additional products. All of the primer pairs listed in the Supplementary Material met the criteria of one peak on the thermal dissociation curve and a single band of the correct size on either agarose or polyacrylamide gels. As a further validation, the amplicon from pre-miR-147 was subcloned and sequenced. Comparison of the sequence data verified that 100% of the new sequence was amplified. These results demonstrate our ability to successfully amplify short hairpins using the PCR.
Figure 2.
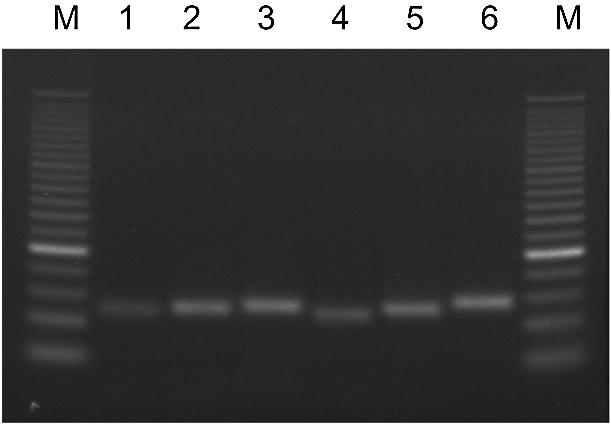
Amplification of short hairpins by the PCR. HeLa cell genomic DNA was amplified by the PCR using primers for miR-124a-2 (lane 1), miR-93-1 (lane 2), let7-d (lane 3), miR-15a (lane 4), miR-16 (lane 5) and miR-147 (lane 6) and resolved on a 2.2% agarose gel. M, 25 bp DNA ladder.
Validation of reverse transcription conditions
Our initial attempts to reverse-transcribe total RNA used random hexamer priming. Real-time PCR of the resulting cDNA using the primers listed in the Supplementary Material produced varied PCR signals in the cell lines tested, i.e. miRNA precursors were expressed at high, intermediate and low levels (data not shown). It later occurred to us that it may be very difficult to prime the pre-miRNA with random hexamers. This is because pre-miRNAs are very short (<80 nt) and the stoichiometry of primer annealing should be much less than that of a primer binding to a larger RNA such as mRNA. Furthermore, a competition exists between the annealing of the random primers to the pre-miRNA and hairpin formation, which is compounded by the low temperatures (25°C) at which random primers are typically annealed. We hypothesized that the PCR signal generated from amplifying cDNA primed with random hexamers was due to amplifying the much longer pri-miRNA and not the pre-miRNA.
To test this hypothesis, a LMW RNA fraction was isolated from total RNA. The LMW RNA fraction contains RNA <160 nt and should separate the pre-miRNA (∼75 nt) from the larger pri-miRNA. Denaturing polyacrylamide gel electrophoresis verified that RNA <160 nt was recovered in the LMW fraction (not shown). Both the LMW and total RNA were primed with random hexamers or gene-specific primers and reverse transcribed using the Thermoscript reverse transcriptase.
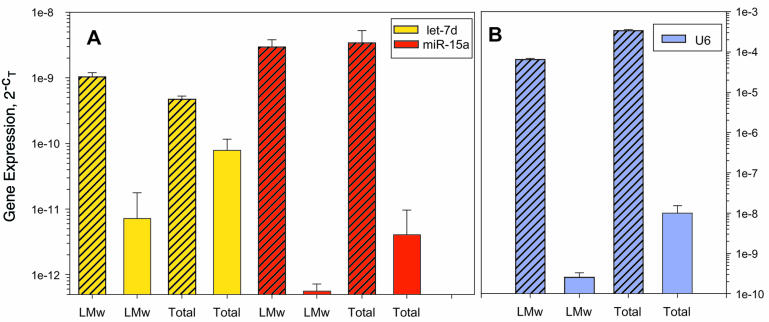
In order to determine the effectiveness of priming the reverse transcriptions, real-time PCR was performed on the cDNA using primers for two miRNAs (let7d and miR-15a) as well as U6 RNA. Total RNA primed with random hexamers produced less cDNA compared with total RNA primed with gene-specific primers (Fig. 3). More LMW RNA was converted to cDNA when primed with gene-specific primers compared with random hexamers (Fig. 3). Even for the 106 nt U6 RNA that does not contain any hairpins, higher yields of cDNA were achieved using the gene-specific priming compared with random hexamers (Fig. 3B). We conclude that reverse transcription proceeds through secondary structure such as hairpins if priming occurs at some point upstream of the hairpin. However, to prime short RNA molecules, in particular small RNAs containing hairpins, gene-specific primers and not random primers should be used.
Figure 3.
Optimal reverse transcription conditions for small RNAs. Total RNA was isolated from HCT-116 cells, a fraction of which was further purified to contain a low molecular weight (LMW) fraction of <160 nt. A 1 µg aliquot of total or LMW RNA was converted to cDNA using Thermoscript reverse transcriptase and random hexamers (open bars) or gene-specific primers (striped bars). The resulting cDNA was amplified by real-time PCR using primers for (A) let7d, miR-15a or (B) U6 RNA. Mean ± SD, triplicate PCRs from a single cDNA.
Intra-assay variation
To evaluate the intra-assay variation of the real-time PCR assay, flasks of HeLa, HCT-116 and HL-60 cells were cultured in triplicate. Total RNA was isolated from the cultures. A 1 µg aliquot of the total RNA was converted to cDNA as described in Materials and Methods. The relative expression of the precursors for miR-18, -107 and -29 was determined using the real-time PCR assay. The mean, standard deviation and coefficient of variation from the triplicate RNA isolations/reverse transcription are shown in Table 1. The coefficient of variation among the different genes and cell lines was quite low, ranging from 1.8 to 34.5%.
Table 1. Intra-assay variation from replicate RNA isolations.
| Cell line | Relative gene expression (×106) | ||
|---|---|---|---|
| miR-18 | miR-107 | miR-29 | |
| HeLa | 40.6 ± 1.12 (2.77 %) | 21.9 ± 0.462 (2.11 %) | 1.28 ± 0.145 (11.3 %) |
| HCT-116 | 24.2 ± 2.02 (8.32 %) | 20.2 ± 0.869 (4.30 %) | 6.40 ± 0.349 (5.45 %) |
| HL-60 | 55.9 ± 3.96 (7.07 %) | 22.3 ± 0.391 (1.75 %) | 0.370 ± 0.128 (34.5%) |
Total RNA was isolated from triplicate samples of HeLa, HCT-116 and HL-60 cells. Each sample of RNA was independently reverse transcribed to cDNA and the expression of miR-18, -107 and -29 (relative to U6 RNA) was determined using real-time PCR. The mean ± SD and coefficient of variation (%) from the replicate RNA isolations/reverse transcriptions are shown.
Real-time PCR of miRNA precursors
An important issue for quantitative PCR is that the efficiency of amplification for each gene in the study (including the internal control) should be very similar and be close to the ideal value of 2. Although amplicon lengths were very similar and all the miRNA genes contained the hairpin, large differences in the Tm existed among the primers (Supplementary Material). PCR efficiency was determined on the U6 RNA as well as six miRNA genes, two with a low Tm (49–53°C), two with an intermediate Tm (55–56°C) and two with a higher Tm (58–59°C). The efficiency of all seven genes was very similar and was close to the ideal value of 2 (Table 2). There was no trend of altered efficiency with Tm in these genes.
Table 2. Efficiency of amplification for miRNA genes and U6 RNA.
| Gene | Tm of primers (°C) (forward/reverse) | PCR efficiency | r2 |
|---|---|---|---|
| miR-147 | 53/53 | 1.89 | 0.9996 |
| miR-29 | 49/51 | 1.93 | 0.9956 |
| miR-107 | 55/56 | 1.90 | 0.9990 |
| miR-27a | 56/56 | 1.96 | 0.9978 |
| miR-124a-2 | 58/58 | 1.93 | 0.9985 |
| miR-219 | 59/59 | 1.97 | 0.9984 |
| U6 | 59/59 | 1.94 | 0.9997 |
The cDNAs of K-562, HL-60, LNCaP, HeLa, HCT-8, HCT-116 and Drosophila S2 cells were amplified by the PCR using primers for 23 miRNA precursors. Moderate to strong PCR signals were generated when cDNA was used as a template for most of the miRNA precursor primers. PCR amplicons were not generated from the S2 cDNA, or in the no template or no reverse transcription controls. In the cases where expression of the miRNA genes was very low (CT ≥35), the primers were validated on HeLa cell genomic DNA. This was done in order to determine if the weak signal generated by amplifying cDNA was due to the primers not working or to the lack of template in the cDNA (i.e. the gene was not expressed).
The reproducibility of real-time PCR tends to become worse when very low copies of template are amplified. For this reason, the following criteria were used to calculate the mean relative gene expression and to distinguish between low and undetectable expression. If three out of three PCRs were above the threshold after 40 cycles and the thermal dissociation profiles of all three reactions matched, the CT of all three plots was used in the relative expression calculation. If two out of three PCRs were above the threshold after 40 cycles and the thermal dissociation plots of the two reactions matched, then the PCR that was below threshold was discarded and the mean of the remaining two was used in the relative expression calculation. If only one or no PCRs out of the three were above threshold after 40 cycles, then the expression of the gene was classified as ‘undetectable’.
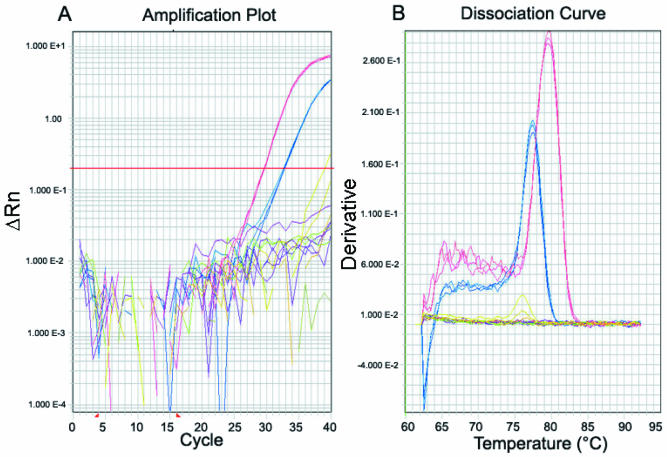
Representative real-time amplification plots of the pre-miRNA are shown in Figure 4. Shown are the PCR plots for miR-21 and let-7d in HCT-8 cDNA (Fig. 4A). Strong signals were generated for both genes when cDNA template was amplified, but not on the no template or no reverse transcription controls. The thermal dissociation curves generated at the end of the real-time PCR run demonstrates that the miR-21 and let-7d primers amplified a single product that was different from the products generated on the negative controls (Fig. 4B). Figure 4 demonstrates how the dissociation curves may be used to distinguish true PCR amplicons from the noise that is often generated by amplifying no template controls or low copies of template.
Figure 4.
Real-time PCR of miRNA precursors. Gene-specific primers were designed to the hairpin of the miR-21 and let-7d miRNA precursors. The cDNA from human cancer cell lines was amplified by real-time PCR and SYBR green detection. (A) Real-time PCR plots of HCT-8 cDNA using miR-21 primers (blue plot, CT = 32.8) and let-7d primers (red plot, CT = 29.7). Also shown are the signals that were generated from the no template control reactions (olive plots) and the no reverse transcription control reactions (purple plots). (B) Dissociation curve generated from the heat dissociation protocol that followed the real-time PCR shown in (A) The presence of one peak on the thermal dissociation plot corresponds to a single amplicon from the PCR. The plot colors in (B) match those described in (A).
Quantification of pri-miRNA and pre-miRNA
All of the miRNA primers listed in the Supplementary Material were designed to anneal to the hairpin of the miRNA precursors (Fig. 1). Since the pre-miRNA is contained within the sequence of the pri-miRNA, it is impossible to perform PCR on the pre-miRNA without amplifying the pri-miRNA as well. Our focus is to quantify the miRNA precursors; quantifying the pri-miRNA and pre-miRNA individually was beyond the scope of the present study. To demonstrate that it is possible to use real-time PCR to quantify the pri-miRNA and the pre-miRNA individually, and to further demonstrate that the assay measures both transcripts, a sense primer (5′ GGGCTTTAAAGTGCAGGG 3′) was designed to the pri-miR-18 (Fig. 1). This primer along with the antisense primer for miR-18 was used to amplify the pri-miR18. Real-time PCR was performed on the cDNA from the six cancer cell lines using primers for the miR-18 precursors and the pri-miR-18.
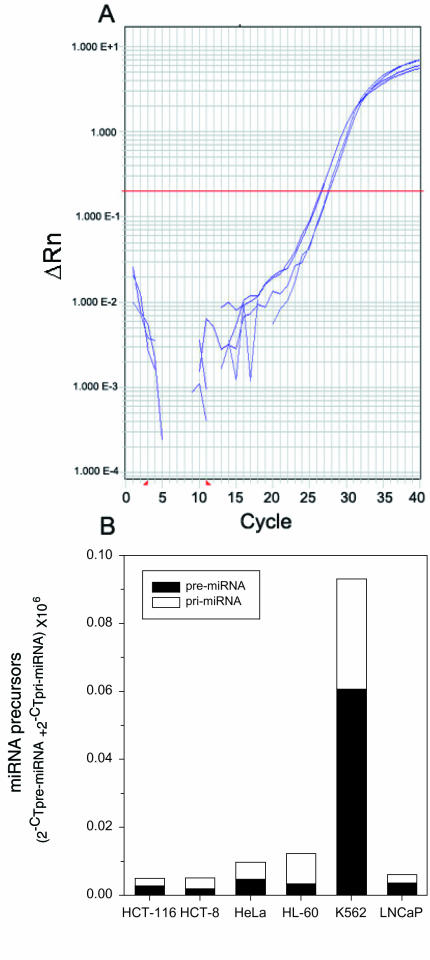
The CT generated from the miR-18 precursors was slightly lower than the CT for the pri-miR-18 (Fig. 5A). Differences in one CT unit in real-time PCR data are typical when detecting a 2-fold difference in template. The amount of pre-miRNA was calculated as described in Materials and Methods. The relative amounts of pre-miR-18, pri-miR-18 and total precursors (pri-miR-18 + pre-miR-18) were determined in each of the six cancer cell lines (Fig. 5B). While more of the miR-18 precursors were expressed in K562 cells, the relative amounts of pri-miR-18 and pre-miR-18 are approximately equal in all six cell lines. This demonstrates that each pri-miRNA is processed to one pre-miRNA molecule and shows that there is no regulation of Drosha processing for miR-18 in these cell lines.
Figure 5.
Pri-miRNA and pre-miRNA expression in human cancer cell lines. (A) Total RNA from HeLa cells was converted to cDNA using gene-specific primers as described in Materials and Methods. The cDNA was amplified by real-time PCR using primers that anneal to the hairpin present in both the pri-miR-18 and pre-miR-18 (CT = 26.6) or to the pri-miRNA only (CT = 27.6). (B) Total miR-18 precursor expression (pri-miRNA + pre-miRNA) and individual expression (pri-miRNA or pre-miRNA) in six cancer cell lines. Mean of duplicate real-time PCRs from a single cDNA sample.
miRNA precursor expression in human cancer cell lines
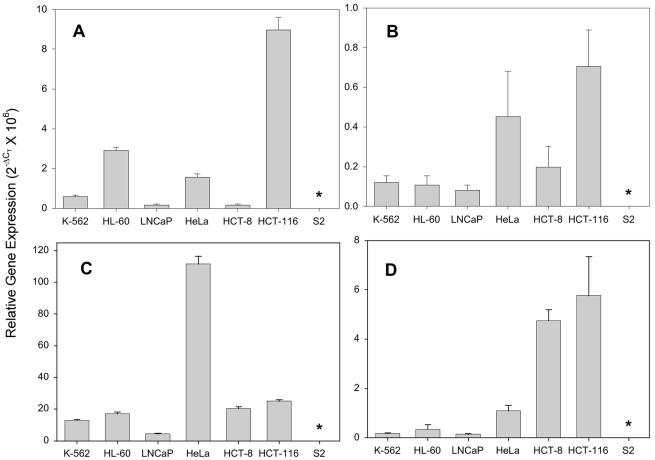
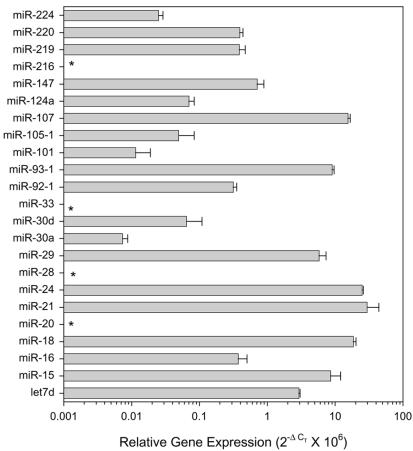
The relative expression of 23 miRNA precursors was determined in six human cancer cell lines. Expression data on four miRNA precursor genes are shown in Figure 6. The expression of miR-93-1 in the HCT-116 colorectal cancer cell line was 50-fold higher than in the HCT-8 colorectal cancer cell line (Fig 6A). miR-24-2 was expressed at relatively constant levels in all of the cell lines except in HeLa cells, which expressed between 5- and 10-fold higher levels (Fig. 6C). The colorectal cancer cell lines and HeLa cells expressed higher levels of miR-29 and miR-147 compared with the blood cancers and prostate cancer cell lines (Fig. 6B and D). The expression of the 23 miRNA precursors varied within a particular cell type such as HCT-116 (Fig. 7). The difference in expression of the miRNA precursors varied >4000-fold within this cell line. miR-21 had the highest level of expression and miR-30a the lowest level. The expression of four miRNAs (miR-20, -28, -33 and -216) was undectectable in HCT-116 cells.
Figure 6.
miRNA precursor expression in human cancer cell lines. The expression of the miRNA precursors for miR-93-1 (A), miR-147 (B), miR-24-2 (C) and miR-29 (D) in six human tumor cell lines and Drosophila S2 cells was determined by real-time PCR. Gene expression is presented relative to U6 RNA. Mean ± SD of triplicate real-time PCRs from a single cDNA sample. *Undectectable expression.
Figure 7.
miRNA precursor expression in the human colorectal cancer cell line HCT-116. The expression of 23 miRNA precursors was determined in the human colorectal cancer cell line HCT-116 by real-time PCR. Gene expression is presented relative to U6 RNA. Mean ± SD of triplicate real-time PCRs from a single cDNA sample. *Undetectable expression.
The relative expression of the miRNA precursors was presented using the Treeview algorithm (Fig. 8). This allowed visualization of large amounts of data in a single figure. The relative gene expression values were multiplied by 106. Median expression was set equal to the value of 1 and was indicated by the color black (Fig. 8). Increased (red), decreased (green) and no expression (gray) were plotted relative to the median value. Although some exceptions existed, miRNA precursor expression across the cell lines was more or less similar (i.e. expression was either high, intermediate, low or undectectable in each of the six cell lines). This type of analysis allows for the easy identification of individual genes with very different expression within the group. For example, HCT-116 and HeLa cells expressed much higher levels of miR-21 than the other cell lines, and miR-224 was undetectable only in HL-60 cells.
Figure 8.
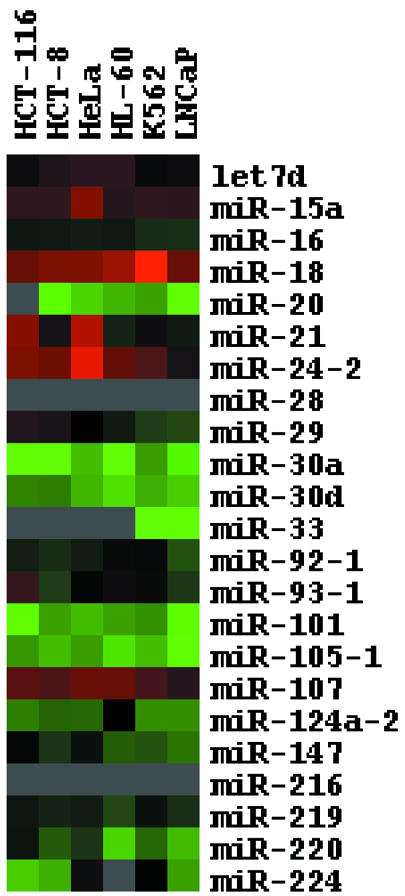
Treeview analysis of real-time PCR data. The expression of 23 miRNA precursors and U6 RNA was determined in six human cancer cell lines by real-time PCR. The relative expression of each gene (mean of triplicate real-time PCRs from a single cDNA sample) was determined as described in Materials and Methods. A median expression value equal to 1 was designated black. Red shading indicates increased levels of expression, and green shading represents decreased levels of expression relative to the median. Gray color denotes undectectable expression. Data are presented on a logarithmic scale.
Validation of real-time PCR results with northern blotting
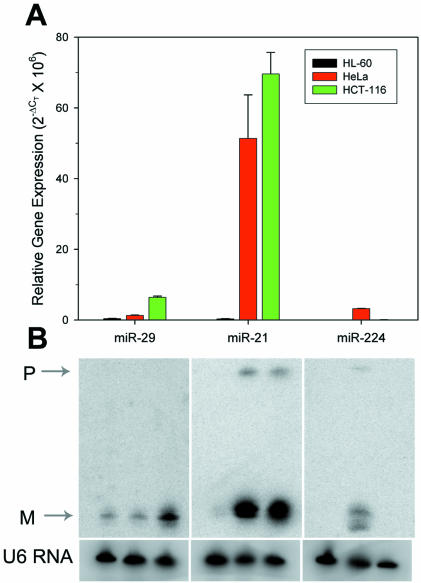
Northern blotting is currently the established method to monitor miRNA expression. In order to validate our real-time PCR data, northern blotting was performed on the total RNA from three different cells lines using probes for miR-29, -21 and -224. miRNAs were selected that demonstrated high expression by our PCR assay and that had diverse expression among the cell lines. The trend in expression between the mature miRNAs as detected by northern blotting and the miRNA precursors as detected by PCR was identical (Fig. 9). The pre-miRNA was visible by northern blotting only for miR-21 (HeLa and HCT-116) and miR-224 (HeLa). While strong amplification was generated on miR-29 (HCT-116), no pre-miRNA band was visible by northern blotting. We were unable to detect any miRNA (mature or precursor) using a probe for miR-220. While northern blots were attempted using probes for only four miRNAs, the lower limit of detection by northern blotting was a relative expression value of 0.25 × 10⁶ by the PCR assay. This suggests that most of the miRNAs labeled as green in Figure 8 would be undetectable by northern blotting in our hands and substantiates the enhanced sensitivity of the PCR compared with northern blotting.
Figure 9.
Validation of real-time PCR data by northern blotting. (A) The precursor expression for miR-29, -21 and -224 relative to U6 RNA was determined by real-time PCR in HL-60, HeLa and HCT-116 cDNA (mean ± SD triplicate RNA isolations/reverse transcriptions). (B) Northern blot of the ∼22 nt mature miRNA and the ∼75 nt pre-miRNA in the same cell lines shown in (A) The blots were stripped and re-probed for U6 RNA. P, pre-miRNA, M, mature miRNA.
DISCUSSION
New methods are needed to monitor the expression of miRNAs. Northern blotting has been used successfully to detect both the mature and pre-miRNAs (7,14,18,23,27). Primer extension was also effectively used to detect the mature miRNA (38). Disadvantages of gel-based assays (northern blotting, primer extension, RNase protection assays, etc.) as tools for monitoring gene expression include low throughput and poor sensitivity. cDNA micro-arrays would appear to be a good alternative to northern blotting to quantify miRNAs since micro-arrays have excellent throughput. Disadvantages of micro-arrays include high concentrations of input target for efficient hybridization and signal generation, poor sensitivity for rare targets, and the necessity for post-array validation using more sensitive assays such as real-time PCR. A recent report used cDNA micro-arrays to monitor the expression of miRNAs during neuronal development (39). A 5–10 µg aliquot of total RNA was used for these arrays in which the mature miRNA was separated from the miRNA precursors using micro concentrators. A PCR approach has also been used to determine the expression levels of mature miRNAs (20,40). This method, while useful to clone miRNAs, is impractical for routine gene expression studies since it involves gel isolation of small RNAs and ligation to linker oligonucleotides.
As an alternative to northern blotting, we developed a real-time PCR assay to quantify the expression of the miRNA precursors. The short hairpins of 23 of 29 genes attempted were successfully converted to cDNA and amplified using standard real-time PCR methods. For this reason, we believe that the assay may be expanded to include most of the >150 known human miRNA precursors and could eventually include all of the predicted 200–250 human miRNA genes once discovered (21). This assay should easily be adaptable to other organisms such as plants, C.elegans and Drosophila. The Applied Biosystems 7900HT sequence detection system used here was equipped with a 96-well block. This instrument is adaptable to a 384-well block that would increase the assay throughput by 4-fold. Therefore, the assay described here could rival the throughput of micro-arrays and could be advantageous compared with micro-arrays due to the increased sensitivity of the PCR. Sensitive PCR assays coupled with methods to capture individual cells such as laser-assisted microdissection can be used to study the cell type regulation/expression of miRNAs in individual cell types.
Presentation of quantitative PCR data using red/green pseudocolors is a relatively recent phenomenon. The only investigator to our knowledge to organize real-time PCR data in such a manner is Dittmer during the development of a genome-wide assay for all of the open reading frames of the Kaposi’s sarcoma herpesvirus (35,36). It is practical to generate and present gene expression data in this manner only if the number of genes of interest in relatively small (<500). However, if the number of genes is relatively small (such as miRNAs), then presentation of real-time PCR data in this manner accomplishes the same result as micro-arrays, including (i) high-throughput analysis of gene expression and (ii) presentation of large amounts of data as pseudocolors to visualize differences in expression levels.
Pre-miRNA is processed to the ∼22 nt mature miRNA by Dicer-like enzymes in all species in which miRNAs have been identified (2,4,5,8,25). The method described here provides quantitative data on the miRNA precursors only and not on the mature miRNA. Using a transcriptional fusion of the let-7 promoter to gfp, it was shown that let-7 is temporally regulated by transcription and not by processing of the pre-miRNA or stability of the mature miRNA (41). In CLL patients and cancer cell lines, 23 of 60 samples showed the ∼70 nt miR-15a precursor that was not found in any normal tissues except bone marrow (23). The expression of Dicer was relatively constant in these patients, suggesting inefficient processing of the miRNAs in some CLL patients that was not related to Dicer expression (23). The precursors of 26 miRNAs were equally expressed in non-cancerous and cancerous colorectal tissue from patients (42). However, the expression of mature miR-143 and -145 (but not the other 24 miRNAs) was greatly reduced in cancerous tissue compared with non-cancerous tissue, again suggesting altered processing for specific miRNAs in human disease.
We demonstrate here that the expression of three miRNA precursors measured by the PCR assay (miR-21, -29 and -224) paralleled the expression of the mature miRNAs from northern blots. In order to fully characterize the expression of large numbers of miRNAs, it may be necessary to quantify both the mature and miRNA precursors using sensitive assays such as the PCR. A major challenge in measuring the mature miRNA using RT–PCR is the small size of the mature miRNA (∼22 nt). There may be situations (such as in normal development) in which processing or stability of the miRNA is not regulated and the expression of the miRNA precursors reflects the levels of the active, mature miRNA. There may exist other circumstances (such as in human disease) where alterations in miRNA biogenesis produce levels of mature miRNA that are very different from those of the pre-miRNA. In the former situation, sensitive PCR assays such as the one described here could be used to measure the miRNA precursor as a means to predict the levels of mature miRNA, while in the latter situation, sensitive assays will be necessary to measure the mature miRNA. We are currently working on PCR assays to amplify and quantify mature miRNAs and studying the relationship between the levels of precursor and mature miRNAs in normal development and in human diseases such as cancer.
SUPPLEMENTARY MATERIAL
Supplementary Material is available at NAR Online.
Acknowledgments
ACKNOWLEDGEMENTS
We thank Nelson Lau and David Bartel for their protocol and assistance with the northern blotting.
REFERENCES
- 1.Pasquinelli A.E. and Ruvkun,G. (2002) Control of developmental timing by microRNAs and their targets. Annu. Rev. Cell. Dev. Biol., 18, 495–513. [DOI] [PubMed] [Google Scholar]
- 2.Moss E.G. and Poethig,R.S. (2002) MicroRNAs: something new under the sun. Curr. Biol., 12, R688–R690. [DOI] [PubMed] [Google Scholar]
- 3.Grishok A., Pasquinelli,A.E., Conte,D., Li,N., Parrish,S., Ha,I., Baillie,D.L., Fire,A., Ruvkun,G. and Mello,C.C. (2001) Genes and mechanisms related to RNA interference regulate expression of the small temporal RNAs that control C.elegans developmental timing. Cell, 106, 23–34. [DOI] [PubMed] [Google Scholar]
- 4.Hutvagner G., McLachlan,J., Pasquinelli,A.E., Balint,E., Tuschl,T. and Zamore,P.D. (2001) A cellular function for the RNA-interference enzyme Dicer in the maturation of the let-7 small temporal RNA. Science, 293, 834–838. [DOI] [PubMed] [Google Scholar]
- 5.Ketting R.F., Fischer,S.E., Bernstein,E., Sijen,T., Hannon,G.J. and Plasterk,R.H. (2001) Dicer functions in RNA interference and in synthesis of small RNA involved in developmental timing in C.elegans.Genes Dev., 15, 2654–2659. [DOI] [PMC free article] [PubMed] [Google Scholar]
- 6.Lee R.C., Feinbaum,R.L. and Ambros,V. (1993) The C.elegans heterochronic gene lin-4 encodes small RNAs with antisense complementarity to lin-14. Cell, 75, 843–854. [DOI] [PubMed] [Google Scholar]
- 7.Reinhart B.J., Slack,F.J., Basson,M., Pasquinelli,A.E., Bettinger,J.C., Rougvie,A.E., Horvitz,H.R. and Ruvkun,G. (2000) The 21-nucleotide let-7 RNA regulates developmental timing in Caenorhabditis elegans.Nature, 403, 901–906. [DOI] [PubMed] [Google Scholar]
- 8.Pasquinelli A.E., Reinhart,B.J., Slack,F., Martindale,M.Q., Kuroda,M.I., Maller,B., Hayward,D.C., Ball,E.E., Degnan,B., Muller,P., Spring,J., Srinivasan,A., Fishman,M., Finnerty,J., Corbo,J., Levine,M., Leahy,P., Davidson,E. and Ruvkun,G. (2000) Conservation of the sequence and temporal expression of let-7 heterochronic regulatory RNA. Nature, 408, 86–89. [DOI] [PubMed] [Google Scholar]
- 9.Slack F.J., Basson,M., Liu,Z., Ambros,V., Horvitz,H.R. and Ruvkun,G. (2000) The lin-41 RBCC gene acts in the C.elegans heterochronic pathway between the let-7 regulatory RNA and the LIN-29 transcription factor. Mol. Cell, 5, 659–669. [DOI] [PubMed] [Google Scholar]
- 10.Seggerson K., Tang,L. and Moss,E.G. (2002) Two genetic circuits repress the Caenorhabditis elegans heterochronic gene lin-28 after translation initiation. Dev. Biol., 243, 215–225. [DOI] [PubMed] [Google Scholar]
- 11.Olsen P.H. and Ambros,V. (1999) The lin-4 regulatory RNA controls developmental timing in Caenorhabditis elegans by blocking LIN-14 protein synthesis after the initiation of translation. Dev. Biol., 216, 671–680. [DOI] [PubMed] [Google Scholar]
- 12.Reinhart B.J., Weinstein,E.G., Rhoades,M.W., Bartel,B. and Bartel,D.P. (2002) MicroRNAs in plants. Genes Dev., 16, 1616–1626. [DOI] [PMC free article] [PubMed] [Google Scholar]
- 13.Reinhart B.J. and Bartel,D.P. (2002) Small RNAs correspond to centromere heterochromatic repeats. Science, 297, 1831. [DOI] [PubMed] [Google Scholar]
- 14.Lagos-Quintana M., Rauhut,R., Lendeckel,W. and Tuschl,T. (2001) Identification of novel genes coding for small expressed RNAs. Science, 294, 853–858. [DOI] [PubMed] [Google Scholar]
- 15.Lagos-Quintana M., Rauhut,R., Yalcin,A., Meyer,J., Lendeckel,W. and Tuschl,T. (2002) Identification of tissue-specific microRNAs from mouse. Curr. Biol., 12, 735–739. [DOI] [PubMed] [Google Scholar]
- 16.Lagos-Quintana M., Rauhut,R., Meyer,J., Borkhardt,A. and Tuschl,T. (2003) New microRNAs from mouse and human. RNA, 9, 175–179. [DOI] [PMC free article] [PubMed] [Google Scholar]
- 17.Lau N.C., Lim,L.P., Weinstein,E.G. and Bartel,D.P. (2001) An abundant class of tiny RNAs with probable regulatory roles in Caenorhabditis elegans.Science, 294, 858–862. [DOI] [PubMed] [Google Scholar]
- 18.Lee R.C. and Ambros,V. (2001) An extensive class of small RNAs in Caenorhabditis elegans.Science, 294, 862–864. [DOI] [PubMed] [Google Scholar]
- 19.Griffiths-Jones S. (2004) The microRNA Registry. Nucleic Acids Res., 32, D109–D111. [DOI] [PMC free article] [PubMed] [Google Scholar]
- 20.Lim L.P., Lau,N.C., Weinstein,E.G., Abdelhakim,A., Yekta,S., Rhoades,M.W., Burge,C.B. and Bartel,D.P. (2003) The microRNAs of Caenorhabditis elegans.Genes Dev., 17, 991–1008. [DOI] [PMC free article] [PubMed] [Google Scholar]
- 21.Lim L.P., Glasner,M.E., Yekta,S., Burge,C.B. and Bartel,D.P. (2003) Vertebrate microRNA genes. Science, 299, 1540. [DOI] [PubMed] [Google Scholar]
- 22.Brennecke J., Hipfner,D.R., Stark,A., Russell,R.B. and Cohen,S.M. (2003) Bantam encodes a developmentally regulated microRNA that controls cell proliferation and regulates the proapoptotic gene hid in Drosophila.Cell, 113, 25–36. [DOI] [PubMed] [Google Scholar]
- 23.Calin G.A., Dumitru,C.D., Shimizu,M., Bichi,R., Zupo,S., Noch,E., Aldler,H., Rattan,S., Keating,M., Rai,K., Rassenti,L., Kipps,T., Negrini,M., Bullrich,F. and Croce,C.M. (2002) Frequent deletions and down-regulation of micro-RNA genes miR15 and miR16 at 13q14 in chronic lymphocytic leukemia. Proc. Natl Acad. Sci. USA, 99, 15524–15529. [DOI] [PMC free article] [PubMed] [Google Scholar]
- 24.Xu P., Vernooy,S.Y., Guo,M. and Hay,B.A. (2003) The Drosophila microRNA Mir-14 suppresses cell death and is required for normal fat metabolism. Curr. Biol., 13, 790–795. [DOI] [PubMed] [Google Scholar]
- 25.Rhoades M.W., Reinhart,B.J., Lim,L.P., Burge,C.B., Bartel,B. and Bartel,D.P. (2002) Prediction of plant microRNA targets. Cell, 110, 513–520. [DOI] [PubMed] [Google Scholar]
- 26.Llave C., Xie,Z., Kasschau,K.D. and Carrington,J.C. (2002) Cleavage of scarecrow-like mRNA targets directed by a class of Arabidopsis miRNA. Science, 297, 2053–2056. [DOI] [PubMed] [Google Scholar]
- 27.Lee Y., Jeon,K. Lee,J.T., Kim,S. and Kim,V.N. (2002) MicroRNA maturation: stepwise processing and subcellular localization. EMBO J., 21, 4663–4670. [DOI] [PMC free article] [PubMed] [Google Scholar]
- 28.Hutvagner G. and Zamore,P.D. (2002) A microRNA in a multiple-turnover RNAi enzyme complex. Science, 297, 2056–2060. [DOI] [PubMed] [Google Scholar]
- 29.Schmittgen T.D., Zakrajsek,B.A., Mills,A.G., Gorn,V., Singer,M.J. and Reed,M.W. (2000) Quantitative reverse transcription–polymerase chain reaction to study mRNA decay: comparison of endpoint and real-time methods. Anal. Biochem., 285, 194–204. [DOI] [PubMed] [Google Scholar]
- 30.Sharma R.C., Murphy,A.J., DeWald,M.G. and Schimke,R.T. (1993) A rapid procedure for isolation of RNA-free genomic DNA from mammalian cells. Biotechniques, 14, 176–178. [PubMed] [Google Scholar]
- 31.Ambros V., Bartel,B., Bartel,D.P., Burge,C.B., Carrington,J.C., Chen,X., Dreyfuss,G., Eddy,S.R., Griffiths-Jones,S., Marshall,M., Matzke,M., Ruvkun,G. and Tuschl,T. (2003) A uniform system for microRNA annotation. RNA, 9, 277–279. [DOI] [PMC free article] [PubMed] [Google Scholar]
- 32.Lee Y., Ahn,C., Han,J., Choi,H., Kim,J., Yim,J., Lee,J., Provost,P., Radmark,O., Kim,S. and Kim,V.N. (2003) The nuclear RNase III Drosha initiates microRNA processing. Nature, 425, 415–419. [DOI] [PubMed] [Google Scholar]
- 33.Livak K.J. and Schmittgen,T.D. (2001) Analysis of relative gene expression data using real-time quantitative PCR and the 2(-Delta Delta C(T)) method. Methods, 25, 402–408. [DOI] [PubMed] [Google Scholar]
- 34.Mygind T., Birkelund,S., Birkebaek,N., Oestergaard,L., Jensen,J. and Christiansen,G. (2002) Determination of PCR efficiency in chelex-100 purified clinical samples and comparison of real-time quantitative PCR and conventional PCR for detection of Chlamydia pneumoniae.BMC Microbiol., 2, 17. [DOI] [PMC free article] [PubMed] [Google Scholar]
- 35.Dittmer D.P. (2003) Transcription profile of Kaposi’s sarcoma-associated herpesvirus in primary Kaposi’s sarcoma lesions as determined by real-time PCR arrays. Cancer Res., 63, 2010–2015. [PubMed] [Google Scholar]
- 36.Fakhari F.D. and Dittmer,D.P. (2002) Charting latency transcripts in Kaposi’s sarcoma-associated herpesvirus by whole-genome real-time quantitative PCR. J. Virol., 76, 6213–6123. [DOI] [PMC free article] [PubMed] [Google Scholar]
- 37.Eisen M.B., Spellman,P.T., Brown,P.O. and Botstein,D. (1998) Cluster analysis and display of genome-wide expression patterns. Proc. Natl Acad. Sci. USA, 95, 14863–14868. [DOI] [PMC free article] [PubMed] [Google Scholar]
- 38.Zeng Y. and Cullen,B.R. (2003) Sequence requirements for micro RNA processing and function in human cells. RNA, 9, 112–123. [DOI] [PMC free article] [PubMed] [Google Scholar]
- 39.Krichevsky A.M., King,K.S., Donahue,C.P., Khrapko,K. and Kosik,K.S. (2003) A microRNA array reveals extensive regulation of microRNAs during brain development. RNA, 9, 1274–1281. [DOI] [PMC free article] [PubMed] [Google Scholar]
- 40.Grad Y., Aach,J., Hayes,G.D., Reinhart,B.J., Church,G.M., Ruvkun,G. and Kim,J. (2003) Computational and experimental identification of C.elegans microRNAs. Mol. Cell, 11, 1253–1263. [DOI] [PubMed] [Google Scholar]
- 41.Johnson S.M., Lin,S.Y. and Slack,F.J. (2003) The time of appearance of the C.elegans let-7 microRNA is transcriptionally controlled utilizing a temporal regulatory element in its promoter. Dev. Biol., 259, 364–379. [DOI] [PubMed] [Google Scholar]
- 42.Michael M.Z., O’Connor,S.M., van Holst Pellekaan,N.G., Young,G.P. and James,R.J. (2003) Reduced accumulation of specific microRNAs in colorectal neoplasia. Mol. Cancer Res., 1, 882–891. [PubMed] [Google Scholar]
Associated Data
This section collects any data citations, data availability statements, or supplementary materials included in this article.


