Abstract
BACKGROUND
The accurate and precise measurement of urinary albumin is critical, since even minor increases are diagnostically sensitive indicators of renal disease, cardiovascular events, and risk for death. To gain insights into potential measurement biases, we systematically compared urine albumin measurements performed by LC-MS, a clinically available immunoturbidimetric assay, and size-exclusion HPLC.
METHODS
We obtained unused clinical urine samples from 150 patients who were stratified by degrees of albuminuria (<20 mg/L, 20–250 mg/L, >250 mg/L) as determined by the immunoturbidimetric assay used in our clinical laboratory (Roche Hitachi 912). Urine albumin was then remeasured via LC-MS and HPLC (Accumin™) assays.
RESULTS
The immunoturbidimetric assay, calibrated using manufacturer-supplied serum-derived calibrators (Diasorin), underestimated albumin compared with LC-MS. After calibration with purified HSA, this immunoturbidimetric assay correlated well with LC-MS. HPLC overestimated albumin compared with both LC-MS and immunoturbidimetry. The current LC-MS and HPLC assays both performed poorly at concentrations <20 mg/L.
CONCLUSIONS
Efforts are needed to establish gold-standard traceable calibrators for clinical assays. LC-MS is a specific method to quantify albumin in native urine when concentrations exceed 20 mg/L, and therefore could be employed for standardization among assays.
Degree of urinary albumin excretion is a well-established predictor of the subsequent development of overt diabetic nephropathy (1). It is also a prognostic indicator of outcome in most forms of renal disease (2), and a reduction in excretion by specific therapeutic strategies portends better renal survival (3). Microalbuminuria (urinary albumin excretion 30–300 mg/day for timed collections and 20–200 mg/g creatinine for random or spot urine samples) is an independent marker for increased morbidity and mortality, even in the absence of renal disease (4, 5). Further, reduction of albuminuria translates to reduced cardiovascular events among hypertensive subjects (6). The distinction between normoalbuminuria and microalbuminuria is arbitrary, as several population-based studies have demonstrated that minimal incremental increases in urinary albumin excretion, even within the reference ranges, increase risk of subsequent renal dysfunction and cardiovascular events (7, 8). These findings highlight the importance of accurate and precise measurement of low concentrations of albumin in urine and have spurred development of newer methods for its quantification.
Urinary albumin has traditionally been measured using antibody-based methods including RIA, ELISA, nephelometry, and immunoturbidimetry (9, 10). Measurement of urinary albumin is potentially complicated by the observation that it may exist in several forms (11). More recently, size-exclusion HPLC has been proposed as a more sensitive method to measure urinary albumin (12). In the low range (<100 mg/L), HPLC gives higher values than conventional immunoassays, and this has been hypothesized to be because of the presence of immunochemically nonreactive albumin (13, 14). Indeed, increases in urinary albumin assessed by HPLC may be an earlier predictor of a risk for progression to mature diabetic nephropathy than when microalbuminuria is measured by standard methods (12). It is also possible that size-exclusion HPLC methods may overestimate albumin concentration, since it has been demonstrated that proteins of similar molecular mass may coelute with albumin (15).
To more specifically measure urinary albumin, methods using LC-MS have been developed to precisely quantify intact albumin in native urine using N15-labeled human serum albumin (HSA) (16) and BSA (17) as internal standards. Here we evaluated an LC-MS method with an improved limit of quantification relative to the version used in the previous publications and compared it against immunoturbidimetric and size-exclusion HPLC assays at clinically relevant concentration ranges.
Materials and Methods
We obtained unused clinical urine samples from those submitted by patients to the Mayo Renal Function Laboratory for clinical indications. Albumin was initially measured by a standard immunoturbidimetric assay, and samples were selected from 3 clinically relevant ranges (0 to <20 mg/L, 20–250 mg/L, >250 mg/L; n = 50 each). The staff in the routine clinical Renal Function Laboratory initially measured urinary albumin on fresh (unfrozen) urines and saved aliquots at −80 °C for future study. Samples were subsequently analyzed by size-exclusion and LC-MS blinded to previous results. The Mayo IRB approved this study.
IMMUNOASSAY
The routine clinical urine albumin assay in our laboratory is immunoturbidimetric (Roche Hitachi 912). We used reagents and calibrators in a kit purchased from Diasorin, Inc. (SPQ Test System). In this assay, albumin is detected using an antibody to human albumin in an automated immunoprecipitation analysis that detects turbidity and increased light scatter. Urine samples were centrifuged at 650g for 10 min before analysis. After incubation for approximately 10 min, we measured the absorbance of the solution at 340 nm. For the routine assay, we generated a calibration curve by assaying a series of manufacturer-supplied calibrators (Diasorin) with known concentrations of albumin, using the instrument’s data reduction capability. Concentrations for the calibrators (5.3–174 mg/L) and samples were interpolated from the calibration curve. In another set of experiments, we recalibrated the instrument using serial dilutions of HSA (Sigma-Al-drich) in charcoal-stripped urine (SeraCare Life Sciences). The stock HSA concentration (7.8 g/L) was quantified via UV absorbance (absorptivity 3.85 × 10⁴ at 280 nm wavelength) (18).
LC-MS
We quantified urinary albumin using source-induced fragmentation as described by Loo et al. (19). In a modified version of the published protocol (17), source-induced fragmentation of intact albumin was achieved by increasing the declustering potential voltage from 100V to 336V on an Applied Biosystems API5000 triple quadrupole tandem mass spectrometer. We spiked calibrators or centrifuged urine samples (200 μL) with 20 mg/L BSA (Sigma-Aldrich), the optimal concentration to reproducibly generate an internal standard signal response without introducing interference in the HSA signal response. After the addition of BSA, all calibrators and samples were mixed vigorously for 20 min. We then loaded 60 μL sample onto an ABI POROS R2/10 (2.1 × 10 mm; 50 μm bead) column using a Thermo Scientific Aria TLX2 multiplex LC system, which allows for a vigorous cleaning cycle of the column to reduce the possibility of carryover and diversion of waste while directing sample to the MS. We performed LC for albumin separation using a 3-solvent system with a total run time of 15 min. The first 3.5 min of the LC run were sent to waste, and data were collected for the next 3.5 min, before again diverting the last 8 min of the LC run to waste. The mobile phases consisted of solvent A (water, 0.1% formic acid), solvent B (methanol, 0.1% formic acid), and solvent C (70% formic acid, 30% isopropanol). LC flow rate was 1 mL/min beginning with 95% A and 5% B for 1.5 min, ramping to 70% A and 30% B for 0.5 min, holding at 70% A and 30% B for 2 min, ramping to 50% A and 50% B over 2.5 min, then to 5% A and 95% B over 0.5 min, and holding there for 1 additional minute. The column was then cleaned at a flow rate of 2.1 mL/min for 5.5 min using 4.5% A, 0.3% B, and 95.2% C and reequilibrated with 95% A and 5% B at 1 mL/min for 1.5 min. We monitored the BSA b24+4 fragment (m/z 698.15) as an internal standard and quantitated the human albumin b24+4 fragment (m/z 685.1) using an 11-point calibration curve (quadratic fit) prepared from serial dilutions of HSA in charcoal-stripped urine as described above.
HPLC
For size-exclusion HPLC (Accumin™, Aus Am Bio-technologies), we analyzed the same urine samples with a Beckman System Gold HPLC following the Accumin protocol and using the kit components. The Accumin Direct Total Intact Albumin Assay detects total albumin after calibration with HSA liquid calibrators. Each sample was vortex-mixed for 10 s and centrifuged at approximately 2500g for 5 min. We transferred 50 μL supernatant from each centrifuged sample into separate polypropylene vials and injected 25 μL onto the column. Intact albumin was separated from other urinary proteins based on molecular size and conformation according to the package insert. Absorbance was measured at 214 nm, and we analyzed results using Beckman System Gold software.
Results
LC-MS
The lower limit of detection was 10 mg/L, defined as 3 times the SD of the mean signal obtained from assaying the 0 mg/L calibrator 20 times. The limit of quantification or functional sensitivity, defined as the point where the interassay CV reached 20%, was determined to be 20 mg/L. Intraassay imprecision studies of 3 patient samples (19.5, 40.3, and 127 mg/L, n = 20 replicates) yielded CVs all within a range of 4% to 6%. Interassay imprecision studies of 12 patient samples and 3 control samples (10.2 to 232 mg/L) analyzed over 16–20 days were more variable, in part because of urine matrix variability and/or assay sensitivity. These CVs ranged from as low as 8% to as high as 24%, with most samples in the 11%–16% region. Recovery studies showed a mean recovery of 95%. Linearity studies performed by diluting patient samples in stripped urine yielded a linear regression equation of y = 1.035x − 0.4643, with an R2 = 0.9961 over the range of 9 to 300 mg/L.
HITACHI IMMUNOTURBIDIMETRIC ASSAY
An operational limit of quantification was verified empirically by measuring 1 sample with a low albumin concentration (1.04 mg/L) 10 times and demonstrating an acceptable CV (9.65%). An interassay imprecision study (2 control samples analyzed over 20 days) yielded CVs of 3.1% and 1.8%, with mean values of 10.8 and 65.7 mg/L, respectively. Linearity studies, performed by diluting patient samples, yielded a linear regression equation of y = 1.0601x + 0.0609, R2 = 0.9984 over the range of 5.5 to 88 mg/L. A mean recovery of 91% was observed.
HPLC
Intraassay imprecision was measured using 3 urine concentrations (19.0, 154.4, and 208.1 mg/L) assayed in triplicate on 2 different days. CVs were 0.5%, 0.6%, and 0.4%, respectively. Interassay imprecision was measured over 3 separate runs (n = 7 patient samples ranging from 18.9 to 209.3 mg/L) and resulted in CVs of 0.5%, 0.6%, and 0.4%.
METHOD COMPARISON
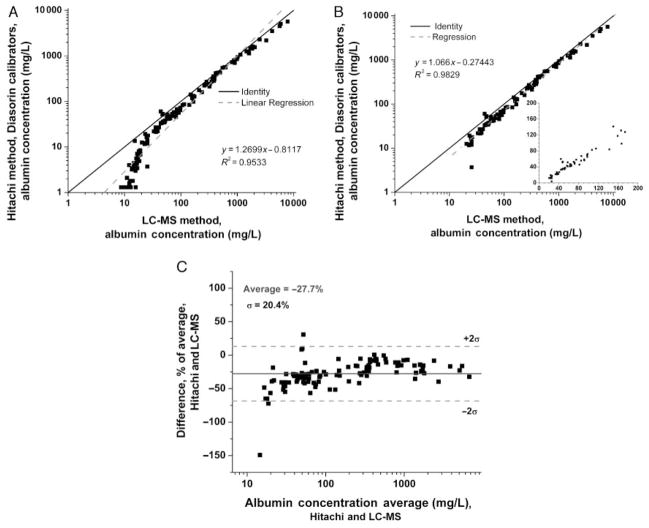
Urine albumin concentrations consistently measured higher across all concentration ranges with LC-MS compared with the Hitachi immunoturbidimetric platform using the Diasorin reagents and kit serum calibrators, as evidenced by points lying below the line of identity in Fig. 1A. Of note, the LC-MS assay calibrators were prepared from purified commercial HSA quantitated by UV absorbance, whereas the clinical Roche immunoassay employs prediluted serum-based calibrators (Diasorin). Because the LC-MS assay cannot accurately quantify urine albumin <20 mg/L (see above), these points were deleted in Fig. 1B before calculation of a regression line. The inset in Fig. 1B highlights that the correlation between the 2 assays is similar in the clinically important microalbuminuric range (20–500 mg/L), as in the higher protein samples (>500 mg/L). A consistent mean negative bias of 27% in the quantifiable range for the immunoturbidimetric vs the LC-MS assay is more apparent in the Bland–Altman plot (Fig. 1C).
Fig. 1. Urine albumin by immunoassay (serum calibrators) vs LC-MS.
Because the LC-MS was not adequate below 20 mg/L (A), values <20 mg/L were deleted in (B) before calculating a linear regression (dashed line), which falls below the line of identity (solid line). The inset depicts the microalbuminuric range in greater detail on a linear scale. (C), Bland–Altman plot.
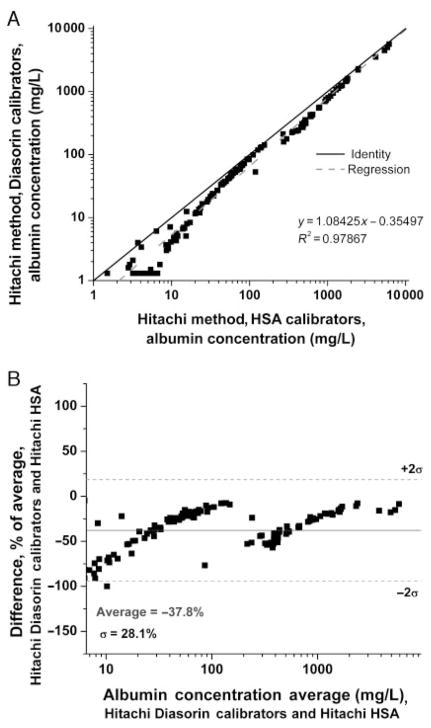
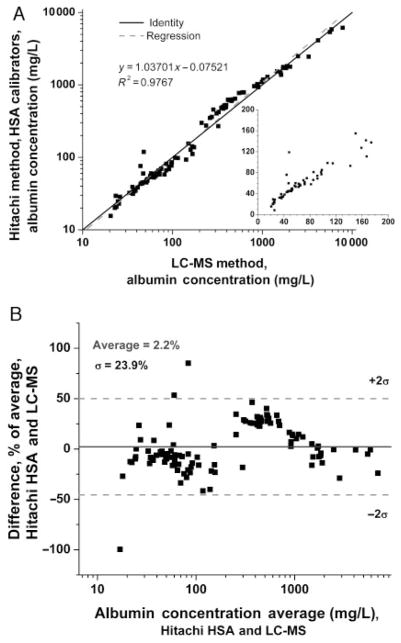
To evaluate the potential contribution of the calibrators to the discrepancies observed between assays, we reanalyzed the same samples after the Hitachi 912 was calibrated with the purified HSA standard employed in the LC-MS assay. In this experiment, the values obtained with the HSA calibrators were higher at all concentrations compared with the Diasorin calibrators (Fig. 2A), with the bias most apparent in the Bland–Altman plot at lower concentrations (<20 mg/L, Fig. 2B). The breakpoint observed at approximately 200 mg/L may in part reflect the procedural detail that all samples >174 mg/L are diluted 1:10 for the Hitachi assay for quantification using Diasorin reagent B; a suboptimal curve-fitting algorithm by the instrument might also explain this result. When results for the immunoturbidimetric and LC-MS assays were compared after calibration of both assays with the same pure HSA calibrators, the correlation was improved (Fig. 3A), without significant bias on the Bland–Altman plot throughout the range where the LC-MS assay performs well (>20 mg/L; mean 2.2% difference; Fig. 3B). As in Fig. 2, breakpoints are apparent, which may represent effects of sample dilution and/or the instrument curve-fitting algorithm. Therefore, discrepancies between the immunoturbidimetric and LC-MS assays appear to be largely due to calibration.
Fig. 2. Urine albumin by immunoturbidimetric assay using HSA vs serum calibrators.
(A), Correlation. (B), Bland–Altman plot.
Fig. 3. Urine albumin by immunoassay using HSA standards vs LC-MS.
(A), Correlation. (B), Bland–Altman plot. Inset in A depicts the microalbuminuric range in greater detail on a linear scale.
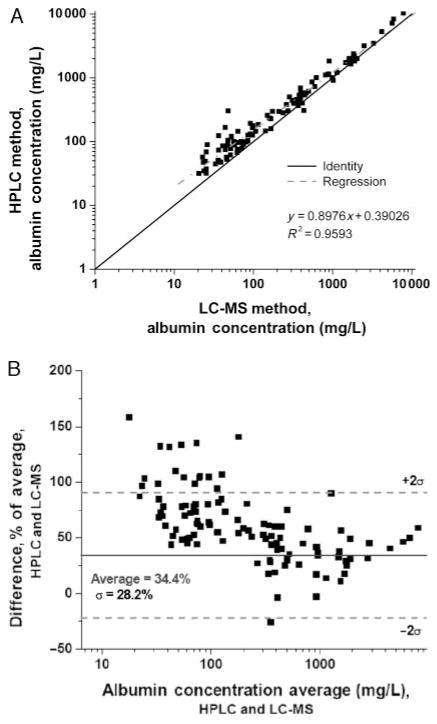
Next, we compared results from the size-exclusion HPLC assay to those from the LC-MS assay. The HPLC assay yielded higher results for albumin across all concentrations (Fig. 4A), with the bias more apparent at concentrations <100 mg/L, and especially <50 mg/L. Overall, the mean difference with the HPLC assay was 34% (Fig. 4B). These results are consistent with previous observations that HPLC gives higher values than immunoassay, especially in the microalbuminuric range. When the HPLC assay was calibrated using pure HSA, read-back values for the HSA calibrators correlated well with the nominal values (r2 = 0.998), although quantification was poor below 10 mg/L. Subsequently, when the Accumin serum-based standards were quantified using the HPLC assay calibrated with pure HSA, there was also a good correlation (r2 = 0.998), but values were substantially higher (approximately 30%) than the nominal values for the Accumin calibrators. Therefore, the Accumin calibrators may be another source of bias in the assay, perhaps owing to other proteins that coelute with the albumin peak in this serum-derived reagent, and contribute to discrepancies between HPLC and the LC-MS and immunoturbidimetric assays.
Fig. 4. Urinary albumin by HPLC vs LC-MS.
(A), Correlation. (B), Bland–Altman plot.
Discussion
Accurate determination of urinary albumin concentration is a key clinical test. We developed an LC-MS assay that might serve as a reference measurement procedure for quantifying intact albumin in urine (both immunoreactive and nonimmunoreactive) (16, 17). Comparing results with this assay to 2 currently available commercial tests demonstrated that an immunoturbidimetric, antibody-based test underestimates albumin when commercial, serum-derived calibrators are used, whereas size-exclusion HPLC overestimates it. For the antibody-based immunoturbidimetric assay we used, much of the discrepancy with LC-MS can be attributed to calibration. Therefore, efforts at standardization between laboratories and platforms will likely require careful attention to the calibrator materials used.
Several factors could potentially contribute to the differences we observed when the immunoturbidimetric assay was performed with commercial, serum-based calibrators vs pure HSA standards (Fig. 2). Antibodies used in the immunoassay were raised against native serum and not urinary albumin. Albumin exists in a number of isoforms, and it has been proposed that epitopes in the urine albumin molecule might not be detected by these commercially available antibodies, or that modification of albumin in the kidney might result in nonimmunoreactive albumin (12, 14, 20). However, the fact that LC-MS and immunoassay correlated quite well when the same calibrators were used (Fig. 2) argues against this possibility. It is also conceivable that immunoassay methods could underestimate albumin concentration because of the presence of substances in the urine matrix that interfere with binding of the antigen to the antibody. If this were the case, the ratio of albumin and the interfering substance might be small at lower albumin concentrations and increase as albumin concentration rises. Therefore, one might predict better correlation between immunoassay and LC-MS at higher albumin concentrations, which we did not observe (Figs. 1 and 3). Finally, it is possible that native urine might contain N-terminal fragments that are recognized by the LC-MS assay but not the antibody assay, accounting in part for the positive bias observed with LC-MS (Fig. 1B). However, this bias is consistently 20% to 30% across all urinary albumin ranges, and it seems unlikely that the ratio of intact albumin to fragments would remain constant as urinary albumin increases from normal to high concentrations. Therefore, the sum of our evidence suggests that the antibodies in the Diasorin assay appropriately recognize urinary albumin. Because the current LC-MS assay does not perform well in the low to mid-normal range (<20 mg/L), our studies cannot address the performance of immunoassays in this concentration range, which likely is of clinical and epidemiological significance.
Size-exclusion HPLC has been purported to measure total urinary albumin, including immunoreactive and nonimmunoreactive albumin (13). In fact, some studies have suggested that measurement of urinary albumin by HPLC can predict the onset of overt albuminuria in type 1 and type 2 diabetics 3.9 and 2.4 years earlier, respectively, than a standard immunoassay (12, 14). It has been proposed that the epitopes on the albumin molecule might be altered by conformational changes as a result of incomplete processing by the lysosomal pathway, particularly in early diabetic nephropathy (21, 22). Other studies have suggested that size-exclusion HPLC assay can resolve albumin separately from other proteins of similar molecular size (9). In addition, a recent study confirmed that multiple proteins were present in the size-exclusion HPLC peak used to quantify albumin in urine, and additional analysis to identify proteins in the “albumin peak” using reversed-phase HPLC and MS suggested that albumin actually comprised only 70% of the material in this peak (15). In our study, HPLC gave higher results than LC-MS and immunoassay across all concentration ranges, and this effect was more pronounced at low concentration ranges (<50 mg/L). Based on the current results, we cannot exclude the possibility that nonimmunoreactive albumin exists; however, given the nature of the LC-MS assay, in order for this to be the case these immunononreactive fragments would have to either totally lack (or have modified portions of) the amino-terminal 24 amino acids, or have different affinity for the reversed-phase column than the intact albumin molecule. It is still conceivable that nonimmunoreactive albumin might exist in the lowest concentration ranges (<20 mg/L), where our current study cannot compare LC-MS and HPLC.
LC-MS is a novel method for quantification of urinary albumin that relies strictly on the mass-to-charge of a specific protein fragment, whereas other traditional methods rely on antibody affinity and/or size. This LC-MS method reliably detects albumin with an intact N-terminus, and we therefore believe it provides a specific means for measurement of albumin concentration, recognizing its potential limitations. The LC-MS assay is currently not sensitive at very low albumin concentrations (<20 mg/L; Fig. 1) owing to high signal-to-noise ratio and will need further refinements to achieve a lower limit of quantification. Because this method is relatively time consuming and requires expensive instruments, it may not be practical for routine urine albumin measurements; however, it could be invaluable to standardize between assays and calibrators that are used commonly across clinical practices. Furthermore, refinement of this assay to detect concentrations <20 mg/L in native urine, and other fragments of albumin, could allow further study into the nature, quantity, and clinical relevance of urinary albumin species in this concentration range for renal disease and cardiovascular morbidity.
Acknowledgments
The authors thank Drs. David Barnidge, Frank Crow, and Ward Lutz for helpful discussions.
Grant/Funding Support: None declared.
Footnotes
Financial Disclosures: None declared.
References
- 1.Viberti GC, Jarrett RJ, Keen H. Microalbuminuria as prediction of nephropathy in diabetics. Lancet. 1982;2:611. doi: 10.1016/s0140-6736(82)90688-2. [DOI] [PubMed] [Google Scholar]
- 2.Lea J, Greene T, Hebert L, Lipkowitz M, Massry S, Middleton J, et al. The relationship between magnitude of proteinuria reduction and risk of end-stage renal disease: results of the African American study of kidney disease and hypertension. Arch Intern Med. 2005;165:947–53. doi: 10.1001/archinte.165.8.947. [DOI] [PubMed] [Google Scholar]
- 3.Rossing P, Hommel E, Smidt UM, Parving HH. Reduction in albuminuria predicts diminished progression in diabetic nephropathy. Kidney Int Suppl. 1994;45:S145–9. [PubMed] [Google Scholar]
- 4.Dinneen SF, Gerstein HC. The association of microalbuminuria and mortality in non-insulin-dependent diabetes mellitus: a systematic overview of the literature. Arch Intern Med. 1997;157:1413– 8. [PubMed] [Google Scholar]
- 5.Svendsen PA, Oxenboll B, Christiansen JS. Microalbuminuria in diabetic patients: a longitudinal study. Acta Endocrinol Suppl (Copenh) 1981;242:53– 4. [PubMed] [Google Scholar]
- 6.Ibsen H, Olsen MH, Wachtell K, Borch-Johnsen K, Lindholm LH, Mogensen CE, et al. Reduction in albuminuria translates to reduction in cardiovascular events in hypertensive patients: losartan intervention for endpoint reduction in hypertension study. Hypertension. 2005;45:198–202. doi: 10.1161/01.HYP.0000154082.72286.2a. [DOI] [PubMed] [Google Scholar]
- 7.Klausen K, Borch-Johnsen K, Feldt-Rasmussen B, Jensen G, Clausen P, Scharling H, et al. Very low levels of microalbuminuria are associated with increased risk of coronary heart disease and death independently of renal function, hypertension, and diabetes. Circulation. 2004;110:32–5. doi: 10.1161/01.CIR.0000133312.96477.48. [DOI] [PubMed] [Google Scholar]
- 8.Arnlov J, Evans JC, Meigs JB, Wang TJ, Fox CS, Levy D, et al. Low-grade albuminuria and incidence of cardiovascular disease events in nonhypertensive and nondiabetic individuals: the Framingham Heart Study. Circulation. 2005;112:969–75. doi: 10.1161/CIRCULATIONAHA.105.538132. [DOI] [PubMed] [Google Scholar]
- 9.Brinkman JW, Bakker SJ, Gansevoort RT, Hillege HL, Kema IP, Gans RO, et al. Which method for quantifying urinary albumin excretion gives what outcome? A comparison of immunonephelometry with HPLC. Kidney Int Suppl. 2004:S69–75. doi: 10.1111/j.1523-1755.2004.09219.x. [DOI] [PubMed] [Google Scholar]
- 10.Giampietro O, Lucchetti A, Cruschelli L, Clerico A, Berni R, Penno G, et al. Measurement of urinary albumin excretion (UAE) in diabetic patients: immunonephelometry versus radioimmunoassay. J Nucl Med Allied Sci. 1989;33:252–7. [PubMed] [Google Scholar]
- 11.Denton KA, Tate SA. Capillary electrophoresis of recombinant proteins. J Chromatogr B Biomed Sci Appl. 1997;697:111–21. doi: 10.1016/s0378-4347(96)00535-x. [DOI] [PubMed] [Google Scholar]
- 12.Comper WD, Osicka TM, Clark M, MacIsaac RJ, Jerums G. Earlier detection of microalbuminuria in diabetic patients using a new urinary albumin assay. Kidney Int. 2004;65:1850–5. doi: 10.1111/j.1523-1755.2004.00585.x. [DOI] [PubMed] [Google Scholar]
- 13.Osicka TM, Comper WD. Characterization of immunochemically nonreactive urinary albumin. Clin Chem. 2004;50:2286–91. doi: 10.1373/clinchem.2004.039743. [DOI] [PubMed] [Google Scholar]
- 14.Comper WD, Jerums G, Osicka TM. Differences in urinary albumin detected by four immunoassays and high-performance liquid chromatography. Clin Biochem. 2004;37:105–11. doi: 10.1016/j.clinbiochem.2003.10.008. [DOI] [PubMed] [Google Scholar]
- 15.Sviridov D, Meilinger B, Drake SK, Hoehn GT, Hortin GL. Coelution of other proteins with albumin during size-exclusion HPLC: implications for analysis of urinary albumin. Clin Chem. 2006;52:389–97. doi: 10.1373/clinchem.2005.057323. [DOI] [PubMed] [Google Scholar]
- 16.Singh R, Crow FW, Babic N, Lutz WH, Lieske JC, Larson TS, Kumar R. A liquid chromatography-mass spectrometry method for the quantification of urinary albumin using a novel 15N-isotopically labeled albumin internal standard. Clin Chem. 2007;53:540–2. doi: 10.1373/clinchem.2006.078832. [DOI] [PubMed] [Google Scholar]
- 17.Babic N, Larson TS, Grebe SK, Turner ST, Kumar R, Singh RJ. Application of liquid chromatography–mass spectrometry technology for early detection of microalbuminuria in patients with kidney disease. Clin Chem. 2006;52:2155–7. doi: 10.1373/clinchem.2006.072892. [DOI] [PubMed] [Google Scholar]
- 18.Gill SC, von Hippel PH. Calculation of protein extinction coefficients from amino acid sequence data. Anal Biochem. 1989;182:319. doi: 10.1016/0003-2697(89)90602-7. [DOI] [PubMed] [Google Scholar]
- 19.Loo JA, Edmonds CG, Smith RD. Tandem mass spectrometry of very large molecules: serum albumin sequence information from multiply charged ions formed by electrospray ionization. Anal Chem. 1991;63:2488–99. doi: 10.1021/ac00021a018. [DOI] [PubMed] [Google Scholar]
- 20.Comper WD, Osicka TM, Jerums G. High prevalence of immuno-unreactive intact albumin in urine of diabetic patients. Am J Kidney Dis. 2003;41:336– 42. doi: 10.1053/ajkd.2003.50041. [DOI] [PubMed] [Google Scholar]
- 21.Osicka TM, Houlihan CA, Chan JG, Jerums G, Comper WD. Albuminuria in patients with type 1 diabetes is directly linked to changes in the lyso-some-mediated degradation of albumin during renal passage. Diabetes. 2000;49:1579– 84. doi: 10.2337/diabetes.49.9.1579. [DOI] [PubMed] [Google Scholar]
- 22.Burne MJ, Panagiotopoulos S, Jerums G, Comper WD. Alterations in renal degradation of albumin in early experimental diabetes in the rat: a new factor in the mechanism of albuminuria. Clin Sci (Lond) 1998;95:67–72. [PubMed] [Google Scholar]


