Abstract
The World Health Organization (WHO) is rapidly expanding antiretroviral treatment (ART) in sub-Saharan countries. However, virological failure of ART is rarely monitored due to the lack of affordable and sustainable viral load assays suitable for resource-limited settings. Here, we report a prototype of a rapid virus detection method based on microfluidic technologies. In this method, HIV-1 particles from 10 µL whole blood were captured by anti-gp120 antibody coated on the microchannel surface and detected by dual fluorescence signals under microscopy. Next, captured HIV-1 particles were counted using the free software, ImageJ (http://rsbweb.nih.gov/ij/). This rapid HIV-1 detection method has potential to be further developed for viral load monitoring at resource-limited settings.
Keywords: Human immunodeficiency virus type 1 (HIV-1), viral load, microchip, point-of-care (POC)
1.INTRODUCTION
Currently, it is estimated that approximately 33.2 million people are infected with human immunodeficiency virus type 1 (HIV-1) worldwide, and 2.1 million AIDS patients died in 2007 alone [1]. To curb this epidemic, remarkable international efforts have been made to lower the cost of first-line antiretroviral drugs or even free in some developing countries [2]. In view of this situation, the WHO is rapidly expanding the access of ART to save lives in sub-Saharan countries, which account for 66% of current HIV-1 infections [1]. Due to the lack of financial and human resources in these countries, the ART expansion is guided mainly according to the WHO clinical staging. However, studies have shown that this strategy cannot timely identify virological failure among ART-receiving AIDS patients [3–4], emphasizing the importance of viral load monitoring in resource-limited settings.
Current commercial viral load monitoring tools such as Roche Amplicor COBAS and Abbott RealTime are not affordable and sustainable in resource-limited settings. These tests are expensive ($50–100 per test) and require solid laboratory infrastructure, air conditioning and skillful operators [5]. To facilitate ART expansion in resource-limited settings, inexpensive alternatives have been employed such as the ExaVir Reverse transcriptase (RT) assay [6–7] and in-house developed reverse-transcription followed by quantitative polymerase chain reaction (RT-qPCR) [8–9]. Recently, ExaVir RT assay Version 3 was evaluated in decentralized laboratory settings and the results showed good correlation with real-time molecular assays in subtype B samples (R > 0.95) and non-subtype B (R > 0.91). Additionally, the cost can be lowered to $13.66 per assay [10]. However, this assay still requires 2 days to complete, significantly restricting the throughput. The other alternative method based RT-PCR, despite significantly reduced cost ($20 per test), does not reduce the testing complexity and thus requires skillful operators. Thus, current inexpensive viral load assays can hardly be utilized to benefit AIDS patients at the point-of-care (POC).
Recently, nano/microfluidics have attracted researchers to develop inexpensive and disposable diagnostics for developing countries [11]. For HIV-1 diagnostics, researchers commonly miniaturize conventional ELISA for the detection of p24 antigen [12–14] or RT-PCR for the detection of HIV-1 RNA [15]. However, these assays require complex on-chip designs due to multi-step manipulations such as sample preparation and detection. Additionally, these assays require the testing of external standards in parallel to quantify targets of interest, which increases the difficulty of on-chip design. To address this, we used the HIV-1 particle as a diagnostic marker and detected it on-chip under fluorescence microscopy, which significantly simplifies the design of microchips [16]. In this design, anti-gp120 antibody is immobilized on the microchannel surface to capture HIV particles, which are then detected via dual-labeled quantum dots using fluorescence microscopy.
Here, we report on-chip detection of HIV-1 particles under a fluorescence microscope. Additionally, we employed ImageJ to automatically count virus particles to report viral load. To facilitate HIV-1 detection by a lensless imaging system, we manually counted fluorescent nanobeads (~500 nm) in the same microchip and compared with automatic counting by ImageJ. In the future, we will functionalize these nanobeads with anti-gp120, detect HIV-1 particles captured from whole blood by the lensless imaging technology [17–18] and further develop this method into a POC viral load assay.
2.MATERIALS AND METHODS
The stock of HIV-1 subtype C was prepared as previously reported [19]. In brief, peripheral blood mononuclear cells (PBMCs) from HIV-negative donors (obtained by Ficoll Hypaque density gradient centrifugation) were used to culture HIV-1. HIV-1 subtype C, which had been previously isolated, were used to infect PBMCs in RPMI 1640 at 37 °C with 5% CO2. The medium RPMI 1640 was supplemented with heat inactivated fetal calf serum [20%], HEPES Buffer [10mM], L-Glutamine [2mM], recombinant human interleukin-2 [100U/ml], penicillin [50U/ml] and streptomycin [50µg/ml]. Prior to testing, the concentration of virus particles was assessed by p24 ELISA (Perkin Elmer, Waltham, US). Supernatant collected at day 5 was aliquoted and frozen at −80 °C for later use. For microchip testing, 1 day old whole blood collected from healthy people was spiked with HIV-1 subtype C.
The microchip was assembled as previously reported [16]. In brief, PMMA and double-side adhesive film were cut using a laser cutter (VersaLaser™) according to the size of a glass slide and then used to assemble the microchip. In the microchip, three microchannels were formed with an inlet and outlet at both ends. Next, the surface of microchannels was functionalized with anti-gp120 antibody. Once whole blood samples were injected into the microchannels, HIV-1 particles were captured by anti-gp120 antibody and imaged using dual fluorescence labeling by Axiovision software. Under a fluorescence microscope (Zeiss), images of HIV-1 particles were taken under a GFP or Cy5 filter. Captured HIV-1 particles with dual fluorescence were counted using ImageJ software (http://rsb.info.nih.gov/ij/).
Latex beads of 500 nm in diameter were purchased from Sigma Aldrich. These beads were made of polystyrene and modified with amine on the surface. Excited at 520 nm, these beads can emit orange fluorescence. To facilitate automatic counting under a fluorescence microscope, 2 µl of these beads were dispersed on a glass slide and covered with a glass cover of 1 cm2. Using a GFP filter, the fluorescence signals of latex beads were imaged and analyzed using ImageJ software.
3.RESULTS AND DISCUSSIONS
Previously, we reported the fluorescent detection of HIV-1 particles in microchips using unprocessed HIV-infected patient whole blood [16]. This method can achieve specific detection of HIV-1 within 30 minutes, showing the potential to be used for viral load monitoring. In this study, we employed ImageJ software to achieve automatic counting and thus report viral load information by counting multiple images. We used nanobeads (~500 nm) as a model to achieve consistent automatic counting by ImageJ to optimize the counting mechanism. Also, we captured HIV-1 particles in a microfluidic channel and double labeled them with quantum dots. Here, we report our automatic counting results with nanobeads and microfluidic captured HIV-1 compared to manual counting.
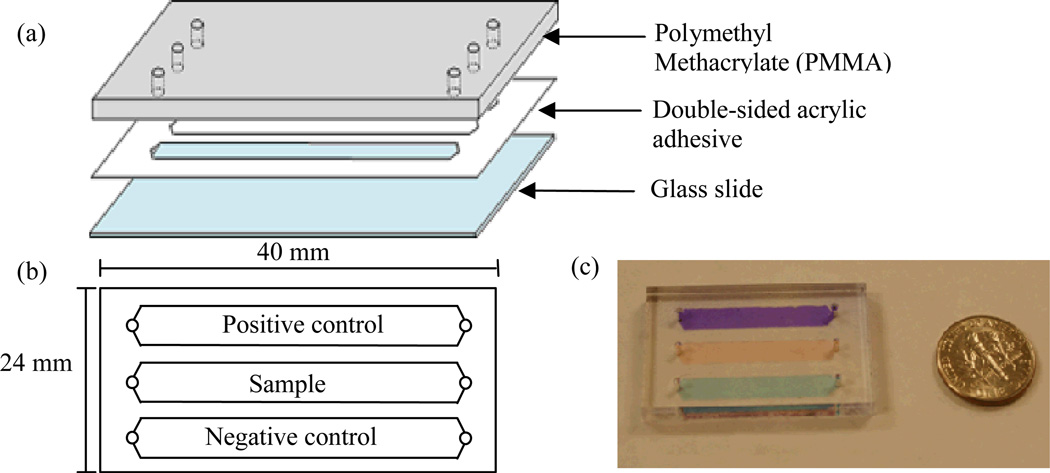
For the microchip HIV-1 capture device, a single microchannel was assembled and functionalized with anti-gp120 antibody on the surface [16]. This design was improved in this study by forming three straight microchannels in parallel (Figure 1), including a positive control channel, a sample-testing channel and a negative control channel, since positive controls and negative controls are required in clinical diagnostics. The number of channels can be increased to accommodate the needs at local clinics if more samples need to be processed at once. Further, we positioned the inlet and outlet at the tip of the triangle at both ends of the channel. This allows red blood cells and white blood cells to be washed out as viruses are being captured. Blood cells (5–18 µm) are much larger than HIV-1 virus particles (~110 nm) and they experience more shear stress than HIV-1 particles. Additionally, HIV-1 particles are captured by antigen-antibody affinity. With acting forces (i.e., shear force and binding force), we expected to achieve cell-free microfluidic channel surface so that virus particles can be specifically detected. A further improvement can be made to replace the glass slide with non-sharp materials to enhance safety. Potential materials could be parylene or PMMA since they are transparent and can be functionalized with antibodies [20].
Figure 1.
Design of HIV-1 viral load microchips. The microchip is composed of a PMMA base, double-sided acrylic adhesive and a glass slide. When assembled, three channels are formed in the microchip with a dimension of 40mm ×24 mm × 50 µm. One inlet and one outlet are located at both ends of the channel. (a) Components of the microchip. (b) Top-view of the viral load microchip. (c) Picture of a microchip with different food dyes in the microchannels.
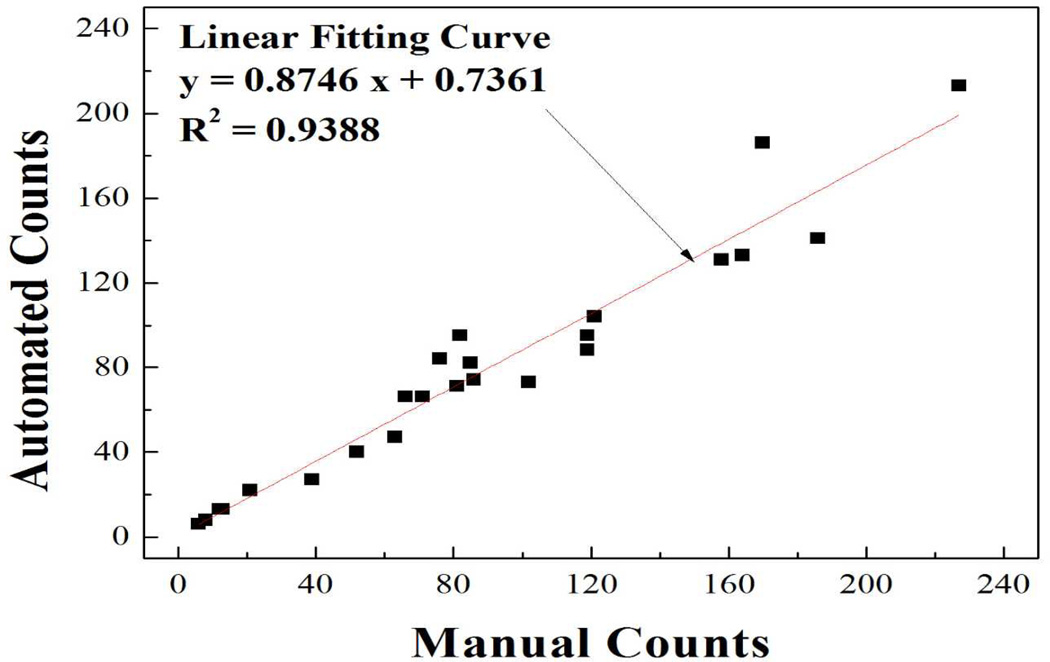
As an essential step to develop this technology for POC viral load monitoring, automatic counting needs to be established to increase turnaround time and accuracy. In this study, we first used ImageJ to count polystyrene nanobeads since it is easier to use compared to Matlab as previously reported [17]. In the nanobead model, we compared the results from automatic counting by ImageJ to manual counting. Upon excitation at a wavelength of 525 nm, polystyrene nanobeads emitted orange fluorescence. The correlation efficient of these two counting methods (Figure 2) was 0.9388, indicating ImageJ can be reliably used for automatic counting of nanobeads. The error was mainly induced by overlapping and/or aggregating nanobeads. Additionally, the automatic counting significantly (100 fold) reduced the time spent on manual counting. Thus, the automatic counting will increase the throughput and accuracy compared with manual counting under a microscope.
Figure 2.
Correlation of auto- and manual-counting. Polystyrene nanobeads (~500nm) were viewed under a fluorescence microscope (100×) using the GFP filter. The number of nanobeads was counted manually and automatically by ImageJ. The correlation of these two methods was plotted.
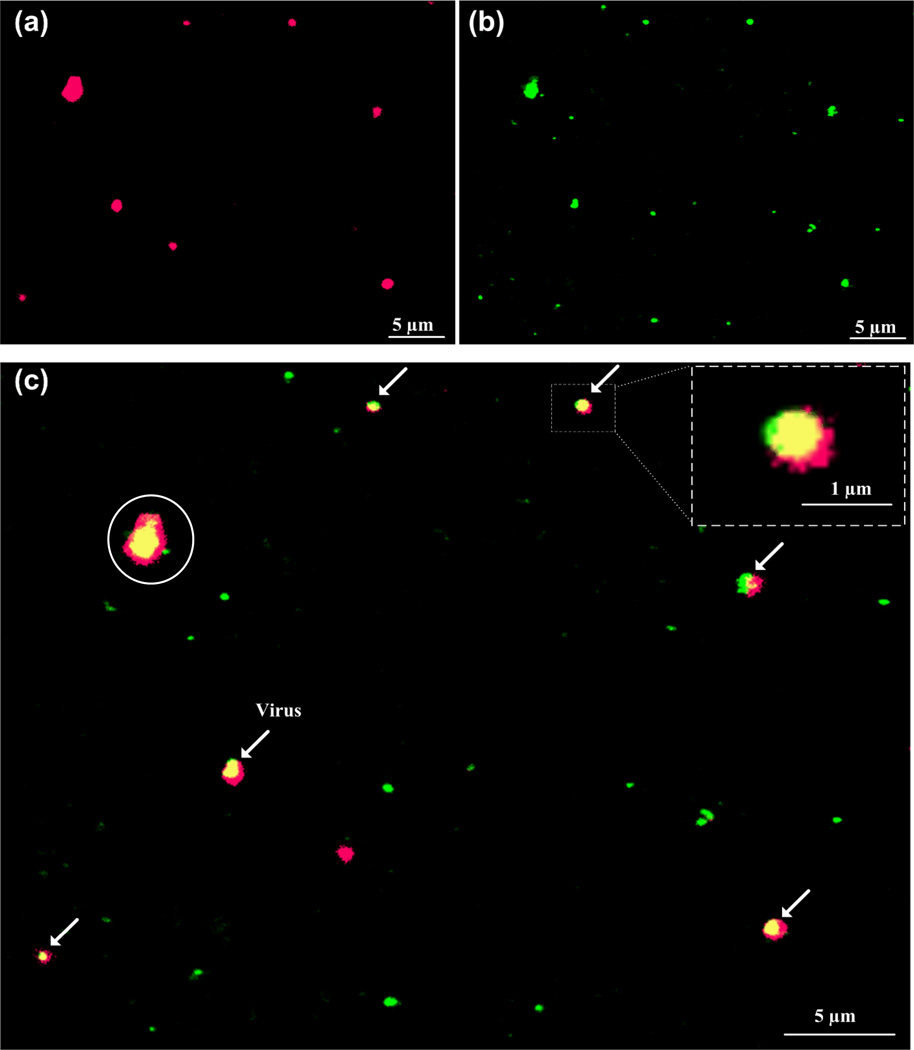
After the nanobead experiments, three steps were taken to achieve rapid automatic counting. First, images of HIV-1 particles were obtained under Cy5 (red, Figure 3a) and GFP (green, Figure 3b) filters. Second, GFP and Cy5 images were superimposed, producing merged images. HIV-1 particles, which were co-localized with two Qdots525 (green) and 655 (red), appeared in yellow in the merged images (Figure 3c). Third, automatic counting was achieved by ImageJ with threshold set to the size and intensity. The fluorescent signal of individual quantum dot measured by Axiovision software was within 300–700 nm due to diffraction, although the actual size of quantum dot was only 15–20 nm. With the aid of ImageJ, the number of HIV-1 particles was counted to be 6 on this individual image, which can be done within seconds. By using intensity and size thresholds, larger and smaller sized particles with dual fluorescence can be easily excluded by the software from viral count to avoid detection errors. The oversized particles (circled, Figure 3c) could be cell membrane debris with gp120 antigen attached, since we spiked 1 day old spiked whole blood samples with cultured HIV-1. This indicates that fresh whole blood samples are more desirable to use for better detection results or the detection software has to be optimized to handle old blood samples. This might be observed when HIV-1 assembles underneath the bilipid membrane of infected cells [21]. The oversized particles might also be aggregates of HIV-1 particles or quantum dots, which will further analyze using scanning electron microscopy. The establishment and further development of automatic counting using ImageJ will significantly facilitate the image processing compared to manual counting. Overall, manual counting results agreed with the automatic counting results with captured HIV-1 samples.
Figure 3.
Fluorescence detection of HIV-1 particles and automatic counting by ImageJ. Whole blood containing HIV-1 was injected into the microchannel and stained with two Qdot 525 (green) and 655 (red). (a) Virus particles viewed using Cy5 (red) filter. (b) Virus particles viewed using GFP (green) filter. (c) Merged pictures of a and b was performed using Axiovision software to co-localization of virus particles (in yellow), indicated by arrows. Scale bar is 5 µm except the one in the blow-up, in which it is 1 µm. Virus count was performed using ImageJ, with size threshold set within 300–700 nm to exclude non-specific detection (circled).
4.CONCLUSIONS
In conclusion, on-chip detection of HIV-1 particles was achieved with automatic counting by ImageJ. Automatic virus counting significantly reduces the sample-to-answer time and manual labor. This novel method based on the quantification of virus particles paves a new way of developing POC viral load assays. This approach does not use any amplification of genetic material, which is an advantage. Also, the label-free capture mechanism is attractive. This capture method will be merged with fluorescent-free detection and counting mechanisms as the technology matures in our laboratory. Our ultimate goal is to develop a microchip-based POC viral load monitoring platform which performs within clinical ±10% error limit compared to the gold standard, i.e., RT-qPCR.
ACKNOWLEDGEMENT
This work was supported by W.H. Coulter Foundation Young Investigator Award and MIT Deshpande Center Award. Also, we acknowledge support from NIH (R01AI081534) and NIH (R21AI087107).
REFERENCES
- 1.UNAIDS. Report on the global AIDS epidemic. [Accessed November 20, 2009]; Available at http://data.unaids.org/pub/GlobalReport/2008/JC1510_2008GlobalReport_en.zip. [Google Scholar]
- 2.Souteyrand YP, Collard V, Moatti JP, et al. Free care at the point of service delivery: a key component for reaching universal access to HIV/AIDS treatment in developing countries. AIDS. 2008;22(Suppl 1):S161–S168. doi: 10.1097/01.aids.0000327637.59672.02. [DOI] [PubMed] [Google Scholar]
- 3.Mee P, Fielding KL, Charalambous S, et al. Evaluation of the WHO criteria for antiretroviral treatment failure among adults in South Africa. AIDS. 2008;22(15):1971–1977. doi: 10.1097/QAD.0b013e32830e4cd8. [DOI] [PubMed] [Google Scholar]
- 4.van Oosterhout JJG, Brown L, Weigel R, et al. Diagnosis of antiretroviral therapy failure in Malawi: poor performance of clinical and immunological WHO criteria. Tropical Medicine & International Health. 2009;14(8):856–861. doi: 10.1111/j.1365-3156.2009.02309.x. [DOI] [PubMed] [Google Scholar]
- 5.Fiscus SA, Cheng B, Crowe SM, et al. HIV-1 viral load assays for resource-limited settings. PLoS Med. 2006;3(10):e417. doi: 10.1371/journal.pmed.0030417. [DOI] [PMC free article] [PubMed] [Google Scholar]
- 6.Stevens G, Rekhviashvili N, Scott LE, et al. Evaluation of two commercially available, inexpensive alternative assays used for assessing viral load in a cohort of human immunodeficiency virus type 1 subtype C-infected patients from South Africa. J Clin Microbiol. 2005;43(2):857–861. doi: 10.1128/JCM.43.2.857-861.2005. [DOI] [PMC free article] [PubMed] [Google Scholar]
- 7.Malmsten A, Shao XW, Aperia K, et al. HIV-1 viral load determination based on reverse transcriptase activity recovered from human plasma. J Med Virol. 2003;71(3):347–359. doi: 10.1002/jmv.10492. [DOI] [PubMed] [Google Scholar]
- 8.Rouet F, Ekouevi DK, Chaix ML, et al. Transfer and evaluation of an automated, low-cost real-time reverse transcription-PCR test for diagnosis and monitoring of human immunodeficiency virus type 1 infection in a West African resource-limited setting. J Clin Microbiol. 2005;43(6):2709–2717. doi: 10.1128/JCM.43.6.2709-2717.2005. [DOI] [PMC free article] [PubMed] [Google Scholar]
- 9.Drosten C, Panning M, Drexler JF, et al. Ultrasensitive monitoring of HIV-1 viral load by a low-cost real-time reverse transcription-PCR assay with internal control for the 5' long terminal repeat domain. Clin Chem. 2006;52(7):1258–1266. doi: 10.1373/clinchem.2006.066498. [DOI] [PMC free article] [PubMed] [Google Scholar]
- 10.Labbett W, Garcia-Diaz A, Fox Z, et al. Comparative evaluation of the ExaVir Load version 3 reverse transcriptase assay for measurement of human immunodeficiency virus type 1 plasma load. J Clin Microbiol. 2009;47(10):3266–3270. doi: 10.1128/JCM.00715-09. [DOI] [PMC free article] [PubMed] [Google Scholar]
- 11.Lee WG, Kim YG, Chung BG, et al. Nano/Microfluidics for diagnosis of infectious diseases in developing countries. Adv Drug Deliv Rev. 2010;62(4–5):449–457. doi: 10.1016/j.addr.2009.11.016. [DOI] [PMC free article] [PubMed] [Google Scholar]
- 12.Lee K-B, Kim E-Y, Mirkin CA, et al. The Use of Nanoarrays for Highly Sensitive and Selective Detection of Human Immunodeficiency Virus Type 1 in Plasma. Nano Letters. 2004;4(10):1869–1872. [Google Scholar]
- 13.Sia SK, Linder V, Parviz BA, et al. An integrated approach to a portable and low-cost immunoassay for resource-poor settings. Angew Chem Int Ed Engl. 2004;43(4):498–502. doi: 10.1002/anie.200353016. [DOI] [PubMed] [Google Scholar]
- 14.Bhattacharyya A, Klapperich CM. Design and testing of a disposable microfluidic chemiluminescent immunoassay for disease biomarkers in human serum samples. Biomed Microdevices. 2007;9(2):245–251. doi: 10.1007/s10544-006-9026-2. [DOI] [PubMed] [Google Scholar]
- 15.Lee SH, Kim SW, Kang JY, et al. A polymer lab-on-a-chip for reverse transcription (RT)-PCR based point-of-care clinical diagnostics. Lab Chip. 2008;8(12):2121–2127. doi: 10.1039/b811131f. [DOI] [PubMed] [Google Scholar]
- 16.Kim YG, Moon S, Kuritzkes DR, et al. Quantum dot-based HIV capture and imaging in a microfluidic channel. Biosens Bioelectron. 2009;25(1):253–258. doi: 10.1016/j.bios.2009.06.023. [DOI] [PMC free article] [PubMed] [Google Scholar]
- 17.Alyassin MA, Moon S, Keles HO, et al. Rapid automated cell quantification on HIV microfluidic devices. Lab Chip. 2009;9(23):3364–3369. doi: 10.1039/b911882a. [DOI] [PMC free article] [PubMed] [Google Scholar]
- 18.Moon S, Keles HO, Ozcan A, et al. Integrating microfluidics and lensless imaging for point-of-care testing. Biosens Bioelectron. 2009;24(11):3208–3214. doi: 10.1016/j.bios.2009.03.037. [DOI] [PMC free article] [PubMed] [Google Scholar]
- 19.Barre-Sinoussi F, Chermann JC, Rey F, et al. Isolation of a T-lymphotropic retrovirus from a patient at risk for acquired immune deficiency syndrome (AIDS) Science. 1983;220(4599):868–871. doi: 10.1126/science.6189183. [DOI] [PubMed] [Google Scholar]
- 20.Miwa J, Suzuki Y, Kasagi N. Adhesion-based cell sorter with antibody-coated amino-functionalized-parylene surface. Journal of Microelectromechanical Systems. 2008;17(3):611–622. [Google Scholar]
- 21.Freed EO. HIV-1 replication. Somat Cell Mol Genet. 2001;26(1–6):13–33. doi: 10.1023/a:1021070512287. [DOI] [PubMed] [Google Scholar]


