Abstract
Purpose
Nomograms are statistically based tools that provide the overall probability of a specific outcome. They have shown better individual discrimination than the current TNM staging system in numerous patient tumor models. The pancreatic nomogram combines individual clinicopathologic and operative data to predict disease-specific survival at 1, 2, and 3 years from initial resection. A single US institution database was used to test the validity of the pancreatic adenocarcinoma nomogram established at Memorial Sloan-Kettering Cancer Center.
Patients and Methods
The nomogram was created from a prospective pancreatic adenocarcinoma database that included 555 consecutive patients between October 1983 and April 2000. The nomogram was validated by an external patient cohort from a retrospective pancreatic adenocarcinoma database at Massachusetts General Hospital that included 424 consecutive patients between January 1985 and December 2003.
Results
Of the 424 patients, 375 had all variables documented. At last follow-up, 99 patients were alive, with a median follow-up time of 27 months (range, 2 to 151 months). The 1-, 2-, and 3-year disease-specific survival rates were 68% (95% CI, 63% to 72%), 39% (95% CI, 34% to 44%), and 27% (95% CI, 23% to 32%), respectively. The nomogram concordance index was 0.62 compared with 0.59 with the American Joint Committee on Cancer (AJCC) stage (P = .004). This suggests that the nomogram discriminates disease-specific survival better than the AJCC staging system.
Conclusion
The pancreatic cancer nomogram provides more accurate survival predictions than the AJCC staging system when applied to an external patient cohort. The nomogram may aid in more accurately counseling patients and in better stratifying patients for clinical trials and molecular tumor analysis.
INTRODUCTION
The majority of the approximately 27,400 patients who will develop pancreatic adenocarcinoma in the United States in 2005 will die of their disease within 2 years. Despite multiple trials with adjuvant chemoradiotherapy, surgery remains the only effective therapy that offers any prospect of significant long-term survival. However, even for the minority of patients who are surgical candidates, the duration of survival is poor. The current American Joint Committee on Cancer (AJCC) TNM staging system attempts to predict patient survival; however, it is relatively nondiscriminatory for the resected patient.1
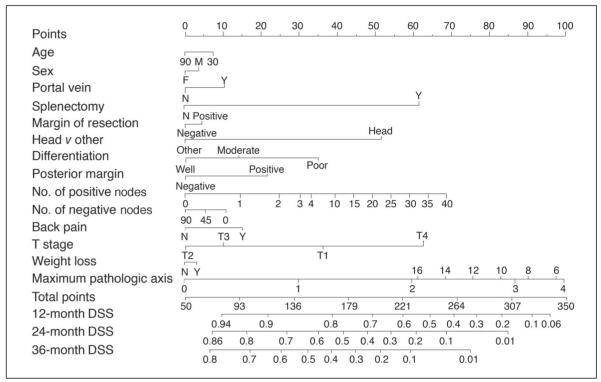
In an attempt to better predict an individual patient’s disease-specific survival, Brennan et al2 developed a nomogram that predicts the probability that a patient will die of pancreatic adenocarcinoma within 3 years of surgery (Fig 1). Nomograms are statistically based tools that provide the overall probability of a specific outcome.3 They have been developed and validated for prostate cancer, sarcoma, and gastric cancer.4-6
Fig 1.
Instructions: Locate patient’s variable on the corresponding axis. Draw a line to the Points axis. Sum the points. Draw a line from the Total Points axis to the 12-, 24-, 36-Month DSS axis to determine the patient’s probability of dying from adenocarcinoma within 3 years, assuming the patient does not die of another cause first. DSS, disease-specific survival; M, male; F, female; Y, yes; N, no.
Nomograms are able to evaluate a large number of significant variables to better predict an individual patient’s outcome. The Memorial Sloan-Kettering Cancer Center (MSKCC) Pancreatic Adenocarcinoma Nomogram is based on pertinent patient and pathologic information including age, sex, tumor location, type of resection, margin of resection, histologic differentiation, size, T stage, and N stage.7,8 Current staging systems do not incorporate these factors.
The purpose of this study is to assess the predictive accuracy of the MSKCC Pancreatic Adenocarcinoma Nomogram when applied to patients from another high-volume US institution. The MSKCC Pancreatic Adenocarcinoma Nomogram was developed and validated internally, but this is the first opportunity to test the validation by an external cohort of patients. External validation is essential to assure that the nomogram is universally applicable. The 424 consecutive patients with pancreatic adenocarcinoma who underwent resection at the Massachusetts General Hospital (MGH) served as the external patient cohort to assess the accuracy of the MSKCC Pancreatic Adenocarcinoma Nomogram as a tool to predict disease-specific survival in a different patient population. We then compared the discriminating value of the nomogram to the AJCC staging system.
PATIENTS AND METHODS
From January 1, 1985, to December 31, 2003, 424 consecutive patients with pancreatic adenocarcinoma underwent surgical resection at MGH. All patient data were entered retrospectively by a single investigator. Patients who presented with metastatic disease or locally advanced disease precluding them from a pancreatic resection were excluded. The variables required for validation of the MSKCC nomogram were age, sex, weight loss, portal vein resection (yes or no), splenectomy (yes or no), margin of resection (positive or negative), location of the tumor (head v other), histologic differentiation (well, moderate, or poor), posterior margin status (positive or negative), number of positive nodes, number of negative nodes, back pain, T stage, and maximal tumor size (cm). Maximal tumor size was defined as maximum diameter at pathologic analysis. Margins assessed for the MGH cohort included the pancreatic resection margin, biliary margin, posterior margin, retroperitoneal margin, and mesenteric margin. Margins assessed for the MSKCC cohort included the pancreatic resection margin, anterior free peritoneal margin, and the posterior margin, which encompasses all of the retroperitoneal margins, including the groove for the mesenteric vessels.
Patients with one or more variables missing were excluded, leaving 375 patients with all nomogram variables, AJCC stage, and follow-up documented. For each of these patients, the 1-, 2-, and 3-year disease-specific survival probabilities were computed and compared with the AJCC stage on the basis of discrimination ability as measured by the concordance index.
Statistical Methods
Disease-specific survival was defined as the time from surgery to either death caused by disease or last follow-up. Nomogram validation comprised two activities. First, discrimination was quantified with the concordance index.9 The concordance index provides the probability that, in a randomly selected pair of patients in which one patient dies of pancreatic cancer before the other, the patient who died first had the worse predicted outcome from the nomogram. This calculation assumes that the patient with the shorter follow-up experienced failure. If both patients experience failure at the same time or if the surviving patient has a shorter follow-up, the probability does not apply to that pair of patients. A Z test was used to evaluate the difference between nomogram and staging system concordance indices.
Second, calibration was assessed. Calibration compares the predicted probability of disease-specific survival with the actual survival. This was performed by grouping patients according to their nomogram-predicted probabilities and then comparing the mean of the group with the observed Kaplan-Meier disease-specific survival estimate. All analyses were performed using S-Plus 2000 professional software, version 3.3 (Statistical Sciences, Seattle, WA) with the Design and Hmisc libraries added.10
RESULTS
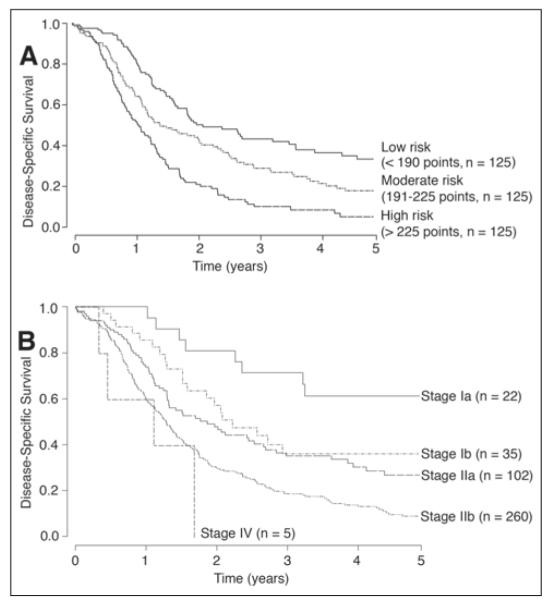
The operative and descriptive statistics for the MGH and MSKCC cohorts are listed in Tables 1, 2, and 3. The two large cohorts comprised similar populations, with similar 1-, 2-, and 3-year disease-specific survivals. The disease-specific survival rate at 1 year was 68% in both cohorts; the disease-specific survival rates at 2 and 3 years were 39% v 35% and 27% v 20% for the MGH versus MSKCC cohorts, respectively. In the MGH cohort, there was a total of 424 patients, of whom 375 patients had all variables documented. At last follow-up, 99 patients were alive, with a median follow-up of 27 months (range, 2 to 151 months). Kaplan-Meier survival curves for the MGH cohort were stratified by nomogram tertiles and AJCC stage (Figs 2A and 2B).
Table 1.
Operative Details for Patients Undergoing Resection for Adenocarcinoma of the Pancreas at MGH and MSKCC
| MGH* |
MSKCC† |
|||||
|---|---|---|---|---|---|---|
| Operative Characteristic | No. of Patients |
% | No. of Patients |
% | ||
| Laparoscopy | 102 | 24 | 272 | 49 | ||
| Pancreaticoduodenectomy | 354 | 83 | 472 | 85 | ||
| Distal pancreatectomy | 55 | 13 | 56 | 10 | ||
| Total pancreatectomy | 15 | 4 | 27 | 5 | ||
| Median length of hospital stay, days | 11 | 15 | ||||
| 30-Day perioperative mortality | 1 | 2.8 | ||||
Abbreviations: MGH, Massachusetts General Hospital; MSKCC, Memorial Sloan-Kettering Cancer Center.
Patients treated from January 1985 to December 2003.
Patients treated from October 1983 to April 2000.
Table 2.
Descriptive Statistics for Pancreatic Adenocarcinoma Patient Cohorts Who Underwent Resection at MGH and MSKCC
| MGH |
MSKCC |
|||
|---|---|---|---|---|
| Characteristic | No. of Patients |
% | No. of Patients |
% |
| Age at operation, years | ||||
| Minimum | 33 | 34 | ||
| Median | 67 | 66 | ||
| Mean | 65 | 65 | ||
| Maximum | 90 | 89 | ||
| Sex | ||||
| Female | 221 | 52 | 277 | 50 |
| Male | 203 | 48 | 278 | 50 |
| Back pain | ||||
| Yes | 220 | 52 | 76 | 14 |
| No | 202 | 48 | 479 | 86 |
| Weight loss | ||||
| Yes | 273 | 64 | 298 | 54 |
| No | 151 | 36 | 257 | 46 |
| Tumor location | ||||
| Head | 358 | 84 | 496 | 89 |
| Other, body/tail | 66 | 15 | 59 | 11 |
| Portal vein resected | ||||
| Yes | 21 | 5 | 80 | 14 |
| No | 403 | 95 | 475 | 86 |
| Splenectomy | ||||
| Yes | 40 | 10 | 55 | 10 |
| No | 384 | 90 | 500 | 90 |
| Differentiation | ||||
| Well | 182 | 43 | 75 | 14 |
| Moderate | 223 | 52 | 298 | 54 |
| Poor | 1 | < 1 | 156 | 28 |
| Unknown | 22 | 5 | 26 | 5 |
| Margin of resection | ||||
| Negative | 290 | 68 | 440 | 79 |
| Positive | 138 | 32 | 115 | 21 |
| Posterior margin | ||||
| Negative | 328 | 77 | 460 | 83 |
| Positive | 42 | 23 | 75 | 14 |
| NA | 20 | 3 | ||
| Tumor stage | ||||
| T1 | 32 | 7.5 | 20 | 4 |
| T2 | 76 | 18 | 64 | 12 |
| T3 | 313 | 74 | 445 | 80 |
| T4 | 0 | 0 | 9 | 1 |
| Unknown | 3 | 0.5 | 17 | 3 |
| No. of positive nodes | ||||
| Minimum | 0 | 0 | ||
| First quartile | 0 | 0 | ||
| Median | 1 | 1 | ||
| Mean | 2.2 | 2.1 | ||
| Third quartile | 3 | 3 | ||
| Maximum | 18 | 39 | ||
| No. of negative nodes | ||||
| Minimum | 0 | 0 | ||
| First quartile | 4 | 9 | ||
| Median | 8 | 15 | ||
| Mean | 9.3 | 17 | ||
| Third quartile | 12 | 22 | ||
| Maximum | 37 | 83 | ||
Abbreviations: MGH, Massachusetts General Hospital; MSKCC, Memorial Sloan-Kettering Cancer Center; NA, not available.
Table 3.
Adjuvant Therapy Details for Patients Undergoing Resection for Adenocarcinoma of the Pancreas at MGH and MSKCC
| MGH |
MSKCC |
|||
|---|---|---|---|---|
| Adjuvant Therapy | No. of Patients |
% | No. of Patients |
% |
| Preoperative chemotherapy | ||||
| Yes | 12 | 2.8 | 6 | 1 |
| No | 412 | 97 | 549 | 99 |
| Postoperative chemotherapy | ||||
| Yes | 233 | 55 | 222 | 40 |
| No | 47 | 11 | 226 | 41 |
| Unknown | 144 | 34 | 107 | 19 |
| Preoperative XRT | ||||
| Yes | 116 | 27 | 6 | 1 |
| No | 308 | 73 | 549 | 99 |
| Intraoperative XRT | ||||
| Yes | 29 | 7 | 0 | 0 |
| No | 395 | 93 | 555 | 100 |
| Postoperative XRT | ||||
| Yes | 220 | 52 | 163 | 29 |
| No | 65 | 15 | 194 | 35 |
| Unknown | 139 | 33 | 192 | 35 |
Abbreviations: MGH, Massachusetts General Hospital; MSKCC, Memorial Sloan-Kettering Cancer Center; XRT, radiotherapy.
Fig 2.
Kaplan-Meier survival curves for the Massachusetts General Hospital cohort of 375 patients based on (A) nomogram groupings and (B) American Joint Committee on Cancer stage.
One of the main differences between the cohorts included a higher rate of R0 resections in the MSKCC group. Overall 138 patients (32%) in the MGH cohort had a positive resection margin compared with 115 patients (21%) in the MSKCC cohort. Of the patients with positive margins in the MGH cohort, 76 (55%) had a positive pancreatic margin, 15 (11%) had a positive biliary margin, 48 (35%) had a positive posterior margin, 53 (38%) had a positive retroperitoneal margin, and 14 (10%) had a positive mesenteric margin. Of the patients with positive margins in the MSKCC cohort, 95 (83%) had a positive pancreatic margin, 20 (17%) had a positive anterior margin, and 75 (65%) had a positive posterior resection margin. The higher rate of margin positivity in the MGH cohort may be a result of more stringent margin subclassification.
Additional differences between the two cohorts included a higher number of patients with poorly differentiated lesions, a higher rate of portal vein resections, and a lower percentage of patients who presented with back pain in the MSKCC cohort. Also, a higher percentage of patients in the MGH cohort received perioperative chemotherapy and radiation therapy.
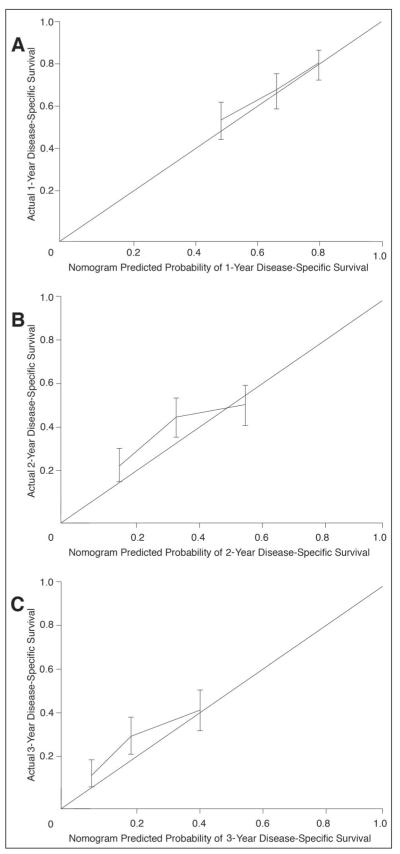
The nomogram concordance index was 0.62. The calibration plot illustrates how the prediction of the nomogram compares with the actual outcomes of the MGH data set (Figs 3A, 3B, and 3C). The x axis is the prediction calculated with the use of the nomogram, and the y axis is the observed 3-year disease-specific survival for the MGH data set. The diagonal line represents the performance of an ideal nomogram, where predicted outcome would correspond perfectly with the actual outcome. The line with error bars represents the performance of the MSKCC Pancreatic Adenocarcinoma Nomogram applied to the MGH data set. The correspondence between the actual and ideal nomogram predictions suggests a good calibration of the nomogram in the validation cohort.
Fig 3.
Calibration of the Memorial Sloan-Kettering Cancer Center (MSKCC) nomogram with the Massachusetts General Hospital (MGH) data set. Nomogram applied to the MGH data set (n = 375) at (A) 1 year, (B) 2 years, and (C) 3 years. The diagonal line represents the performance of an ideal nomogram. The line containing error bars (95% CI) represents the performance of the MSKCC nomogram applied to the MGH data set.
To further evaluate the concordance index, we analyzed the pancreatic head lesions and pancreatic body and tail lesions separately. The concordance index improved to 0.632 when applying the nomogram to the 64 patients with adenocarcinoma of the body or tail of the pancreas. The concordance index slightly decreased to 0.618 when evaluating only pancreatic head lesions.
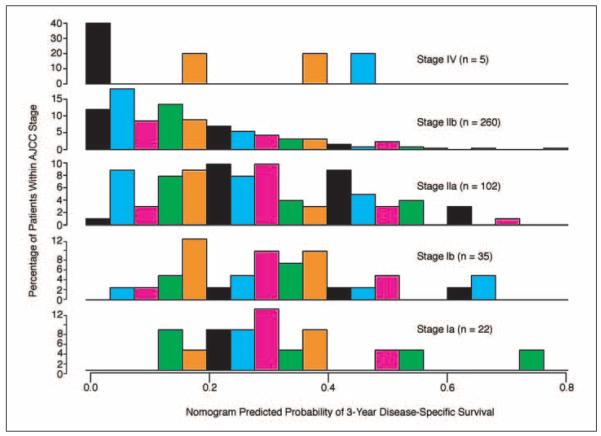
The predictions obtained from the nomogram were then compared with the predictions obtained using the AJCC stage groupings. The concordance index of the AJCC staging system was 0.59 (P = .004 v nomogram). This demonstrates that the nomogram discrimination was superior to the AJCC stage grouping. A histogram (Fig 4) of the nomogram probabilities was created for each stage, demonstrating the heterogeneity within each AJCC stage.
Fig 4.
Comparisons of nomogram predictions with the predictions of the American Joint Committee on Cancer (AJCC) stage groupings. Note the heterogeneity of predicted survival probabilities within each AJCC stage.
DISCUSSION
Patients with pancreatic adenocarcinoma have a poor survival, even when they are fortunate enough to undergo resection of their tumor. However, their cancers have differing genetic, cellular, and behavioral characteristics, and their survival is not uniform. Patient prognosis is currently estimated on the basis of the AJCC staging system, which does not factor in prognostic determinants other than the T, N, and M stages. By integrating additional significant prognostic factors, a nomogram can be used to better assess an individual patient’s disease-specific survival. On the basis of findings from the large prospective pancreatic adenocarcinoma database at MSKCC, Brennan et al2 developed a nomogram that estimates disease-specific survival probabilities for the 3-year period immediately after surgery. Although accurate by internal validation methods, this is the first time it was validated by an external cohort.
The clinicopathologic characteristics and disease-specific survival observed in the MGH and MSKCC cohorts were remarkably similar. The only major differences between the two cohorts were the numbers of patients who presented with back pain, received perioperative adjuvant therapy, and had portal vein resection performed and the numbers of specimens with poor histologic differentiation. The higher rate of poorly differentiated tumors, the higher rate of portal vein resections for presumably more advanced tumors, and the lower rate of perioperative adjuvant therapy may explain the lower survival rate in the MSKCC cohort.
A concordance index of 0.62 was generated when the MSKCC Pancreatic Adenocarcinoma Nomogram was applied to the MGH data set (n = 375). A concordance index of 0.62 implies that, for two randomly selected patients, if the patient with the shorter follow-up suffers a disease-specific death, then the nomogram has a 62% chance of predicting a longer pancreatic adenocarcinoma–specific survival for the other patient. Although not perfect, this represents an encouraging level of predictive accuracy. This can be put into perspective when compared with other predictive models such as the Gail Model11 for breast cancer, which has a concordance index of 0.58, recognizing that the concordance index ranges from 0.5 (chance) to 1.0 (perfect discrimination).
Resectable pancreatic lesions of the head, body, and tail have similar long-term survival rates.12 An improved concordance index of 0.638 is seen when only analyzing patients with body and tail lesions. This may be because of a difference in the clinical presentation of these lesions or because there is less variability and complexity to the evaluation of margins in patients undergoing a distal pancreatectomy compared with a pancreaticoduodenectomy. However, strong conclusions cannot be derived from a cohort of only 64 patients.
We conducted an additional analysis to determine whether the nomogram represents an improvement over the current AJCC staging system. The nomogram’s concordance index is significantly superior to the concordance index of the AJCC staging system (P = .004). This indicates that the nomogram discriminates disease-specific survival better than the AJCC staging system. Figure 4 emphasizes the heterogeneity within each AJCC stage. The histogram of the nomogram-predicted probabilities demonstrates the most striking heterogeneity for the stage IIA and IIB patients. This may be a result of the extent of lymph node resection by the surgeon or the pathologist’s diligence in identifying lymph nodes in the specimen. By incorporating statistically predictive variables other than the T, N, and M stages, a more accurate disease-specific survival can be estimated for the individual patient.
The concordance index addresses the ability of the nomogram to accurately discriminate a patient’s individual mortality risk. However, it does not address calibration accuracy. Disease-specific survival rates observed in the MGH cohort were plotted against those predicted by the nomogram. Figures 3A, 3B, and 3C demonstrate that the MSKCC Pancreatic Adenocarcinoma Nomogram is well calibrated.
The role of adjuvant therapy for pancreatic adenocarcinoma remains incompletely defined.13,14 Multiple trials have been negative or shown minimal benefit. The results have often been confounded by inadequate numbers of patients and a wide range in survival within AJCC stage groupings. Using the pancreatic nomogram, patients entered onto clinical trials could be more stringently stratified. By selecting a group with a more homogeneous prognosis, the interpretation of trial outcomes may become clearer.
The nomogram has limitations because the factors impacting survival are incompletely known at present. However, by taking into account a greater number of known factors, this postresection nomogram allows for a more realistic approximation of whether an individual patient will be alive for a defined period of time. As our understanding of the disease progresses, clinical, pathologic, and biologic markers can be incorporated to further the refinement of this predictive tool.
With the availability of this external validation, individual patient counseling and tailored adjuvant therapy decision making should be encouraged. The nomogram is available at www.nomograms.org.
Footnotes
Authors’ Disclosures of Potential Conflicts of Interest The authors indicated no potential conflicts of interest.
REFERENCES
- 1.Green FL, Page DL, Fleming ID, et al., editors. AJCC Cancer Staging Manual. ed 6 Springer; New York, NY: 2002. [Google Scholar]
- 2.Brennan MF, Kattan MW, Klimstra D, et al. Prognostic nomogram for patients undergoing resection for adenocarcinoma of the pancreas. Ann Surg. 2004;240:293–298. doi: 10.1097/01.sla.0000133125.85489.07. [DOI] [PMC free article] [PubMed] [Google Scholar]
- 3.Banks J. Nomograms. Wiley; New York, NY: 1985. [Google Scholar]
- 4.Kattan MW, Eastham JA, Stapleton AM, et al. A preoperative nomogram for disease recurrence following radical prostatectomy for prostate cancer. J Natl Cancer Inst. 1998;90:766–771. doi: 10.1093/jnci/90.10.766. [DOI] [PubMed] [Google Scholar]
- 5.Kattan MW, Leung DH, Brennan MF. Postoperative nomogram for 12-year sarcomaspecific death. J Clin Oncol. 2002;20:791–796. doi: 10.1200/JCO.2002.20.3.791. [DOI] [PubMed] [Google Scholar]
- 6.Kattan MW, Karpeh MS, Mazumdar M, et al. Postoperative nomogram for disease-specific survival after an R0 resection for gastric carcinoma. J Clin Oncol. 2003;21:3647–3650. doi: 10.1200/JCO.2003.01.240. [DOI] [PubMed] [Google Scholar]
- 7.Geer RJ, Brennan MF. Prognostic indicators for survival after resection of pancreatic adenocarcinoma. Am J Surg. 1993;165:68–72. doi: 10.1016/s0002-9610(05)80406-4. [DOI] [PubMed] [Google Scholar]
- 8.Yeo CJ, Cameron JL. Prognostic factors in ductal pancreatic cancer. Langenbecks. Arch Surg. 1998;383:129–133. doi: 10.1007/s004230050104. [DOI] [PubMed] [Google Scholar]
- 9.Harrell FE, Jr, Califf RM, Pryor DB, et al. Evaluating the yield of medical tests. JAMA. 1982;247:2543–2546. [PubMed] [Google Scholar]
- 10.Harrell FE., Jr . Regression Modeling Strategies With Applications to Linear Models, Logistic Regression, and Survival Analysis. Springer Verlag; New York, NY: 2001. [Google Scholar]
- 11.Rockhill B, Spiegelman D, Byrne C, et al. Validation of the Gail et al. model of breast cancer risk prediction and implications for chemoprevention. J Natl Cancer Inst. 2001;93:358–366. doi: 10.1093/jnci/93.5.358. [DOI] [PubMed] [Google Scholar]
- 12.Dalton RR, Sarr MG, van Heerden JA, et al. Carcinoma of the body and tail of the pancreas: Is curative resection justified? Surgery. 1992;111:489–494. [PubMed] [Google Scholar]
- 13.Brennan MF. Adjuvant therapy following resection for pancreatic adenocarcinoma. Surg Oncol Clin N Am. 2004;13:555–566. doi: 10.1016/j.soc.2004.06.008. [DOI] [PubMed] [Google Scholar]
- 14.Stojadinovic A, Conlon K, Brennan MF. Prospective randomized clinical trials in pancreatic cancer. Surg Oncol Clin N Am. 2002;11:207–229. doi: 10.1016/s1055-3207(03)00082-6. [DOI] [PubMed] [Google Scholar]


